
May 21, 2024
An Example SEO Report Template for Agencies
By Megalytic Staff - January 19, 2017
Key Performance Indicators
At the top of your report, highlight KPIs (key performance indicators) that summarize organic search performance at a glance. Megalytic’s Multi-KPI Widget allows you to easily show multiple metrics in a concise format, comparing data to previous periods. Providing context against past months and years will help to show whether the numbers have increased or decreased over time.
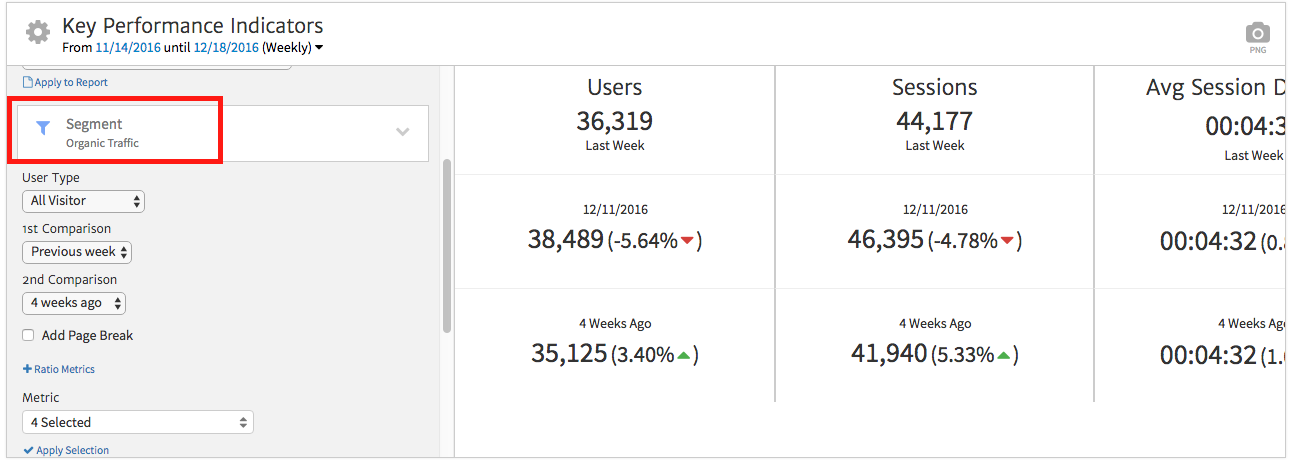
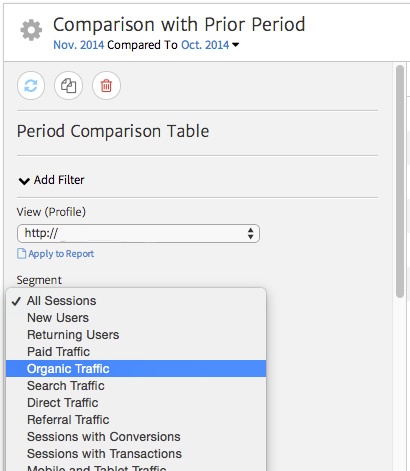
To customize this widget specifically for organic search, go to the Segment section of the widget options, and select the Organic Traffic section. Once you’ve applied to the widget, the numbers will update to include only organic search metrics.
Overall Organic Traffic
The first thing to add to your SEO report template is an overview of organic search performance. Megalytic’s Rolling Average Comparison can compare weekly traffic to a “rolling average” of how traffic has fared over a longer period of time.
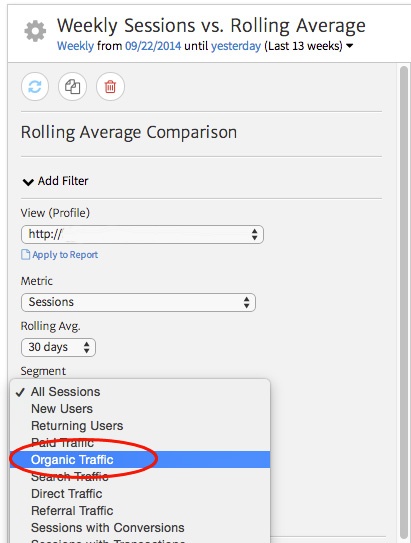
To set up this widget to show only organic sessions, click the top gear to customize the data. Next, select “Organic Traffic” from the Segment dropdown. You’ll then see the final report showing average organic traffic over your chosen time period.
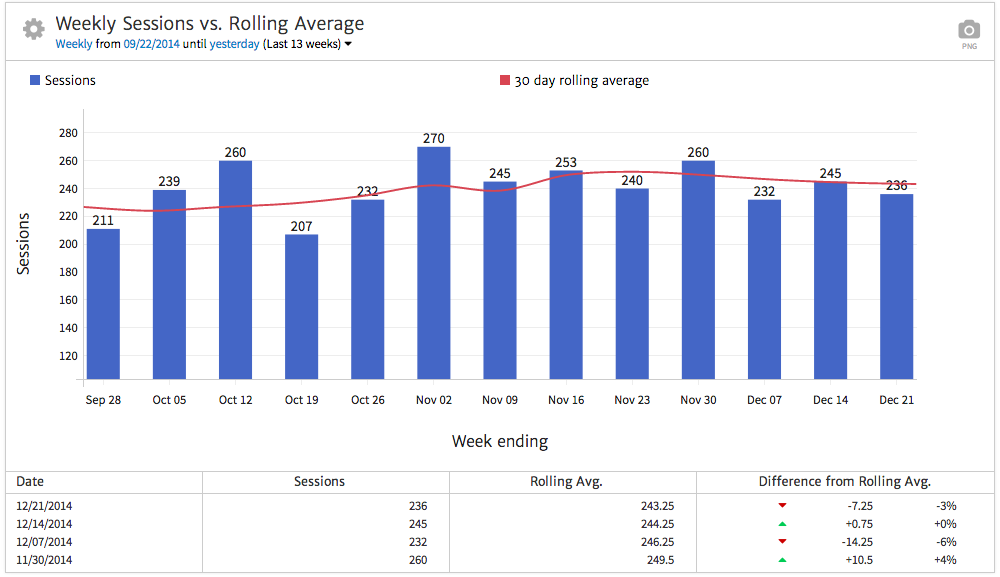
From this data, we see that while organic traffic has fluctuated week to week, it has remained relatively steady, with a slight upward trend heading toward the end of the year.
By showing the big picture, we can encourage the client to avoid focusing on brief spikes or decreases in traffic but to look at performance over a longer period of time.

Specific Organic Metrics
Once we’ve taken in a broad overview, it’s time to dig deeper. We do this by looking at a breakdown of sessions, engagement, and conversions from organic traffic for the last month. Depending on the nature of the client, it typically makes sense to compare performance to the previous month and the previous year. We’ll add the Period Comparison Table widget and customize it to display only organic traffic with select metrics.
First, use the date selector at the top of the widget to choose the target date range, along with a previous period for comparison. Next, filter to show just organic traffic. After clicking the gear symbol in the upper left of the widget to see options, select “Organic Traffic” from the Segment dropdown.
Next, use the Rows dropdown to add Completions and Conversion rate. This will allow you to look at Goals along with the default sessions, users and engagement statistics.
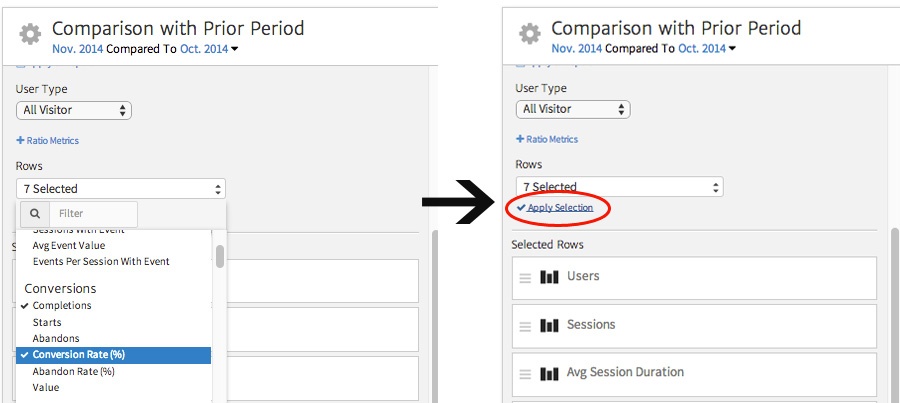
After selecting these metrics, click “Apply Selection” to finalize the widget.
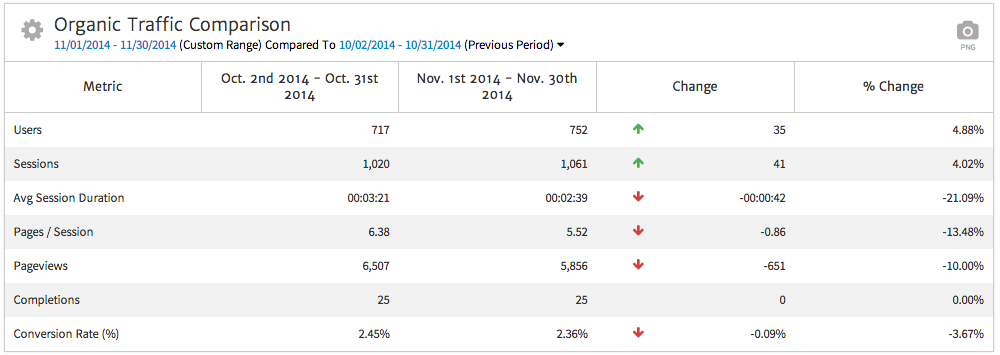
From this data, we can see that while total users and sessions from organic search have increased, the quality of these visits appears to have decreased. Users are spending less time on the site and looking at fewer pages. In addition, while the number of Goal completions has remained steady, conversion rate has decreased slightly.
To explain why changes have occurred in organic traffic, an SEO report template should include details on the pages accessed via organic search, along with engagement metrics for each.
Top Organic Landing Pages
To show this data, we’ll add the Traffic by Landing Page widget. After selecting a date range, we once again click the gear symbol to customize the widget. We can choose to filter with the segment dropdown to show only organic traffic, just as with the previous example.
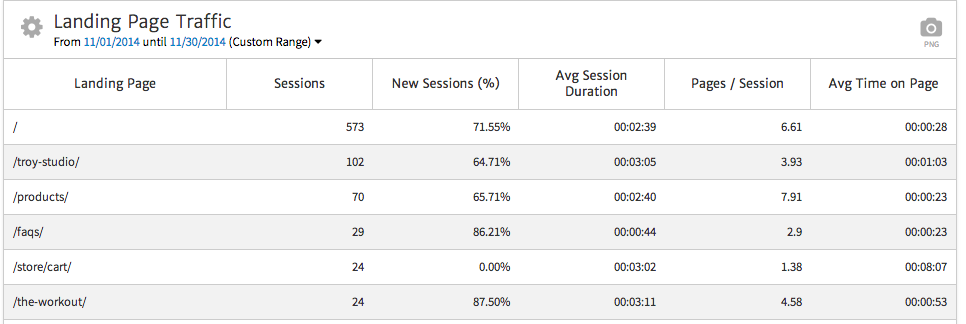
Here, we can flag specific landing pages based on performance to see how they may be contributing to lower engagement. For example, note that people are landing directly on the /faqs/ page in search and spending much less time on the site than people who arrive via other pages. In order to address this concern, your client should consider revising the FAQs page to include calls-to-action in order to browse products elsewhere in the site. It should also be taken into account that people land on this page both as their first contact with the brand and as returning visitors looking to answer a question. To add observations like this for your client, include Notes Widgets throughout the report. This will allow you to comment on data being presented and offer suggestions for improvement.
Top Search Queries
Next, we should show the client the top queries leading people to visit the site from Google’s search results. Search Console will allow us to see how many times a site showed up for a particular search query (impressions), how many clicks from that query led people to the site, the resulting average clickthrough rate, and the average position in search results.
To show this information, add the Top Queries widget and select your client’s Search Console account. You may want to exclude searches for your client’s brand name. To do this, click the gear to customize the widget and select “Show Filter” in the top of the edit area. Set up the filter to exclude mentions of the brand name. You may also need to include variant spellings depending on the volume of searches. Click “Apply” to save the filter and you’ll see a list of your top non-branded search queries.
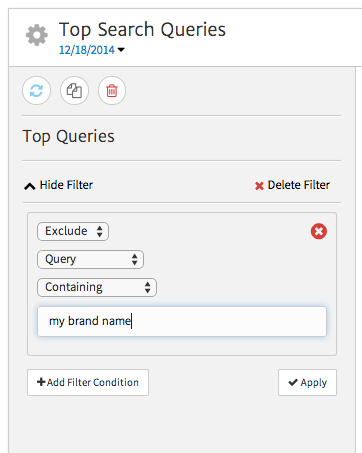
This data can help a client see how users think when searching for a product like theirs by examining the wording of their queries. In addition, we can flag high impression keywords with low clickthrough rates, where titles and meta descriptions could be revised to better grab the attention of searchers. Finally, high impressions combined with low rankings show opportunity to optimize these keywords to show up higher for relevant searches.
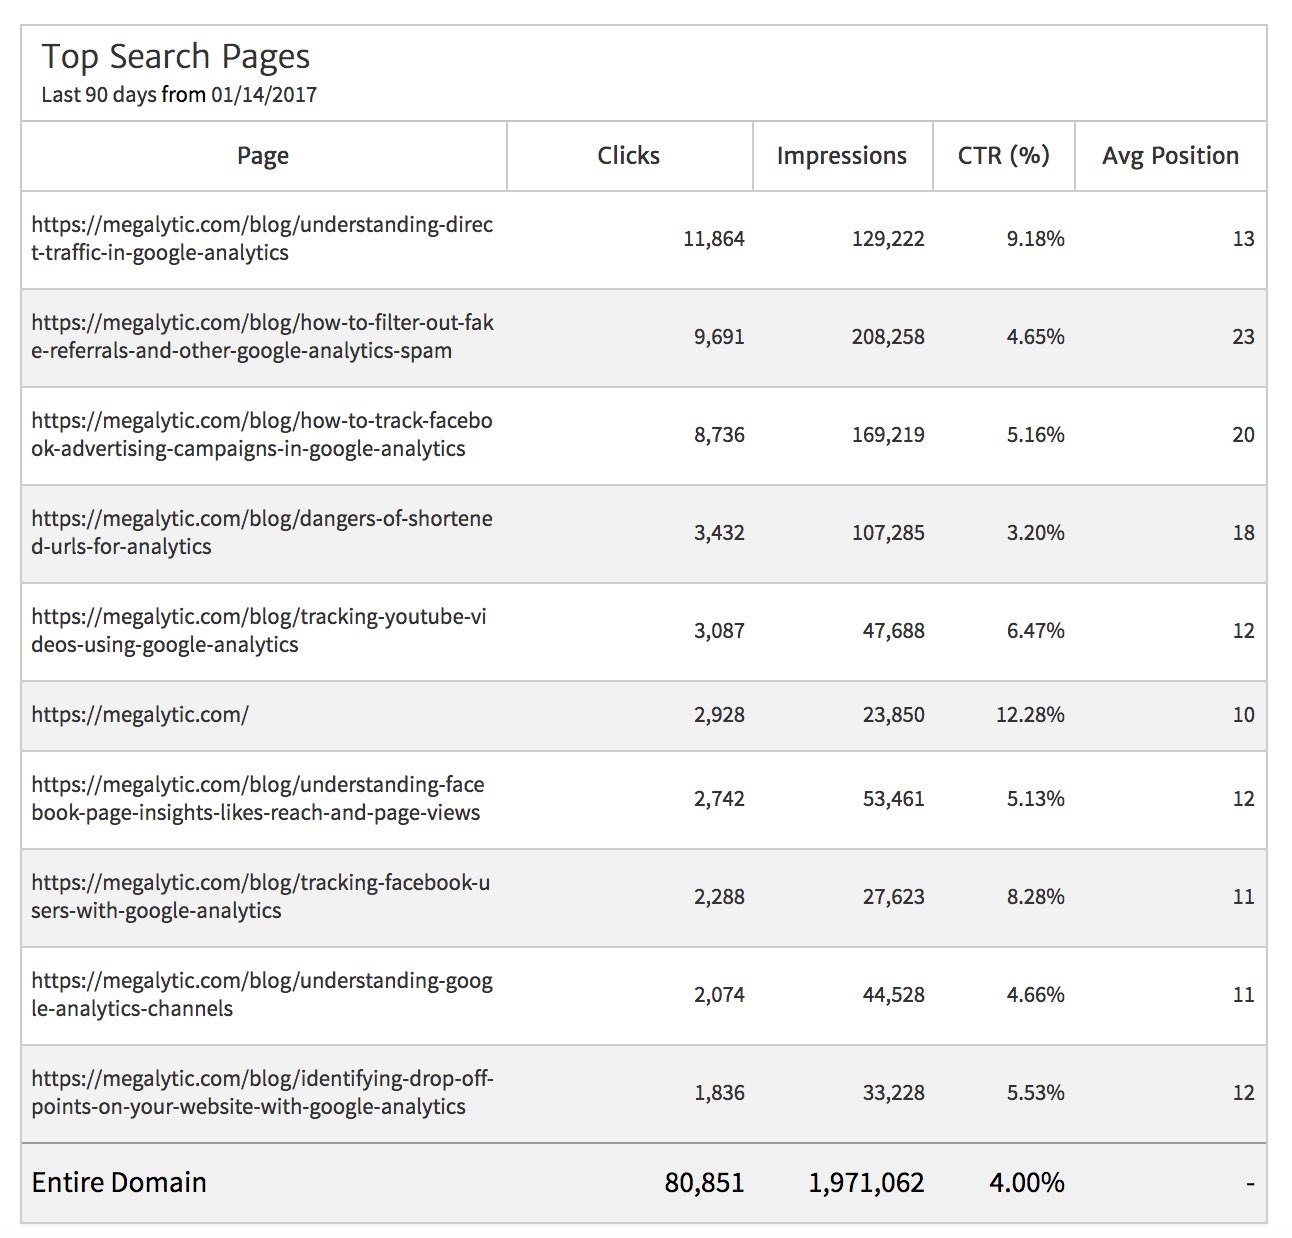
Top Pages (Search Console)
As online marketing moves increasingly toward audience-based targeting over keyword-based targeting, you should also show top organic pages. Integrating Search Console data will allow you to include pages correlated with data.
Showing this widget in addition to the Google Analytics widget (Traffic by Landing Pages) will provide additional metrics and context around how many times pages appeared in search results, helping to determine clickthrough rate. Clickthrough rate is the percentage of people who saw a search result and then clicked it. It helps to demonstrate how well a page’s title and description communicate to a user searching for a relevant query and whether they’re compelling enough to get the click.
Use the Top Pages widget and select your Search Console account to include this list in your report. Note that any data from Search Console will only include a date range of up to the previous 90 days. However, if you have been maintaining a record, you can use the notes widget to provide insight on quarterly changes.
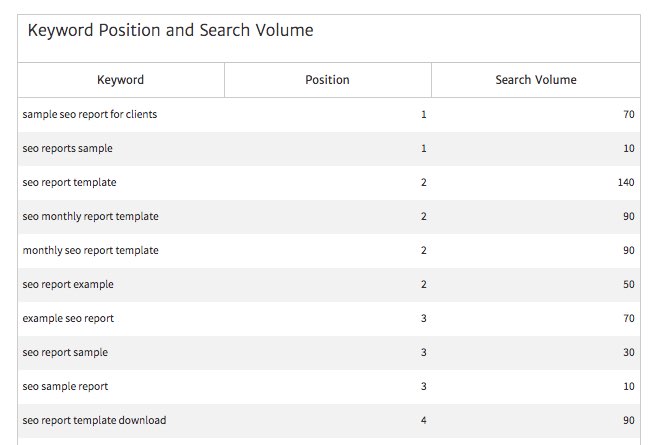
Including External Data
Perhaps you want to show data that’s not already in Google Analytics or Search Console. Ultimately, what sets your SEO reports apart is the amount of custom data you include that can provide the client with the best possible picture of actions and performance.
For instance, you may be tracking keyword ranking data in a platform such as SEMrush. You can easily export a spreadsheet of keywords, comb through the list to include the ones most relevant to a client’s business, and upload the resulting file into a CSV widget. A simple CSV import from SEMrush for keyword position and search volume looks like this.
For more details, see our article on spreadsheet integration with Megalytic
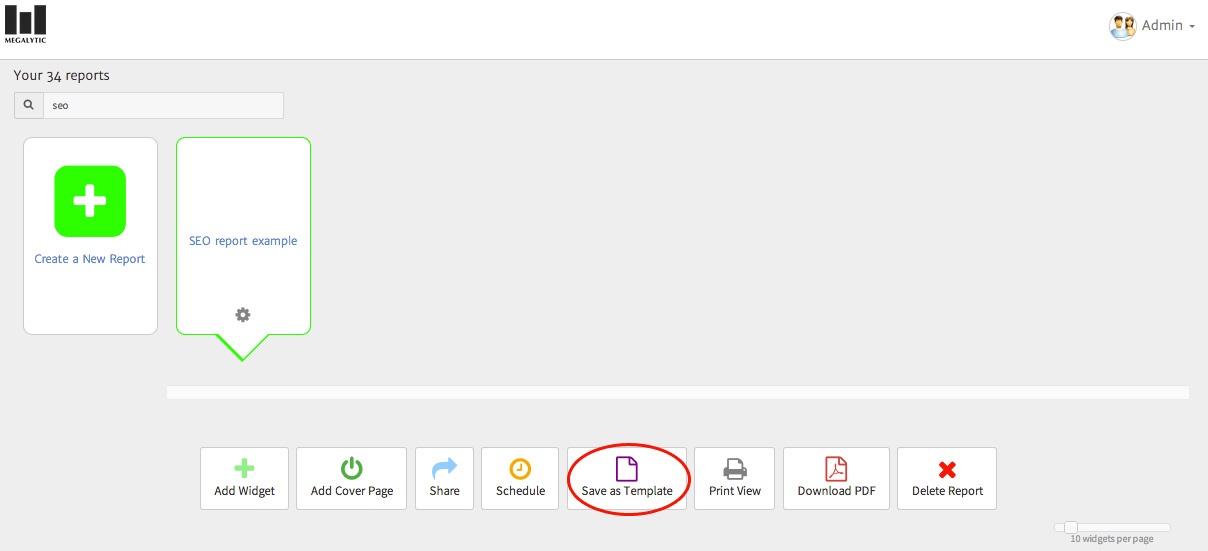
Finalizing Your Template
Once you’ve added all the widgets you’d like to include, taking into account showing stats for both a big picture perspective and granular details where necessary, save your template for future use. To do this, simply click the “Save as Template” button right above your report in Megalytic.
Give your report a name, a description (optional), save it, and you’re ready to access it whenever you build your next SEO report.
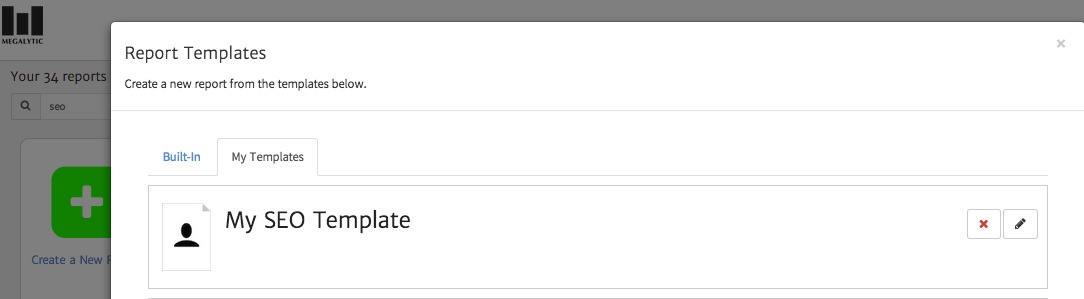
To use an existing template, create a new report, and select the My Templates tab. You’ll then see a list of your custom-built templates where you can choose the one you wish to use. Once you’ve created a report with a template, you can modify the widgets to reflect your desired date range and also include notes about the current stats.
Conclusion
Building a template for an agency SEO report will provide you with a starting point to show results from organic search. You should not rely solely on the same template for every client, but save time by creating a template with stats that you know you will need. Use this strategy moving forward to customize the report to communicate the most important information to each individual client.