
Previously we discussed how to create your report templates, but this post will help you get familiar with updating them with new content. These templates hand the grunt work over to Megalytic, while leaving you the flexibility to modify your analytics each month to adjust to new campaigns and other changing business circumstances.
Megalytic Templates let you automate the portions of the report that repeat from month-to-month, while retaining the flexibility to update the campaign statistics to reflect the new campaigns that roll out.
Megalytic Templates
To ease the hassle of monthly reporting, Megalytic lets you create a report once, and then save it as a template. Once saved, you can recreate that report and modify as required to meet the changing needs of the business.
Here’s how you do it.
Step 0 – Create the September Report in Megalytic
While we aren’t covering the process of creating the report in the first place, it’s not that hard and you can see how it is done here: Getting Started with Megalytic and Creating a New Report.
Any report you’ve previously created can be saved and used as a new template.
Step 1 – Save the September Report as a Template
First, select a report you have created in Megalytic. In this case, we have chosen the Digital Marketing Report – September. Next, click on “Save as Template.”
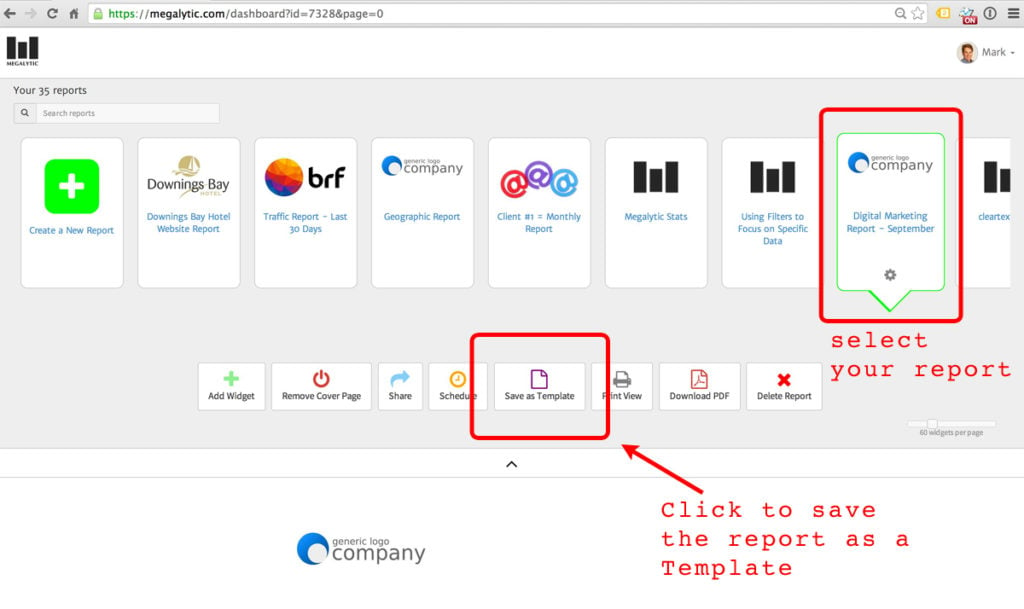
Follow the prompts, and give the template the name “Digital Marketing Report – Monthly.”
Step 2 – Use the Template to Create October’s Report
It’s a new month and it’s time to create your October report. Why start from scratch?
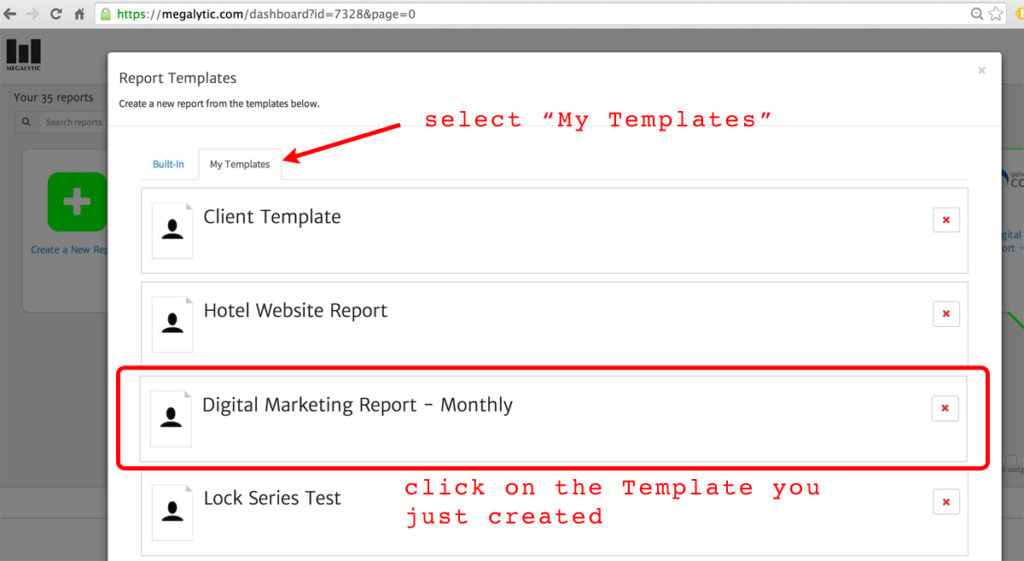
To create the October report, start by clicking “Create a New Report” on the left side of the Megalytic dashboard. When the template picker opens, click on the tab labeled “My Templates” and select the template you just created – “Digital Marketing Report – Monthly.”
Upon clicking this, Megalytic will automatically build a new October report from the existing template. You will want to update your cover page (in this example, updating the cover to say “October”, rather than “September”) and change the text as desired. Usually, people use the cover page to give a short introduction to the contents of the report. Think of it like an executive summary.
Step 3 – Update the Date Ranges of the Widget
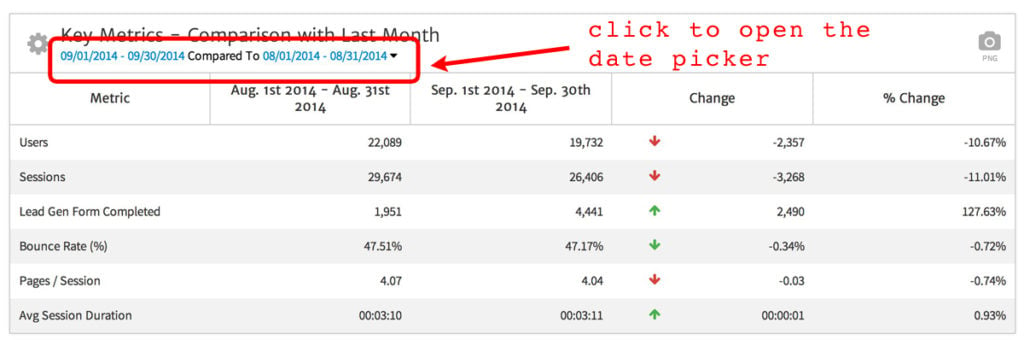
To update the date ranges in this October report, start with the first widget – “Key Metrics – Comparison with Last Month,” and click on the date range to open the date picker.
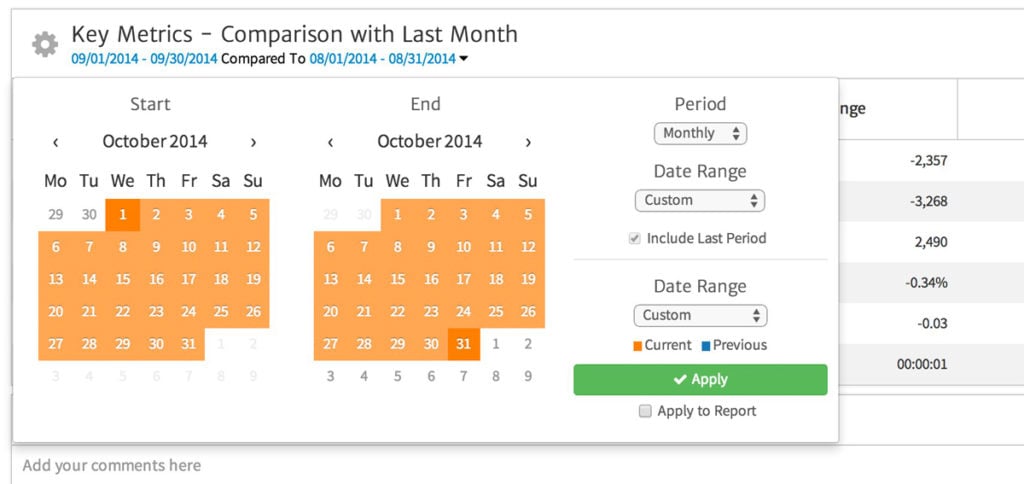
Select October as the current period and September as the previous period. Click “Apply.”
Now, go through the other five widgets in this report and update the date ranges similarly.
Important Note: It is also possible to set date ranges to update automatically each month using Rolling Date Ranges.
Step 4 – Select New Campaigns for the Last Three Widgets
Let’s pretend we have a sports client and in the September report, we highlighted three campaigns:
- Football Team Sales Event
- Fall Sales
- Act Now Email
For October, we want to change the campaigns highlighted in these widgets. To do that, we make use of Megalytic Filters.
Suppose that the first October campaign we want to highlight is “BlowoutSale.” We will convert the widget that currently displays “Football Team Sales Event” to show the “BlowoutSale” campaign instead.
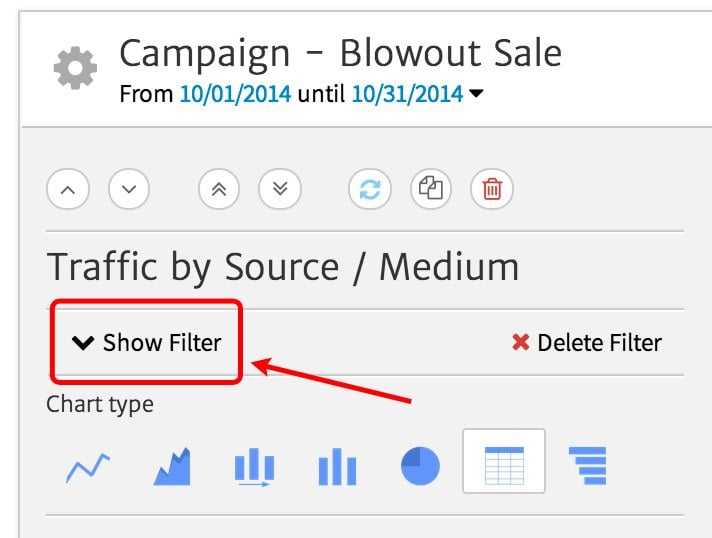
First, we change the title of this widget to “Campaign – Blowout Sale”. Then, we open the widget editor and click on “Show Filter” to open the filter that selects the campaign.
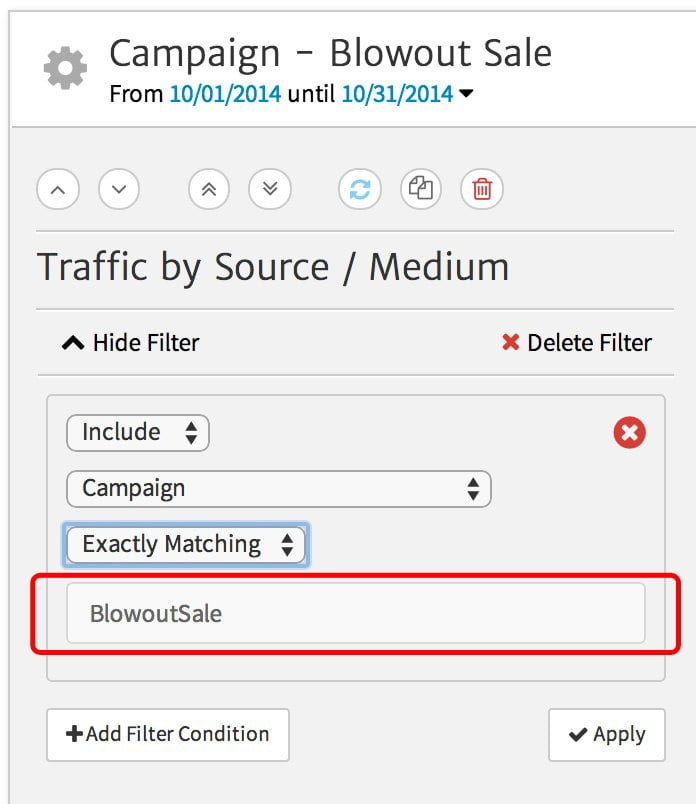
Next, enter the campaign code “BlowoutSale” in the filter and click “Apply.” The widget will now show the data for the new campaign.
To finish up, we update the other two Campaign widgets to show the details for the specific campaigns we want to highlight for October.
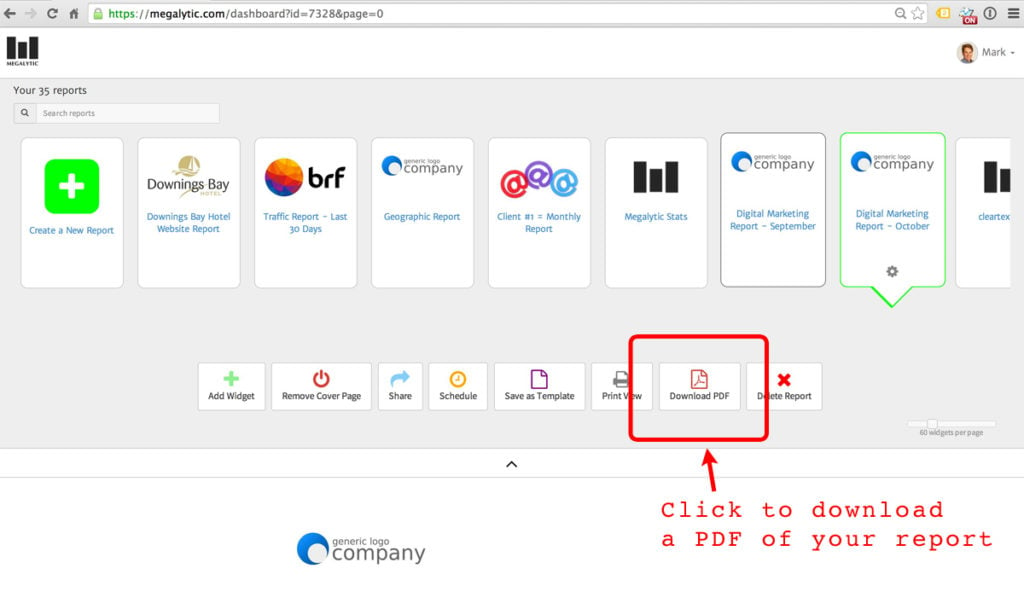
Lastly, we update the comments to highlight the insights we have gleaned from this month’s data. That’s it. The report can now be downloaded as a PDF: Digital Marketing Report – October.
If you need additional help, feel free to get in touch with customer support!