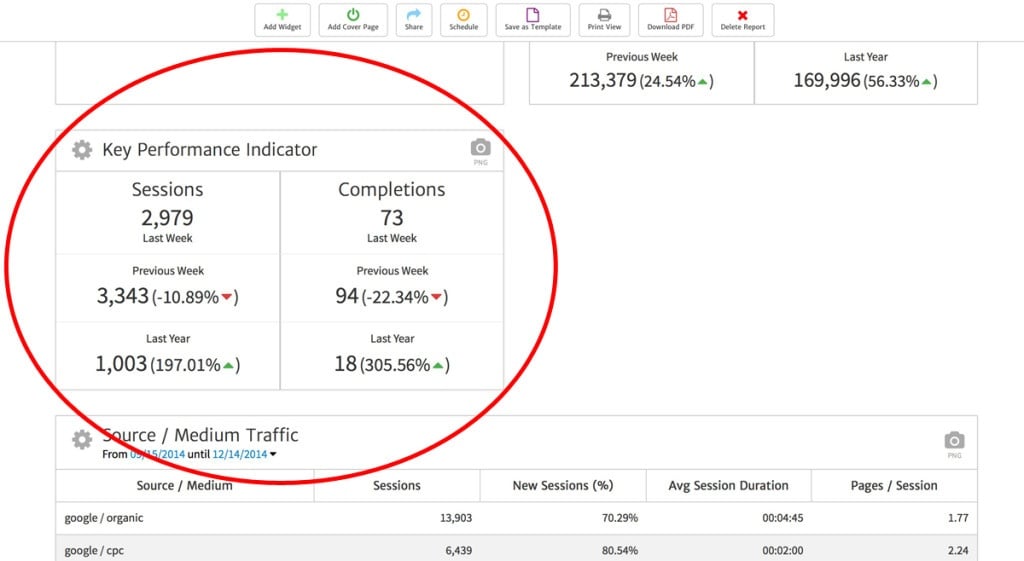
Megalytic’s KPI widgets enable you to include small size indicators that provide at-a-glance reporting on the performance of key metrics.
Grouped together in the “KPI” section of the widget library, you can find them easily by typing “kpi” in the search bar.
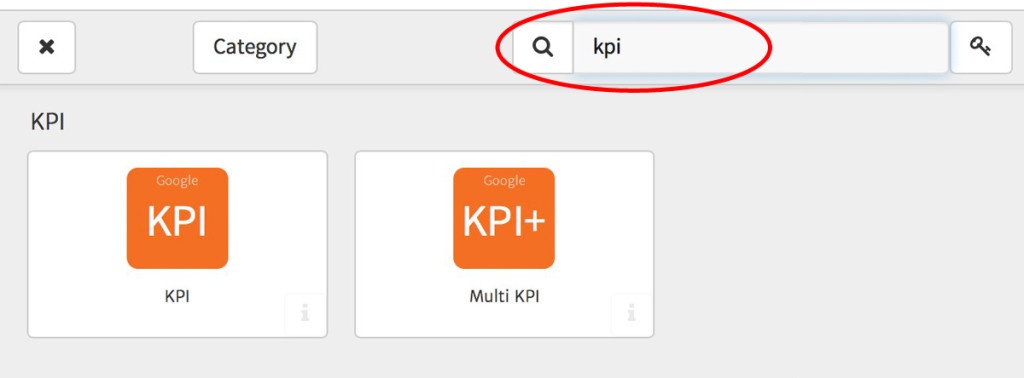
To add one of these widgets to your reports, simply drag it onto your report canvas as shown below.


KPI
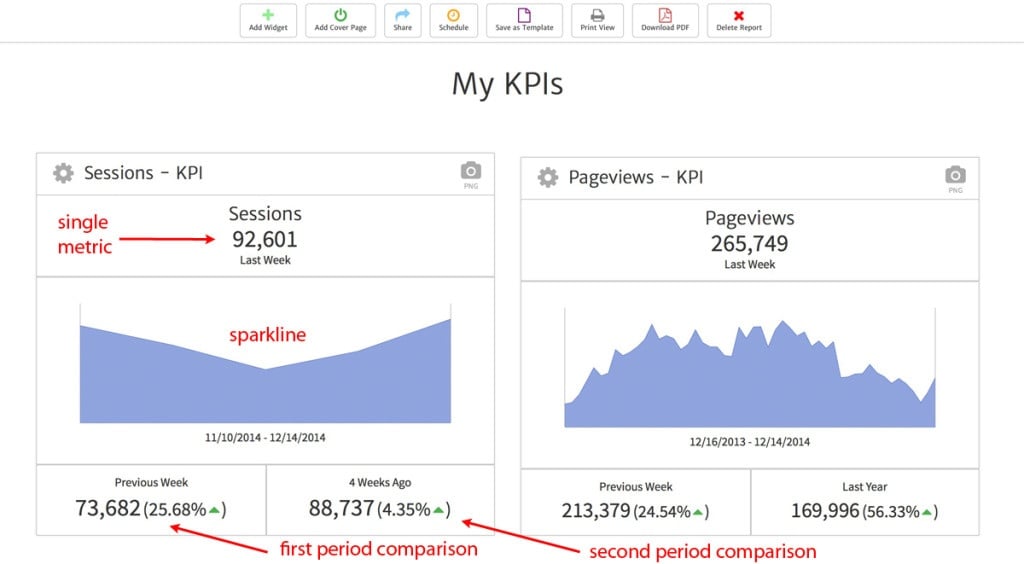
By default, the widget named “KPI” creates a half-row sized indicator with a single metric, a sparkline, and two comparison periods. Below, is an example of two KPI widgets placed side-by-side in a report. The components on the left side widget are labeled with red text.
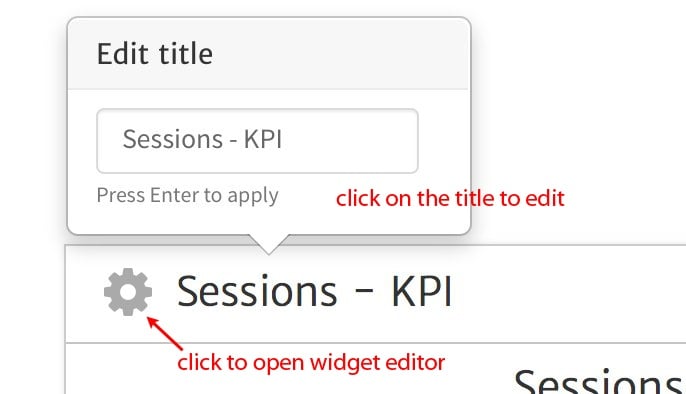
To edit the title, simply click on it, and the “Edit title” modal will open and you can change the title of the widget. To change the metric, date periods, or other features, click on the gear icon to open the widget editor.
Inside the widget editor, click on “Change Date” to select the period: Daily, Weekly, Monthly, Quarterly, or Yearly.
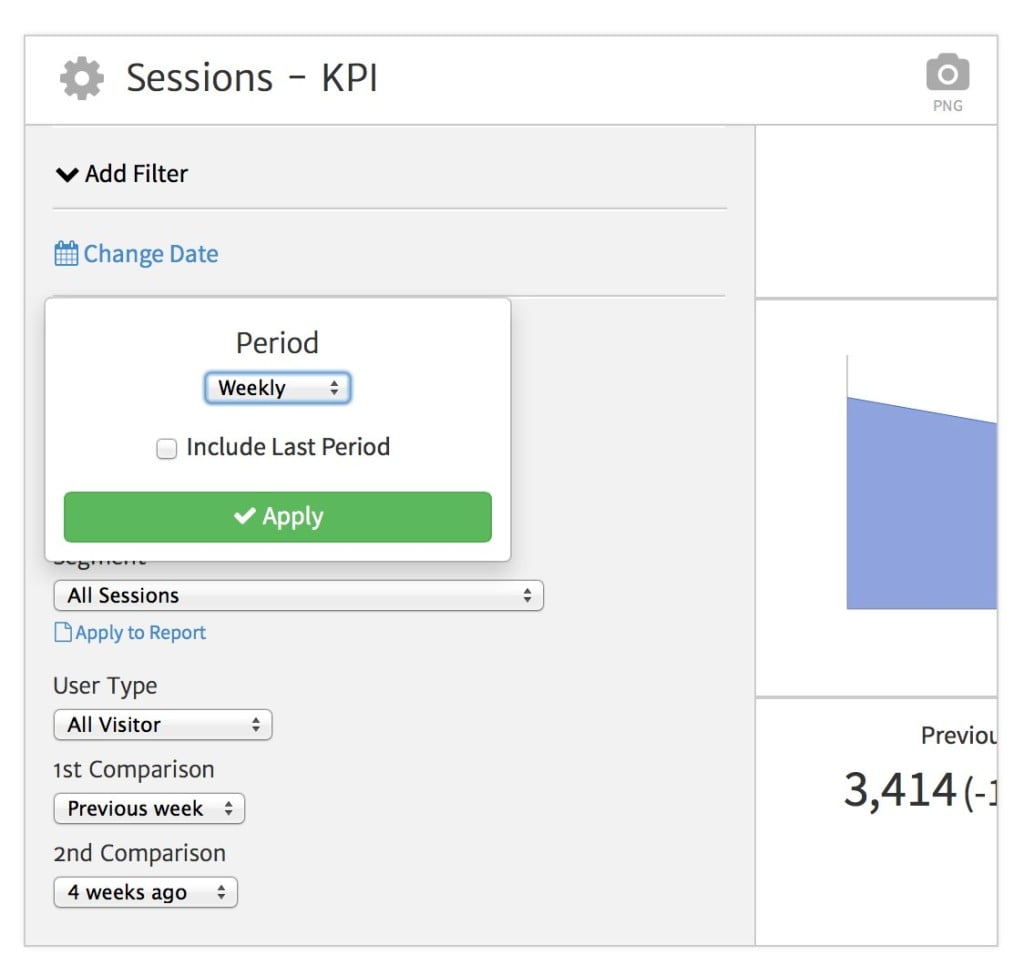
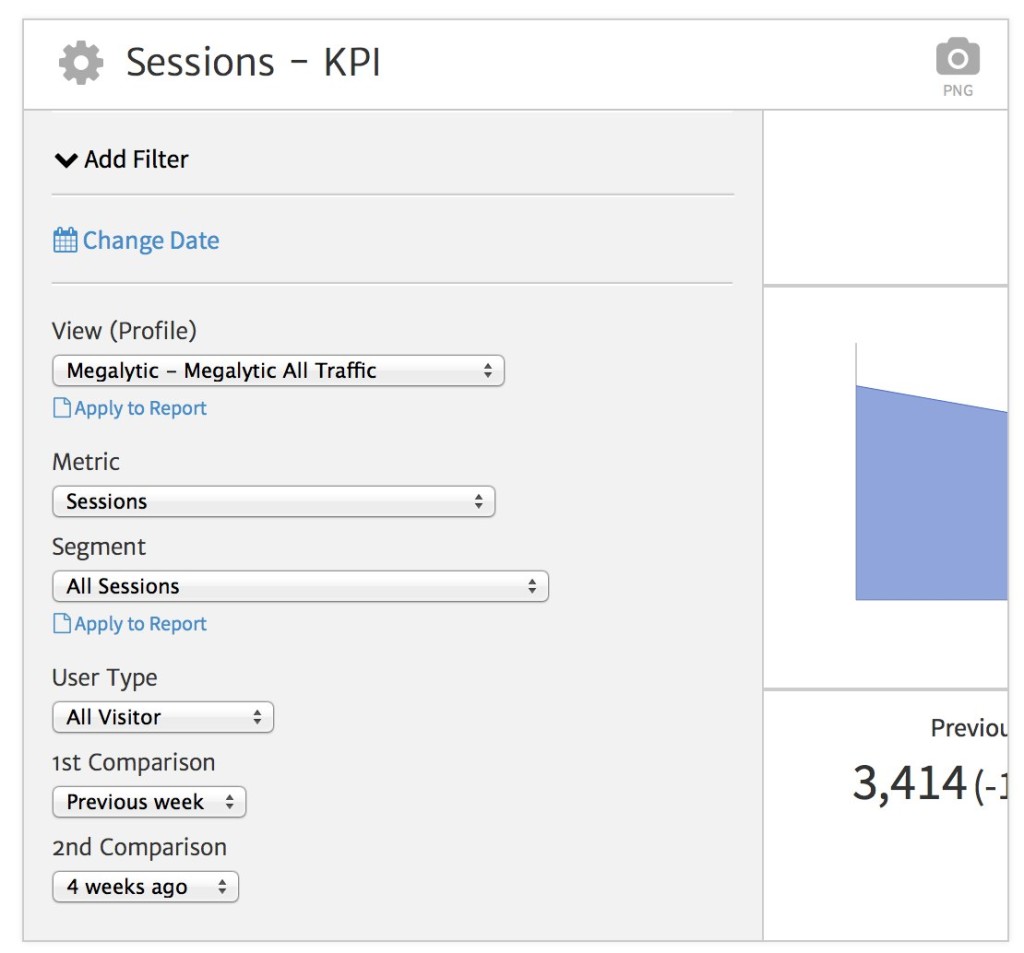
In addition, the KPI widget editor has controls for changing the View, Metric, Segment, User Type, and the 1st and 2nd Comparison Periods.
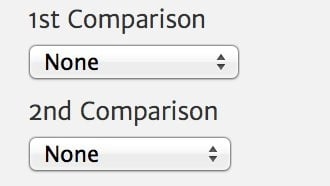
One or both of the Comparison Periods can be set to “none” – in which case the widget will have one or zero comparison dates shown.

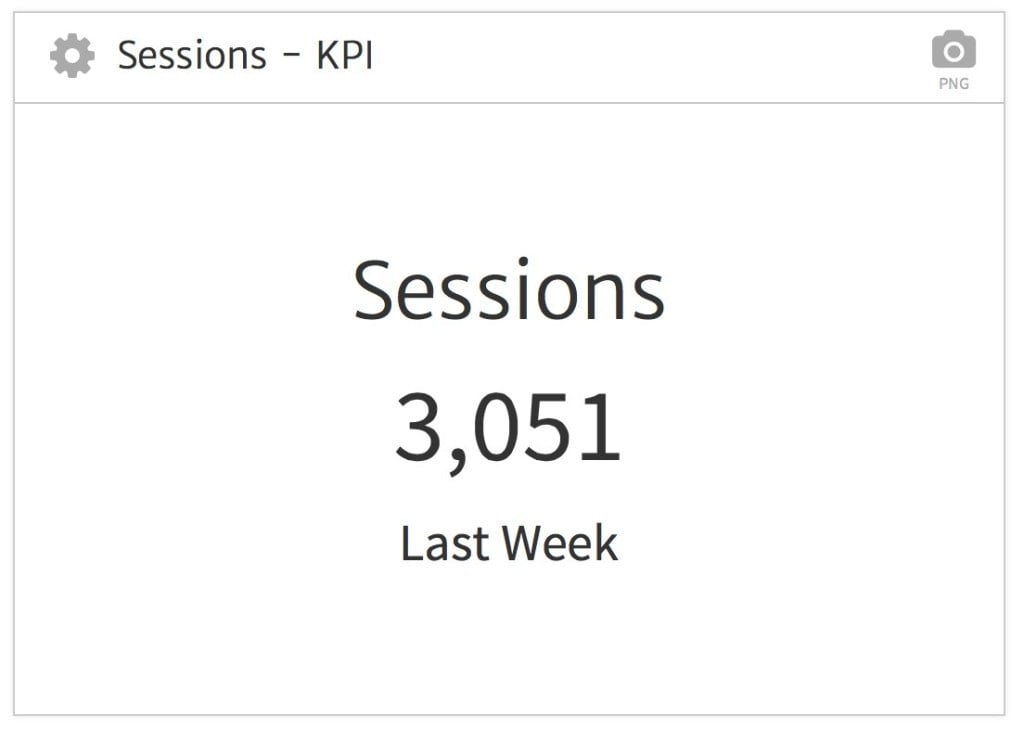
Here is what the KPI Widget looks like without any period comparisons. Notice that the sparkline disappears. In order to have the sparkline, you need at least one period comparison.

Multi KPI
The Multi KPI widget lets you display 1-4 KPIs across a row. By default, when you drag a Multi KPI widget in to a report, you get four KPIs.
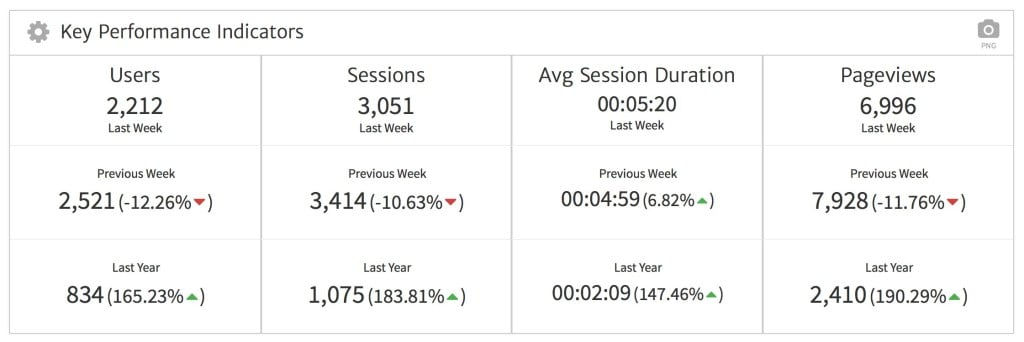
Within the Multi KPI widget editor, you can select 1 – 4 metrics to be displayed using the Metric selector near the bottom. Note that some metrics provide further editing options. In the example below, we have selected Sessions and Completions as the metrics. As you can see, the Completions metric has an additional option to select the Goal – which we have set to show “New Account – Trial”.
The widget editor also let’s you select one or two comparison periods – which can be set to none if you do not want to show any comparisons.
Here’s what the Multi KPI looks like with 2 metrics selected, and 2 comparison periods – last week, and the year ago week. Notice that with only 2 metrics selected, the widget takes up half a row. With 3 or 4 selected, it will take up a full row.
