
A common reporting scenario requires the need create a table of stats over the last 6 (or 12) months. Megalytic’s “Metric Table by Period” widget is designed for this purpose.
You can use it to show stats over periods of any length (day, week, month, quarter, year), going back as far as you like.
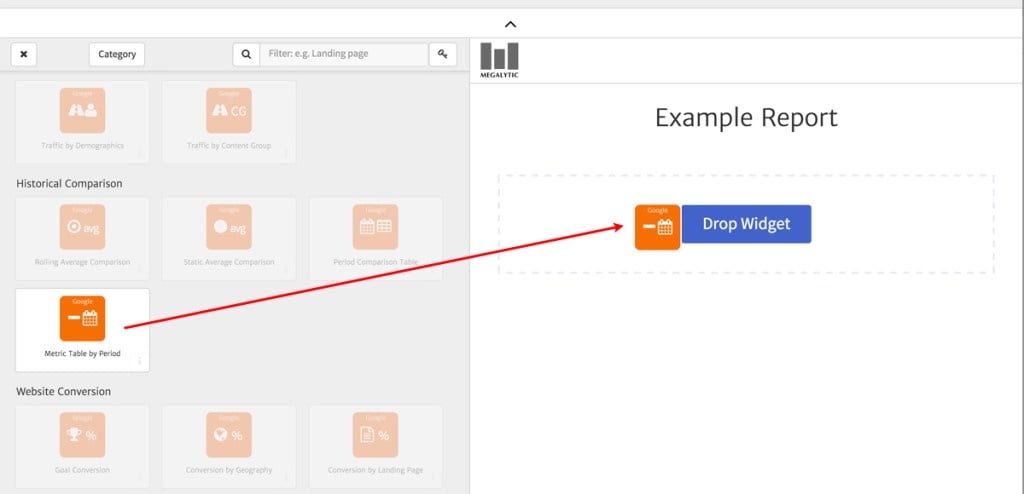
To get started, drag the “Metric Table by Period” widget on to your report and select the connection you want to use with the widget.
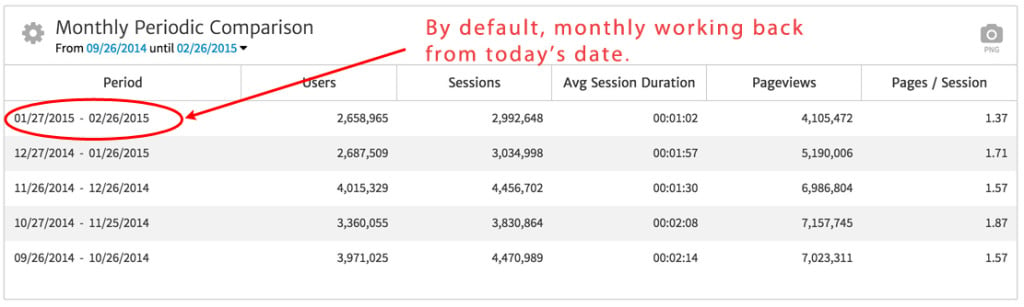
By default, you get a table showing 5 monthly periods, working back from today’s date, with 5 default metrics: Users, Sessions, Avg Session Duration, Pageviews, and Pages / Session. You can change all of these defaults.
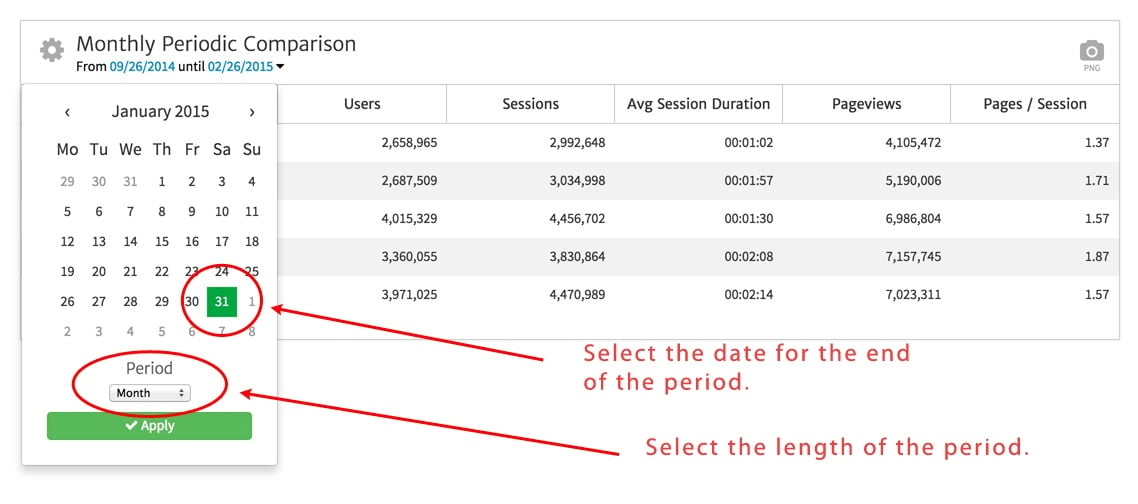
If you want to change the ending date of the periods, or the length of the periods, you can do that from the Date Picker as shown below.
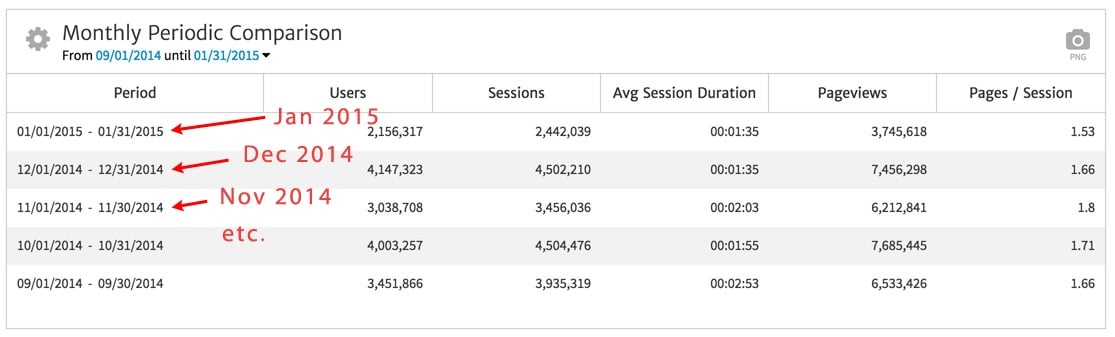
Making these selections causes the table to show monthly data, working back from January.
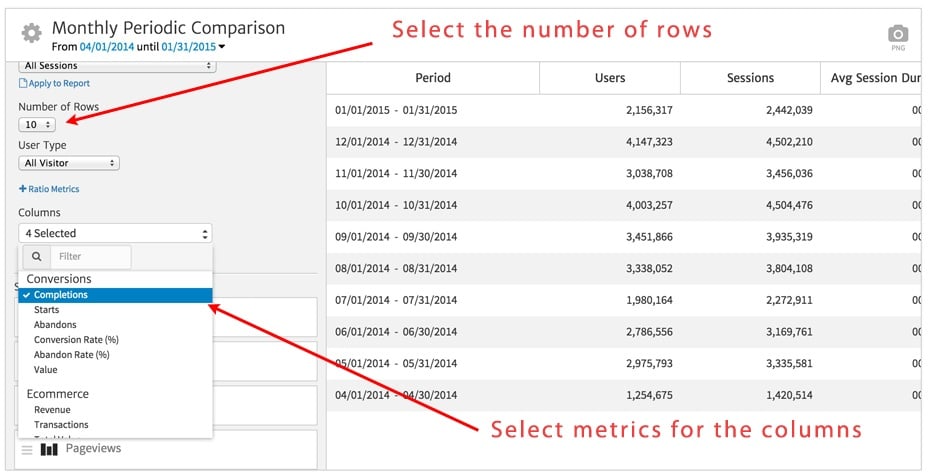
In addition, you can increase (or decrease) the number of rows (periods), and change the metrics that are displayed. To do that, click on the gear symbol in the upper left to open the widget editor. Use the “Number of Rows” selector to pick the number of periods you want to show. Use the “Columns” selector to change the metrics in the columns.
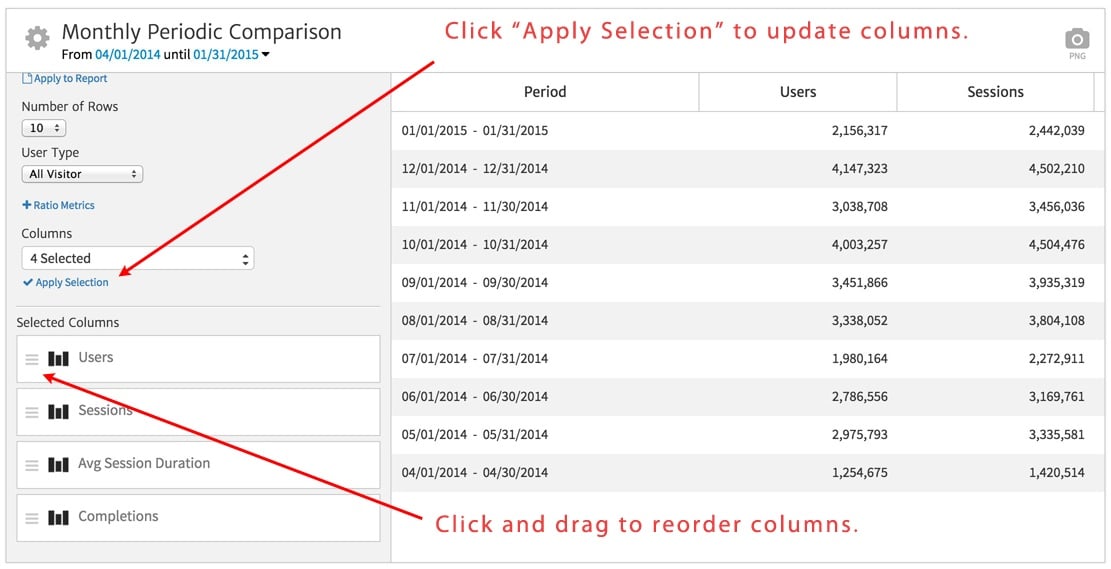
Once you have made your Column selections, click on “Apply Selection” to update the columns with your new metrics. After that, you can click and drag the Selected Columns to reorder them.
As you can see below, the table now shows 10 rows (months) and the Completions metric has been dragged to the first column.
.jpg)