
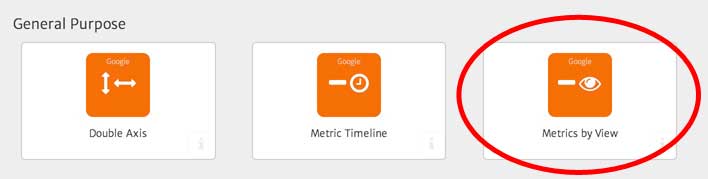
Megalytic’s “Metrics by View” widget enables you to combine data from multiple Google Analytics accounts in a single chart or graph. The “Metrics by View” widget is found in the “General Purpose” section of the Widget Library.
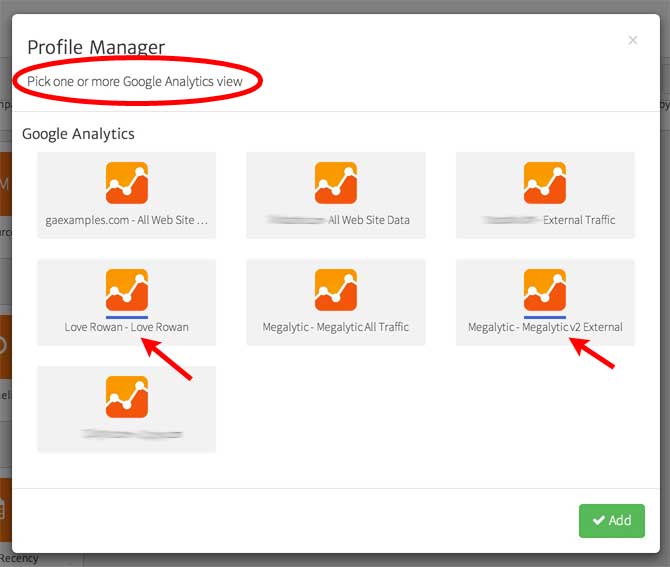
When you select this widget, you will be prompted to select one or more Google Analytics accounts. For example, to compare sessions from 2 websites, start by selecting their Google Analytics accounts.
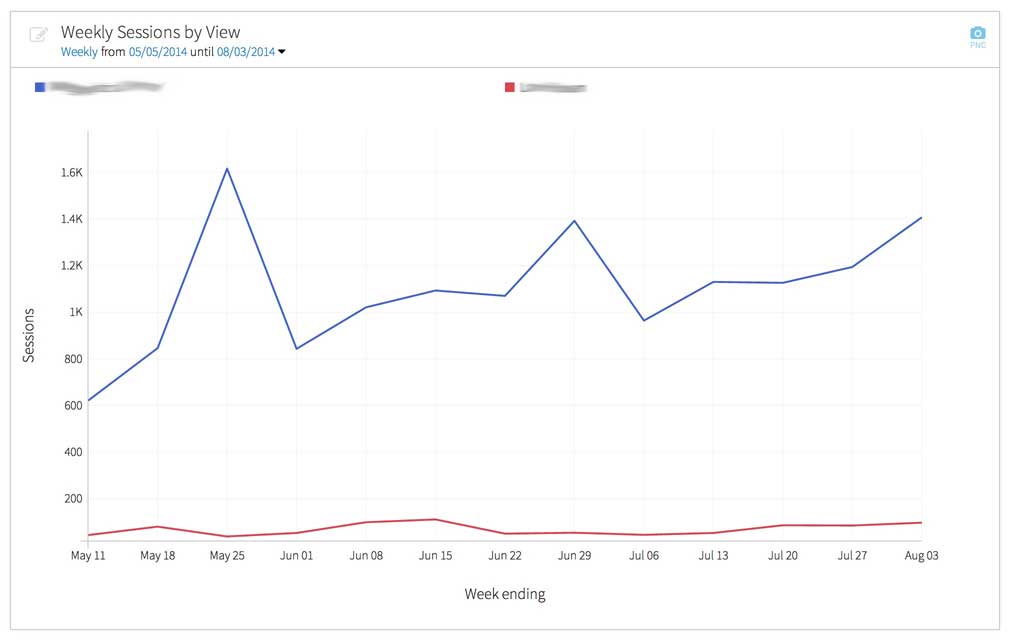
By default, Megalytic creates a chart comparing the sessions (visits) for these two websites in a line chart.

You can add the aggregate (sum) of the traffic from these two websites by opening the widget editor and selecting the “Aggregate Data” box. This will add a “Total” line to the chart as shown below.
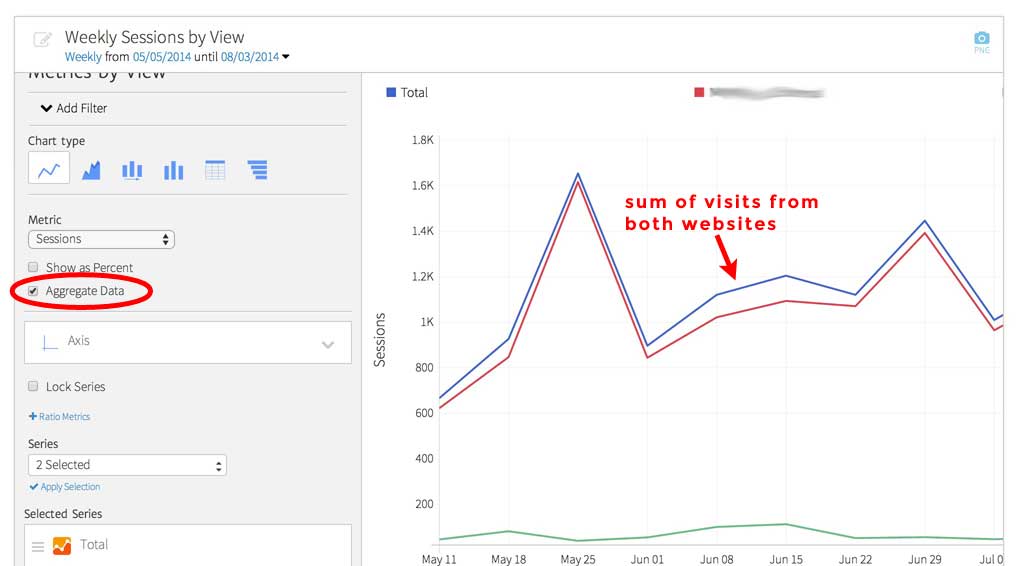
You can change the style of this chart or show the data in table format. You can also change the metric that is displayed.