Watch the video tutorial: Changing the Data Displayed in a Widget (Dimensions and Metrics)
When you create a report from a template, or add a widget to a report, the default metric(s) get displayed. You can easily change the metric(s). For example, you may want to display “Unique Visitors” instead of “Total Visits”.
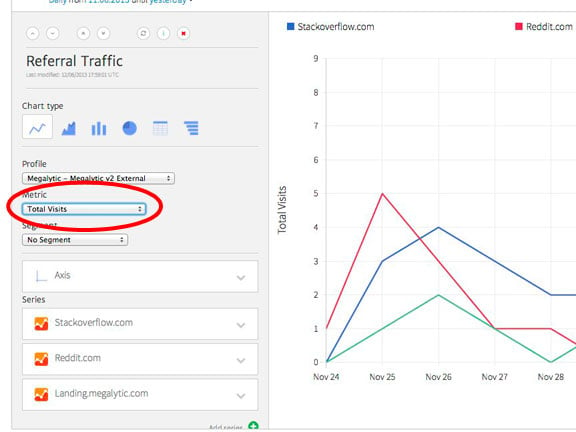
Open the widget editor, and look for the control labeled “Metric”. For example, if you are looking at a line chart, then you can pick the metric as shown below.
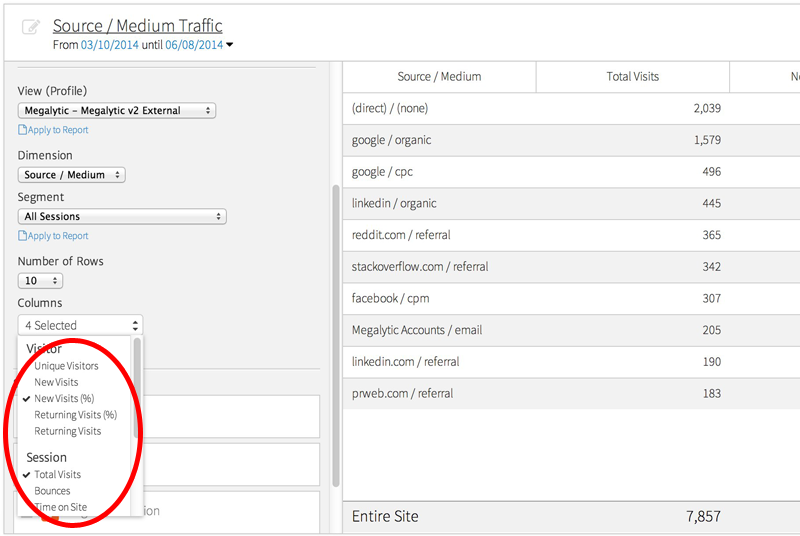
If you are looking at a table, then the metrics displayed in each column can be adjusted within the widget editor. Look in the “Columns” section and click on the drop-down box to choose the metrics to display. When you are done selecting, click outside the menu to close it.
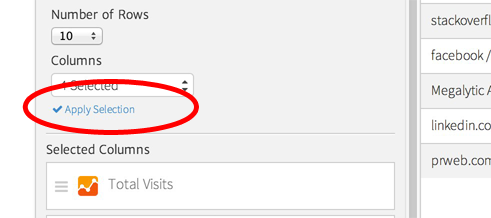
Lastly, click on “Apply selection” to complete the change.