
May 21, 2024
What Can Google Analytics Track? 4 Surprising Customizations
By Megalytic Staff - November 03, 2016
Performance by Market Region
Many businesses that serve wide geographic areas divide their target locations into market regions. However, these regions may not strictly correlate with the default geographic divisions within Analytics: country, region (state), metro area, and city. For instance, a market region may encompass multiple states.
To view data for custom regions, you can create Google Analytics Segments that can apply across the interface. To begin creating a segment, click “Add Segment” above the graph in the main reporting interface. Next, choose New Segment.
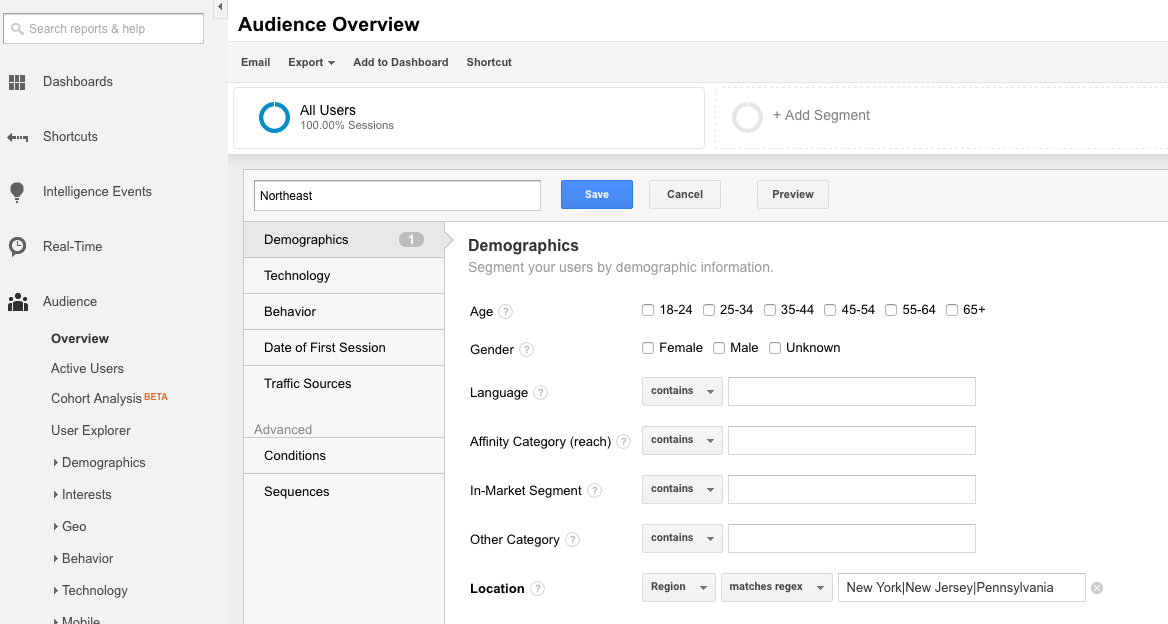
Use the Location field to define your target areas. In this example, we want to define a Northeast region that includes New York, New Jersey, and Pennsylvania. Choose region and the matches regex option. Next, insert the state names separated by the | symbol. In a regular expression, this tells Google Analytics to show any traffic from New York OR New Jersey OR Pennsylvania.
Save the segment, and you can now apply it to reports to see traffic from the Northeast market region. Repeat the process for different regions.
Traffic by Hour
Looking at traffic by hour will allow you to see what times have high or low volume visits. This insight may inform content decisions like when to publish blog posts or schedule ads to run. You won’t find a report in the default interface that allows you to break down total traffic by hour or day. However, you can view this data by creating a custom report.
Within your desired Analytics view, go to Customization in the top navigation bar. Select New Custom Report .
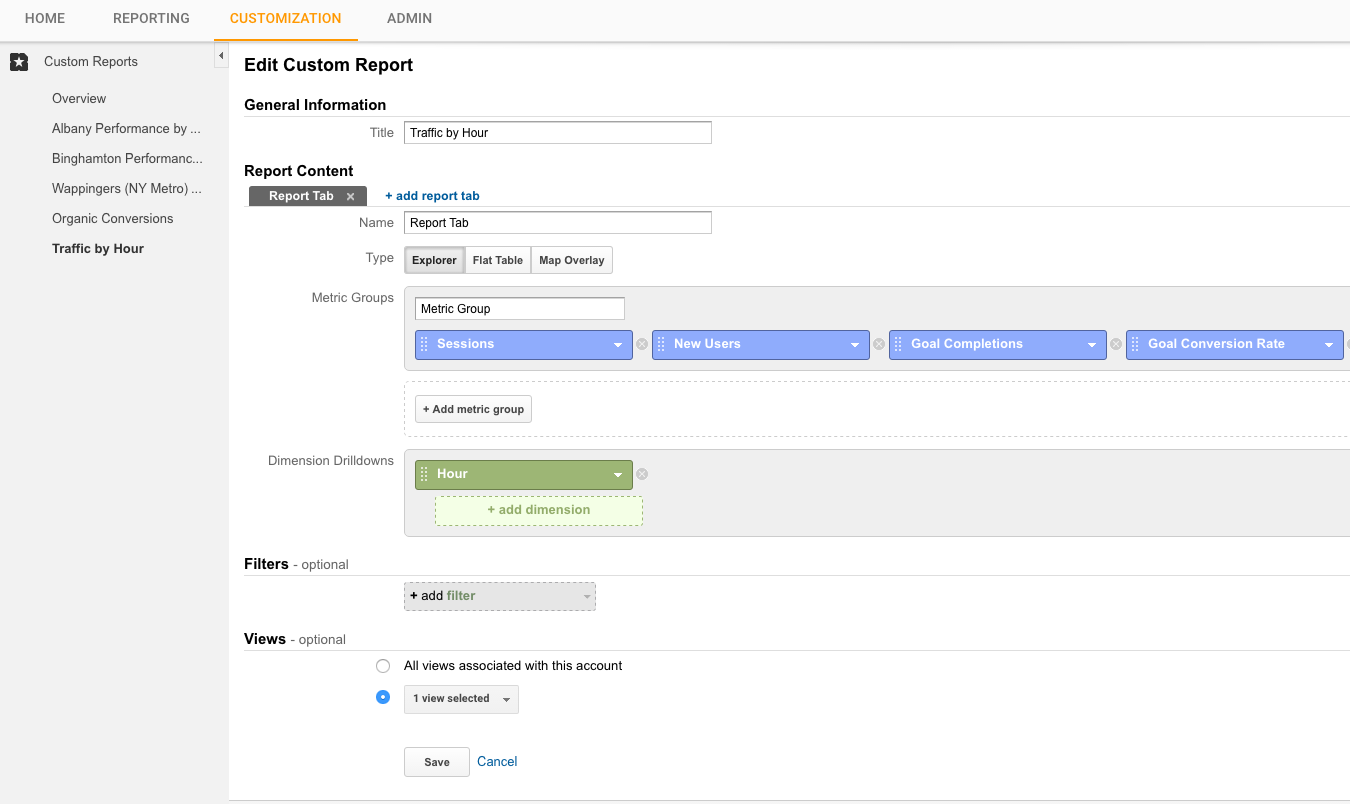
In the Metric Groups section, choose the metrics you’d like to show. In this case, we’ve picked Sessions, New Users, Goal Completions, and Goal Conversion Rate to show total traffic, unique users, and conversion performance. Next, in the Dimensions drilldown, choose Hour. Then, save the report to see the final product.
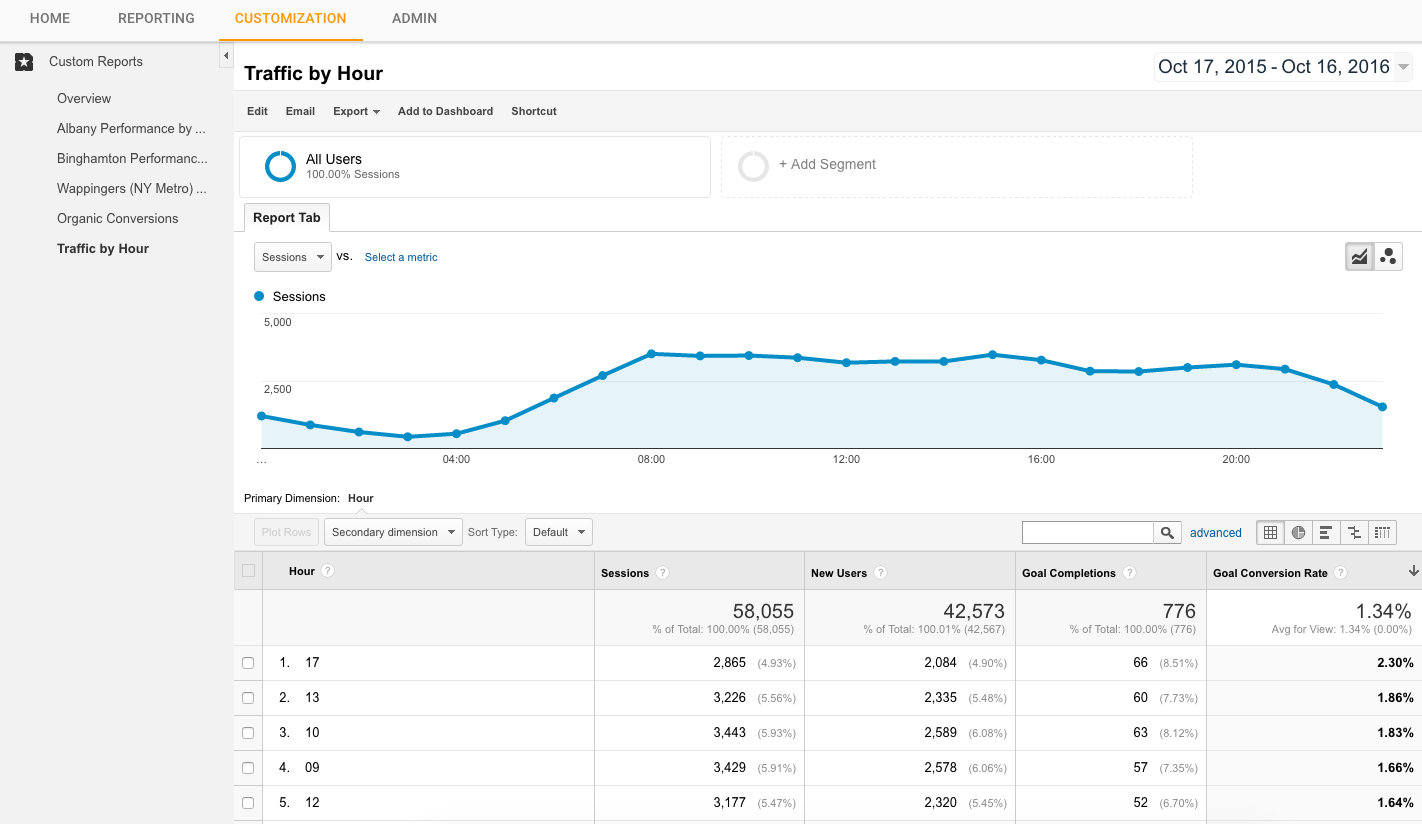
Now, you can see a report breaking down performance by hour over the timeframe you’ve selected. In this case, we’ve chosen to look back over a period of a year. The graph offers a helpful window into when traffic volume starts to dip (after 9 p.m.) and when it picks up (after 6 a.m.). Sorting by conversion rate allows you to see when people are most likely to contact you. In this case, it’s around 5 p.m. An insight like this might support a case for a 9:30 a.m. to 5:30 p.m. or 10:00 a.m. to 6:00 p.m. work day to ensure someone is available to respond during that time frame.
Use this link to quickly create this report in your Analytics account.
Generic vs. Brand Paid Search
When tracking the performance of paid search, separating the performance of brand terms from non-brand will allow you to better analyze results. It’s useful to analyze data from people who are already familiar with your brand differently from those who are conducting searches that are not related to your brand name. While Google Analytics by default lumps all paid search visits into the “Paid Search” channel, it offers a fairly simple way to create brand and non-brand channels.
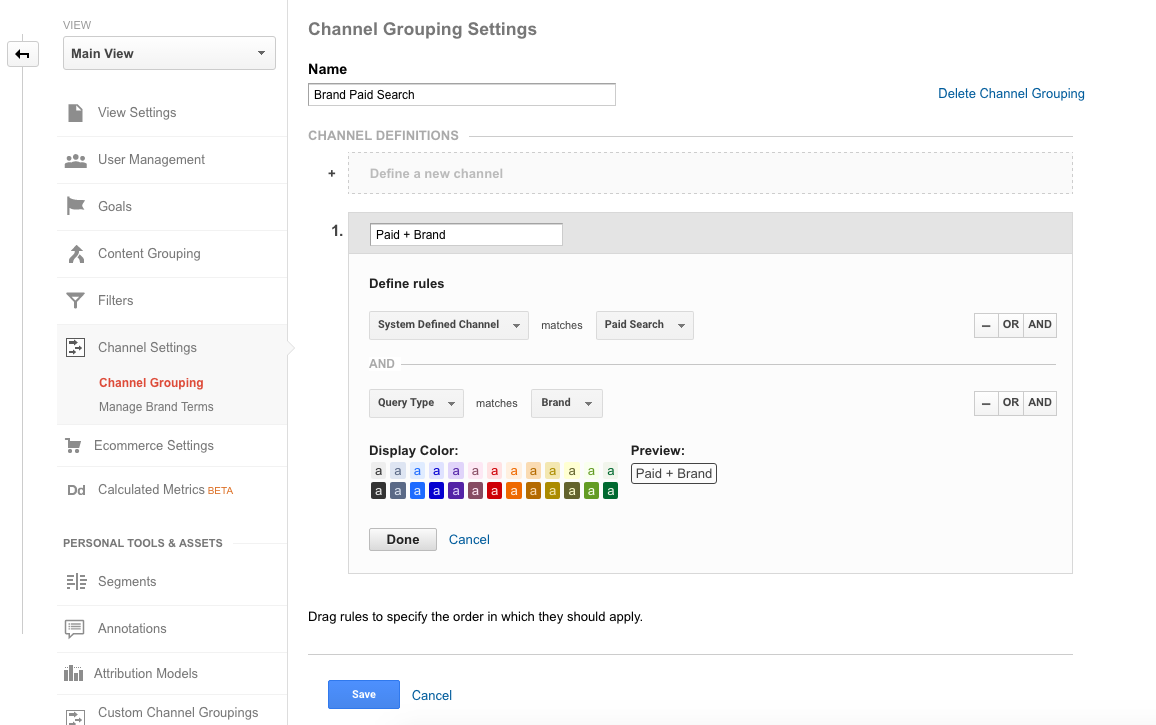
First, define your brand terms by going to the Admin screen, choosing your desired View, and selecting Channel Settings > Manage Brand terms. In the window that appears, type in all variations of your brand name (including common misspellings). Note that Google will tag as “brand” any queries that contain the terms you enter.
Next, go to Channel Grouping, also under Channel Settings. Create a New Channel Grouping and name it Brand Paid Search. Configure the rule section so System Defined Channel matches Paid Search AND Query Type matches Brand . Then, save your setup.
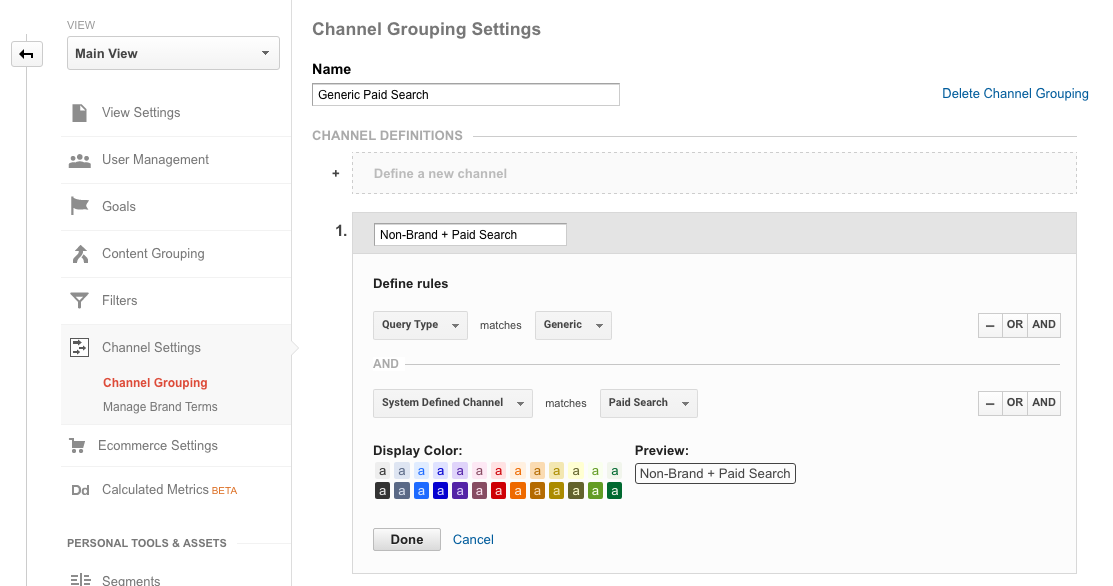
Now, create your Generic Channel Grouping. Start a new Channel Grouping and configure the rule section so Query Type matches Generic AND System Defined Channel matches Paid Search . Save this. Moving forward, you’ll see any future paid search data categorized in either Brand or Generic buckets.
With the visits form these two groups separated you can review behavior patterns and engagement factors like time on site and pages per visit as they apply to those who sought out your brand vs those who came upon it thorough a non-branded search term. This can help identify how well you are capturing the interest of visitors previously unfamiliar with your brand.
Calculated Metrics
If the default metrics within Google Analytics aren’t enough, you can create custom ones using the Calculated Metrics feature. For instance, normally Conversion Rate is calculated based on Sessions. However, you may want to get a picture of how well conversions are happening for New Users specifically.
To create this, go to Calculated Metrics under your desired Analytics View and choose the New Calculated Metric option. Give your Metric a clear name, as well as a unique identifier that can be used in the API (always fill this in with a unique name even if you don’t plan to use the feature).
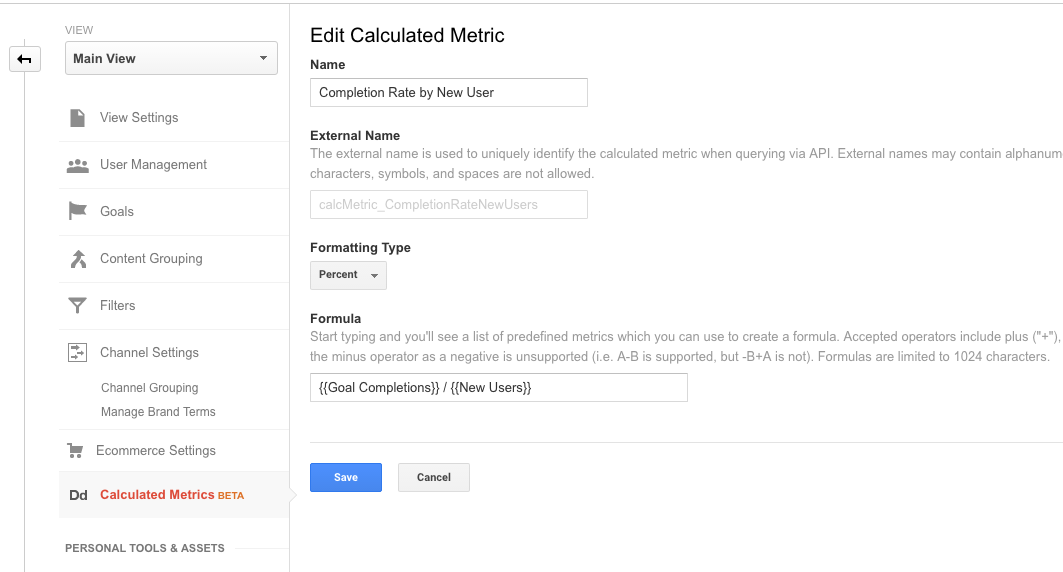
Next, choose the number format for your metric; in this case, we want to show a percentage. Finally, use the Formula field to populate how your Metric will be calculated. Start typing to include built-in Analytics metrics, using the indicated symbols for math operations. In this case, we want to divide Goal Completions by New Users.
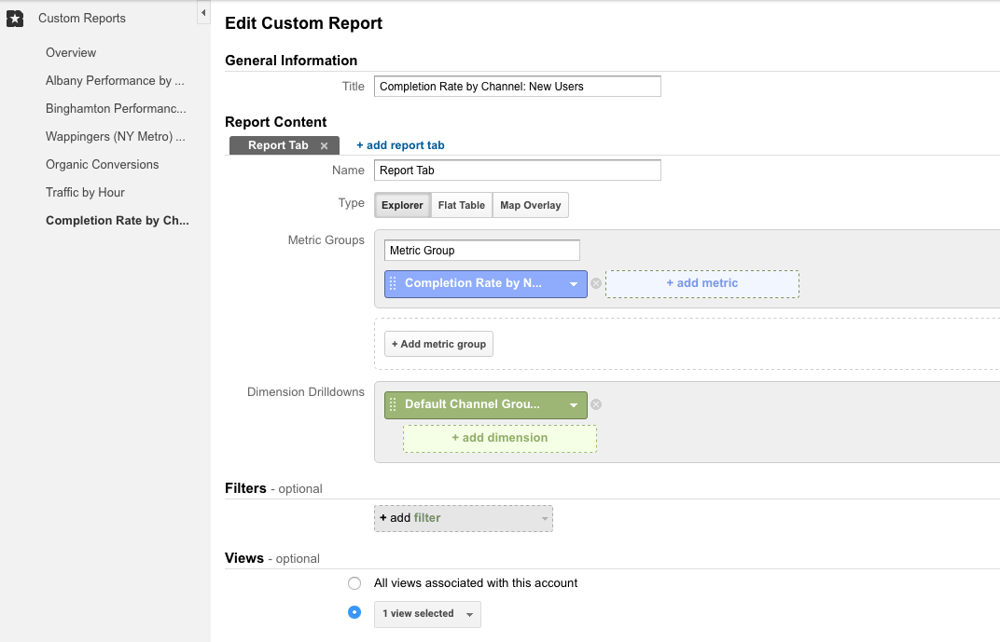
Now, you can use this Metric in Custom Reports, Custom Dashboards, Widgets and Unsampled Reports within the Google Analytics interface. We’ll create a Custom Report to showcase the feature, showing conversion rate by channel.
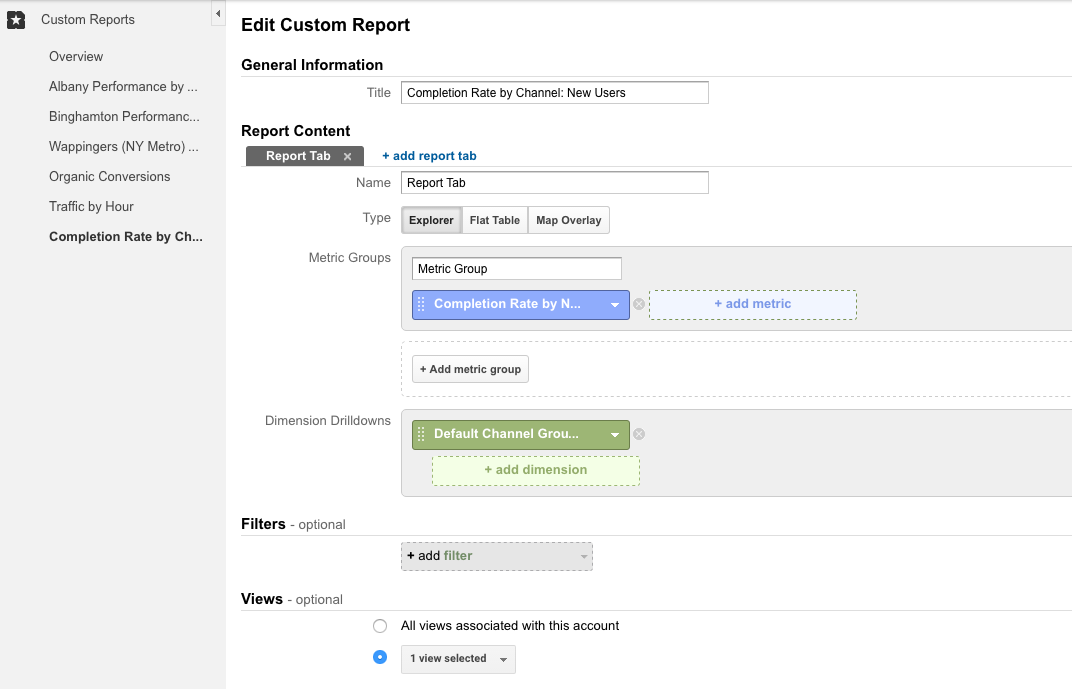
Back in the Custom Report interface, as we used for the Traffic by Hour setup, we’ll start a new report. Choose the brand-new Completion Rate by New Users as the Metric and Default Channel Grouping as the Dimension. Now, save this to see the final report.

Here, we can see a breakdown of our new metric by channels. We also see data from the Brand and Generic Paid Search channels created in the previous section. Interestingly, referrals show the highest conversion performance, slightly above organic search. Also, generic paid search terms actually convert better for new users coming to the site than brand search terms.
Conclusion
We’ve given you a few tips to analyze data on a level above what Google Analytics gives you by default. While each of these examples requires some tinkering in the backend, we hope you’ll spend some time diving deeper into the Analytics interface and customizing the data to better fit your own distinct business goals. If you’ve ever been curious about some specific data set and thought “I wonder if I can track that,” the answer is probably yes. That is, it is if you know how to customize your analytics. Let us know what customizations you’ve found useful and what challenges you encounter in trying to isolate the data you want.