
May 21, 2024
Using the Google Analytics Loyalty Widgets in Megalytic to Improve Website Performance
By Megalytic Staff - June 07, 2016

Finding the Google Analytics Loyalty Widgets
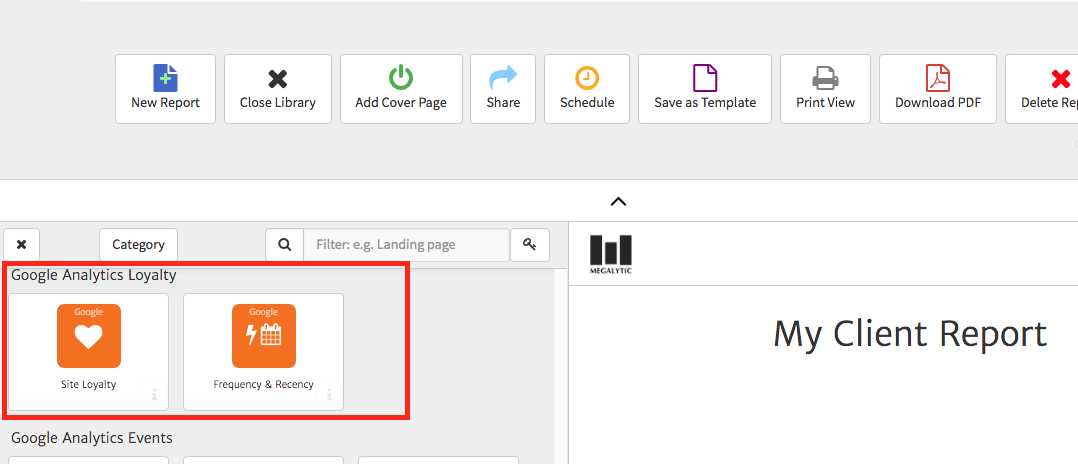
Once you’ve started a new report in Megalytic, locate the loyalty widgets by clicking Add Widget right above your report. Look for the Google Analytics Loyalty section, or use the search bar to go directly there. You’ll see two widgets: Site Loyalty and Frequency & Recency.
Site Loyalty Widget
First, let’s look at the Site Loyalty Widget. This allows you to measure traffic from frequent visitors based on thresholds you define.
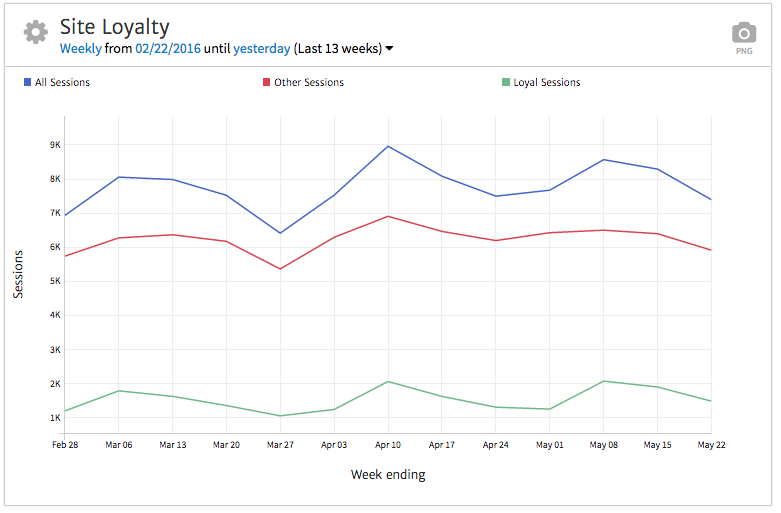
Drag the widget to your report and choose a Google Analytics view to get started. By default, you’ll see a line graph showing All Sessions, Other Sessions, and Loyal Sessions for the past 13 weeks. Knowing which one you want to use starts with understanding what each one shows.
- All Sessions covers exactly what you think: total visits to your site.
- Loyal Sessions includes visits by users who came to the site a minimum number of times within a time period that you define.
- Other Sessions include visits that don’t fit the criteria you’ve designated for Loyal Sessions.
To set up your criteria for loyal visitors, click the gear in the upper left to open the widget options. Use the dropdowns to set a minimum count of visits (lowest number of times a person came to the site that you want to count) and maximum days since the last visit, so you exclude people who haven’t come back to the site recently. You may want to track anyone who’s visited more than once in the last 4 months, or you may want to only track those who have visited several times in the last 30 days. The time frame you set largely depends on the actions you want users to take on your site.
Note that the Minimum Count of Visits dropdown lets you choose from 1-9, 15, 26, 51, 101, and 201. Maximum Days Since Last Visit lets you choose from 1-8, 15, 31, 61, and 121.
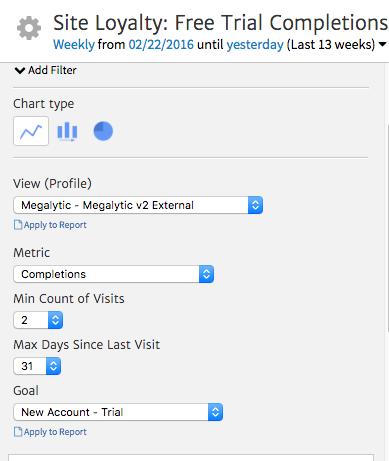
As one example of customizing this widget, let’s look at how site loyalty impacts the likelihood of users converting to free trial subscriptions. To set this up, we’ll change the Metric to Completions and set Minimum Count of Visits to 2. In addition, we’ll set Max Days Since Last Visit to 31, looking back a month to cover people who may have looked at a blog post and then come back. With this setup, we’ll compare people who made just one visit with those who returned to the site at least once.

In the resulting graph, we can see that more conversions result from Other Sessions (new visits or people who haven’t been tracked as coming to the site, at least within the last month) than Loyal Sessions. However, we do note a steady flow of signups from the loyal visitors.
Based on this data, we should continue to focus on driving conversions via initial touchpoints with the site (service pages and blog articles), as the data implies that people are more likely to convert upon first seeing the product. However, the reasonable volume of conversions from repeat visitors indicates we should be utilizing tactics like remarketing to garner more conversions from people previously exposed to the brand. For instance, targeting these people with blog posts on social platforms will help to keep the brand top of mind and could help to increase signups from the Loyal Sessions category.
Frequency & Recency Widget
Besides looking at volume of activity for loyal visitors, you should also analyze how often and at what intervals people are returning to the site. The Frequency & Recency widget allows you to review and display this data. Upon adding this widget and selecting a Google Analytics view, you’ll see a bar chart breaking down Sessions by frequency of visits, showing the number of times people return to the site.
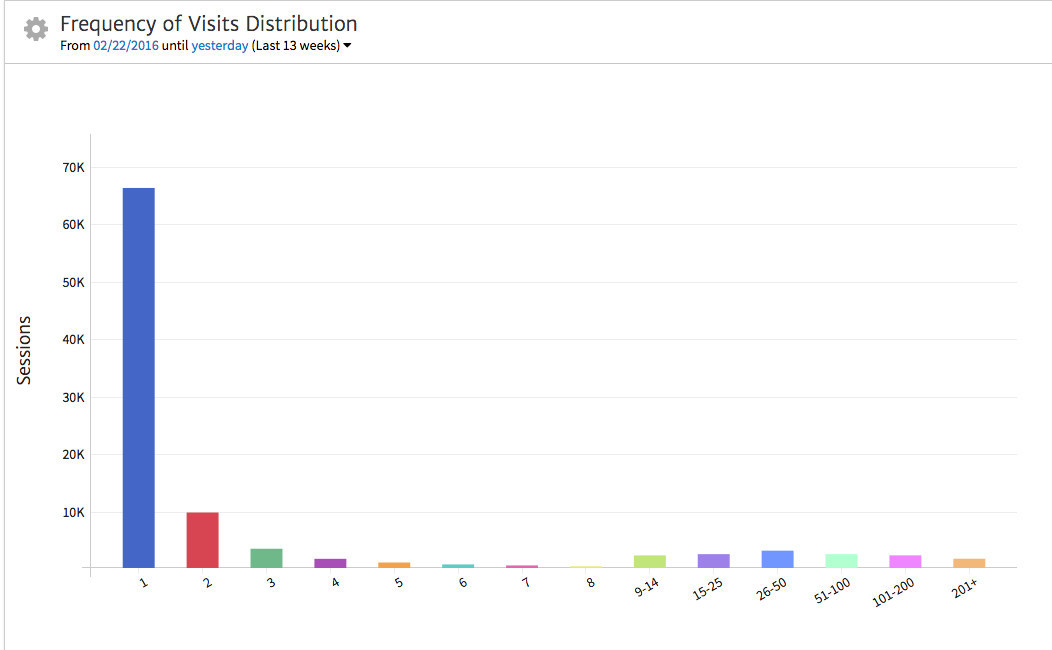
While one-time visits by far make up the majority of Sessions, you can see a fair number distributed in two- and three-time visits. Frequency here goes all the way to 201+, with several in the “buckets” for higher volume frequency. In our case this is likely a result of current users navigating to the Megalytic site to log in.
Of course, you can show much more than Sessions by frequency in this widget. Let’s tweak it to show how likely people are to convert based on the number of days they took to come back. To customize this widget, click the gear in the upper left to get to the widget options.
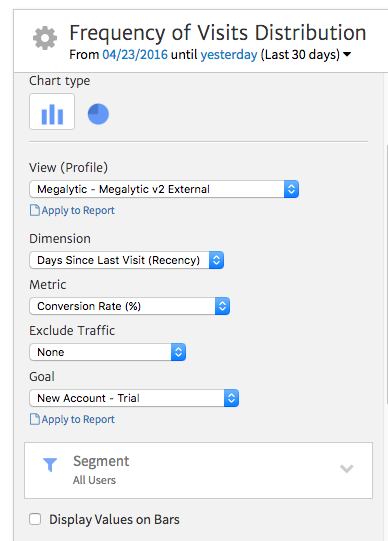
We’ll change Dimension to Days Since Last Visit (Recency). In addition, we’ll select a Metric of Conversion Rate and choose the free trial signup as the Goal. In the final widget, we see Conversion Rate broken down by the number of days from the last visit.
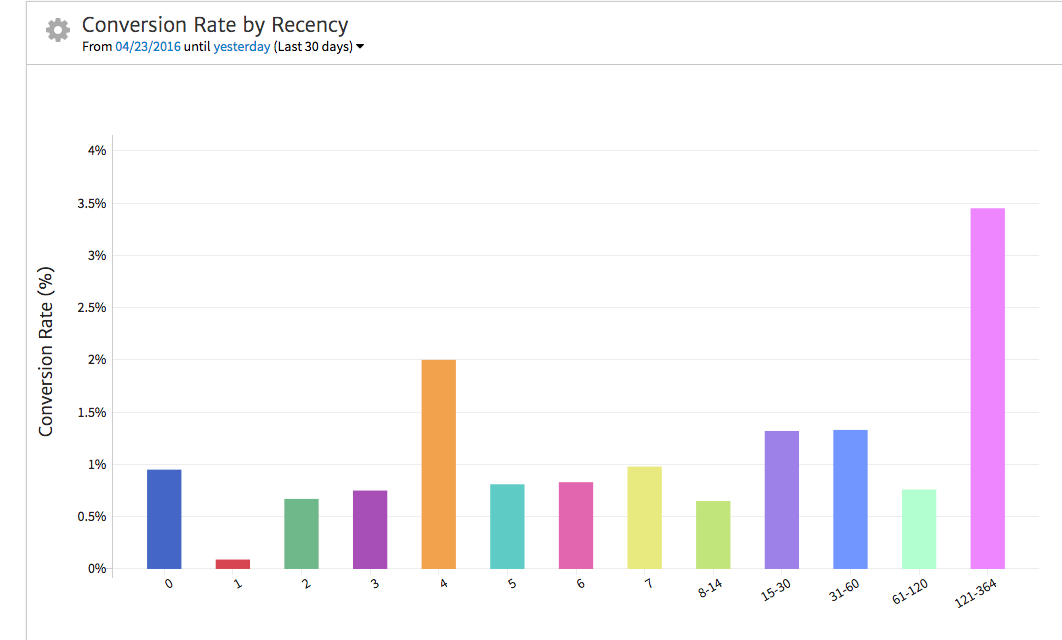
Right away, we see that the fourth day shows by far the highest conversion rate out of those who return within a week, at 2% vs. 1% or less. Based on this data, we can tailor our marketing strategy to best target past visitors likely to convert. For instance, we can set up a remarketing campaign to start showing ads four days after people visit the site. We also note a pickup in conversion rate in the 15-60 day range, with the most significant spike beyond 121 days. This indicates a longer consideration cycle that could be supported by an email marketing campaign.
Based on this data, you could also plan for a remarketing campaign, and email messaging specific to people who visited the site but have not converted after the first four months. Based on the conversion rate spike in this timeframe, these people may be likely to reconsider the product and return to sign up.
Conclusion
Use the Loyalty widgets to showcase how often people are returning to your site and how much frequency plays into conversion. This data can tell you how well your site is driving return visits, in addition to zeroing in on the behaviors of users who are most likely to become customers.
Seeing the data is great, but the power of this information comes when you are able to create and alter strategies to act on the data. With this kind of insight you can remarket ads for the precise time period where historically returning visitors are most likely to convert. Use the data to understand your sales cycle, how long people consider your service before being, and how often they’re likely to visit your site. Understanding user behaviors is the foundation of our ability to cater to their preferences and provide the experience that is the most conducive to building new and loyal customers.