
May 21, 2024
Understanding Facebook Page Insights: Likes, Reach, and Page Views
By Megalytic Staff - April 05, 2016
Accessing Facebook Page Insights
You’ll need to have access to the Facebook Page, via a Page Role to view Page Insights but any access level will work. To view your page’s metrics, click the Insights link located in the top navigation bar on your Facebook Business page. This link appears once a Page administrator has given you a Page Role with access.
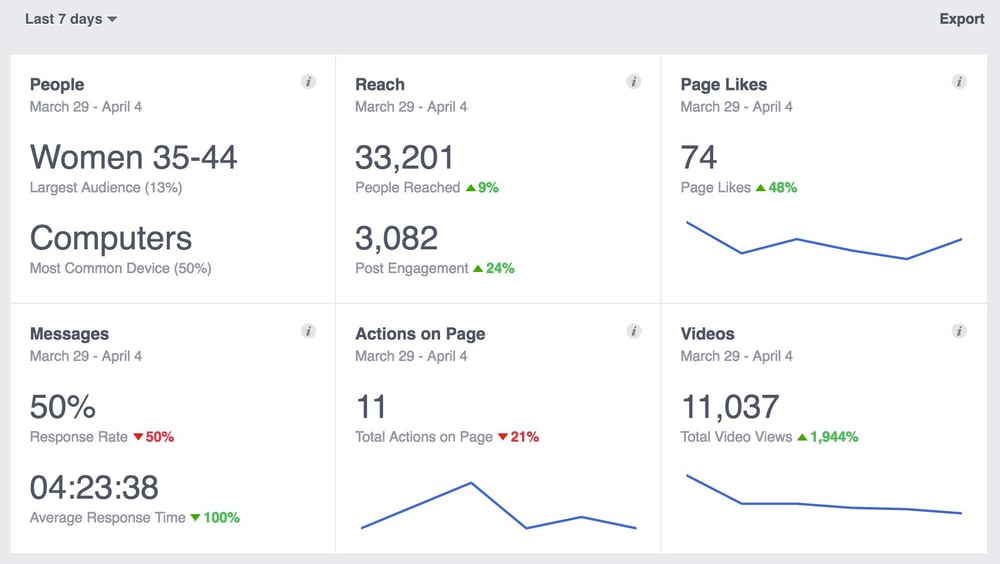
At first, you’ll see an Overview screen with several high-level metrics from your page. This page gives a snapshot view of reach, new likes, post engagement, video views, and recent post performance.
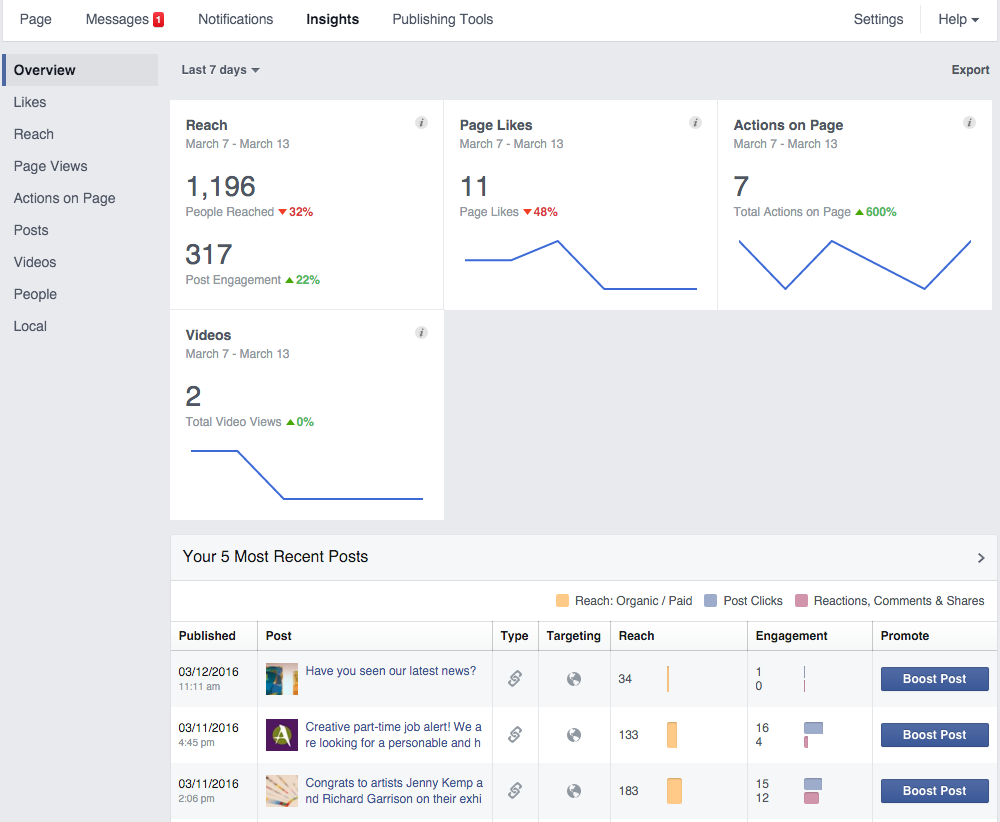
The main Insights page serves as a handy dashboard to view big picture trends on your page. Using the date selector at the top, you can change the date range to view today, yesterday, the last 7 days, or the last 28 days. You can also click any post in the list to view that post on your page, along with its comments and likes.
Moving beyond the Overview section, you can delve much more specifically into who you reached on your Facebook page.
Measuring Likes
While Facebook likes aren’t an end-all metric to success, they do indicate how many people are choosing to follow your brand. You should watch the volume of likes over time to see if they are continuing to grow – as they should be - or if they are decreasing because people are unliking your page.
By selecting “Likes” from the left sidebar, you’ll view data on how many likes you’ve gained over time and where these came from. Using the date selector at the top, you can set a custom timeframe going back as far as you’d like. Now you can measure likes from the beginning of time (when you started your Facebook page) or just from a set amount of time, such as the past 14 days.
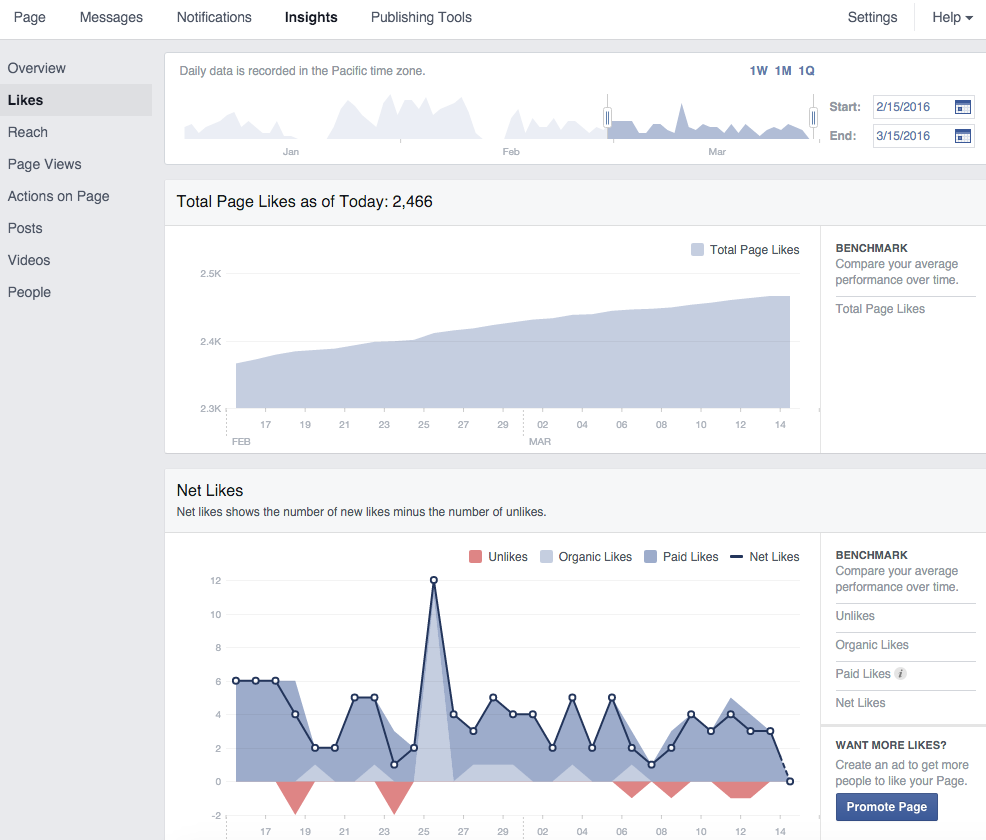
The graph above titled “Total Page Likes as of Today” will give you an idea of how likes have trended over the period you’re looking at. You can mouse over any day on the graph to see exactly how many likes you had at that point in time.
Next, the “Net Likes” section allows you to see new likes vs. unlikes each day, with the graph breaking down paid vs. organic likes. Paid likes are counted if someone likes your page within one day of viewing an ad or within 28 days of clicking an ad. You can click any of the like categories to view it specifically on the graph (for instance, if you want to see a graph of only paid likes).
This graph is helpful to measure how much of an impact ads are having on your overall brand positioning online, as well as how much attention is being garnered by your organic efforts. By watching these metrics, you can catch red flags - such as frequent unlikes or spikes in unlikes. Losing followers may be an indicator that, while you have an initial draw, you are not consistently delivering content that people want to read or that you’re posting too much or too little.
Analyzing Reach
While Page Likes show your opted-in audience, Facebook reach goes beyond this group to show you how many people, followers or not, actually saw your posts. This includes eyes on your content as an organic post in a News Feed, a promoted post, or a post a friend commented on.

The first graph shows you reach trends over time, while the next graph shows engagement with posts (those who reacted to, commented on, or shared posts). Interestingly, often the posts that reach the most people don’t necessarily generate the highest level of engagement. To get more detail, you can click to select a date range and see the specific posts for that timeframe. From this data, you can determine what types of content were most likely to generate interest from people exposed to your posts.
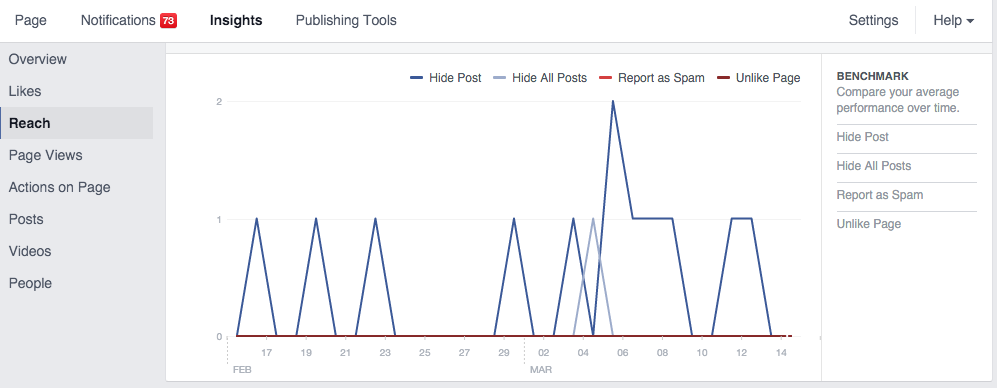
Scrolling down in the Reach section, the next graph will show you negative feedback, breaking down how many people chose to hide posts, report you as spam, or unlike your page. While you can expect individuals to not want to see your content on occasion, you should watch this section for spikes indicating more frequent activity. In addition, a choice to report a post as spam indicates a greater negative reaction than someone simply hiding a post or not wanting to see your content. If any content is reported spam by multiple people, that content probably bears more detailed scrutiny to avoid creating similar posts in the future.
Page Views
The Page Views section allows you to see data about the individuals who choose to browse your Facebook page. This information can indicate people are using your page to look up your contact information or to find out about upcoming events. An actual visit to your profile marks a higher level of engagement than simply liking a post in the News Feed. This suggests a more active interest in who you are and what you’re doing rather than a convenience-based like.
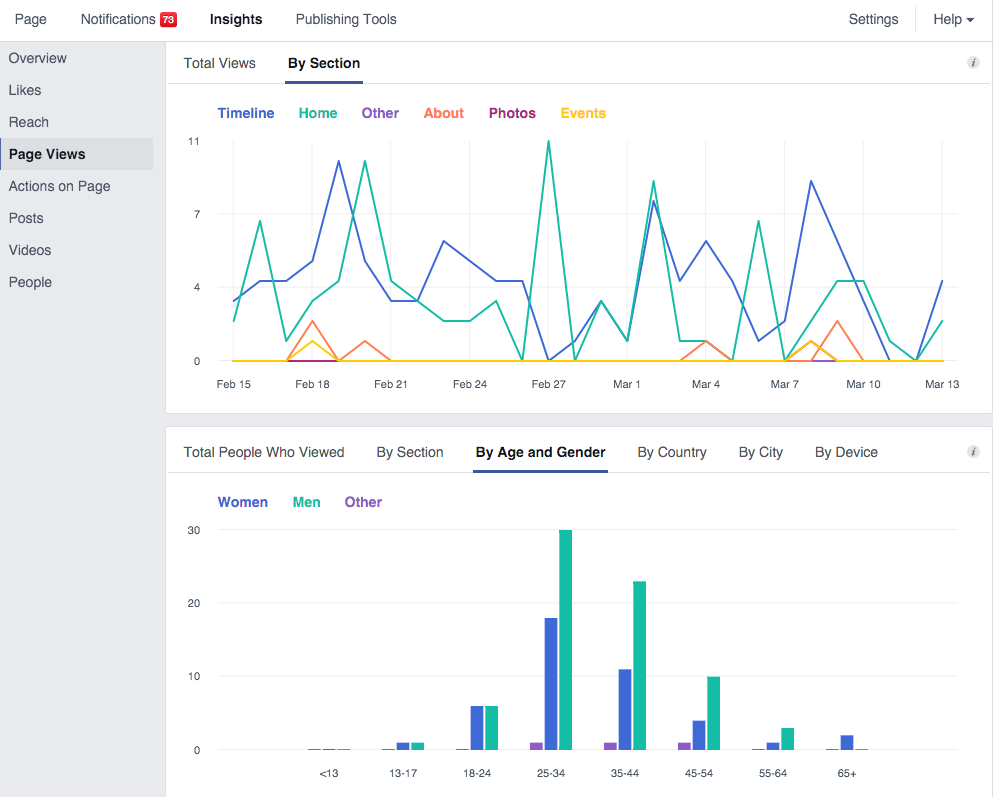
The top graph allows you to break down views by section of your page (correlating to the tabs across the top of your page). If you post frequent photo albums to your page, you can see engagement by viewing how often the Photos section shows up on the graph. Additionally, if you’re trying to draw attention to local events, you can measure the effectiveness of creating Facebook Event pages off of your brand page.
The next graph lets you see data about the individuals who viewed your page. Using demographic information, you can determine if you’re reaching your target audience. For instance, this page shows the largest spike among men 25-34, with the next among men 35-44. As this information only measures those who click through to your page, it provides a fairly precise view of the demographics who take that active interest in your brand. This demographic insight can also help inform other marketing strategies beyond Facebook.
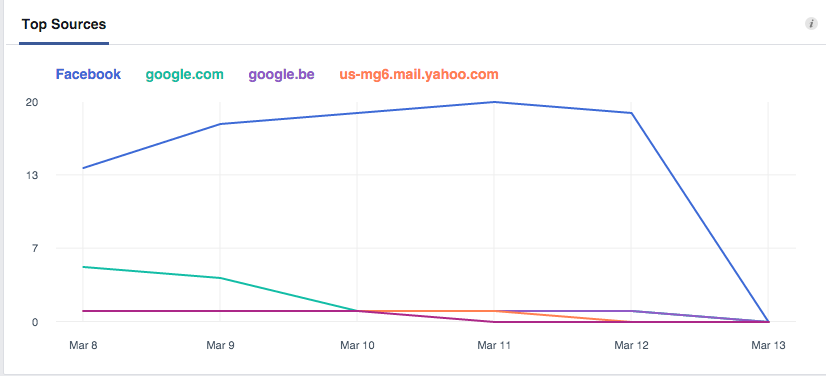
Finally, the bottom graph allows you to see what sources drove users to the page. This can help you determine how many people are finding your brand’s page via organic search or by clicking links directly from your site. In this example, besides Facebook and Google, we also see a click from mail.yahoo.com, showing the effectiveness of email outreach in driving people to your page. Even a simple social link in an email signature can generate clicks to view your brand’s page.
Conclusion
Facebook Page Insights provides detailed information about how well you reached your audience via your Facebook Page. The information acquired from analyzing your metrics can impact everything from how you set up audiences for ads to the graphics you select that accompany your posts. It’s important to monitor this data regularly to determine how effectively you’re driving likes and post engagement, and to ensure your content is resonating with your intended audience. Use the data on how each post performed to craft your messaging strategies for the future.
This is just a start, as there are even more metrics available through Facebook Insights that can help you measure and refine your social media marketing efforts. Next time we’ll get into additional sections of Insights, including how to view specific demographic data for your audience. In the meantime, check out Megalytic’s new Facebook integration to start showing Facebook Insights data in your comprehensive digital marketing reports!