
May 21, 2024
Top Analytics Reports for Business Owners
By Megalytic Staff - July 02, 2014

Here are four reports we recommend business owners use when checking in on their site’s analytics.
Audience Overview (Audience > Overview)
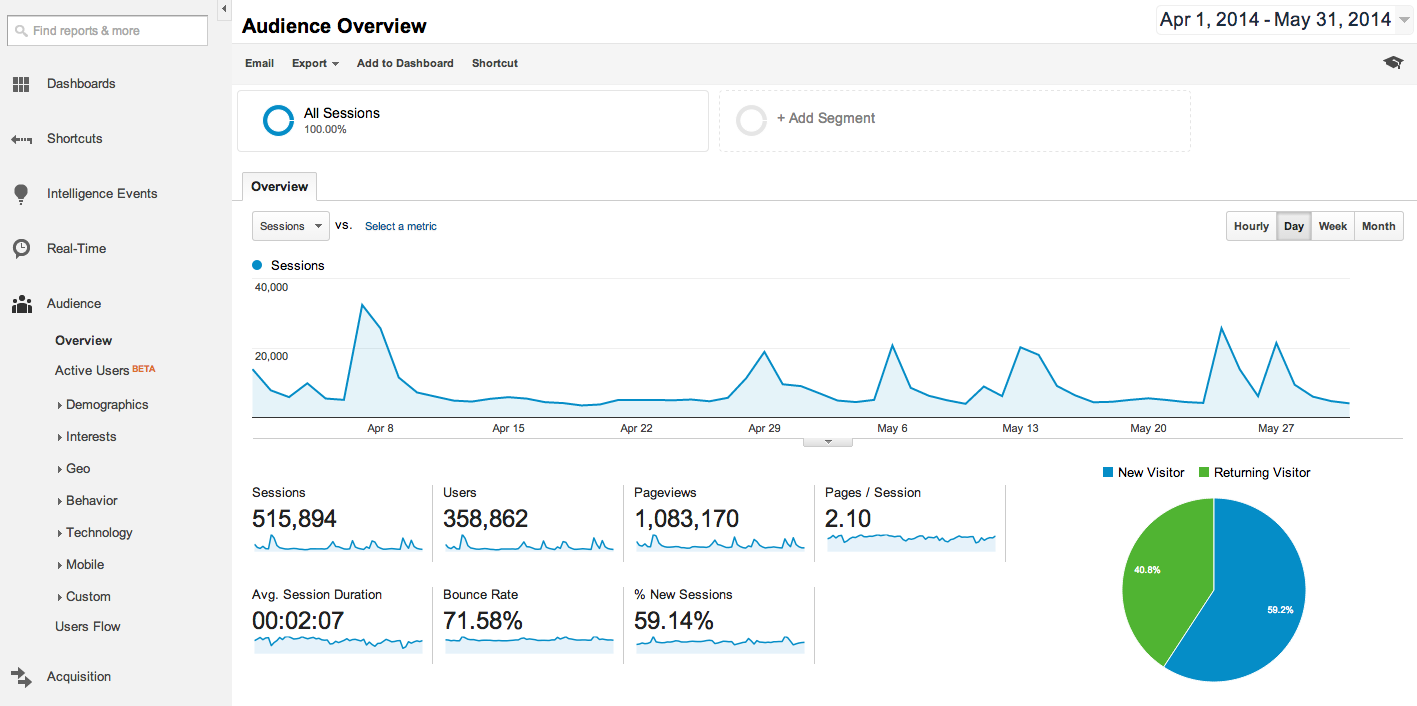
The Audience Overview is the default page shown when you access the Reporting tab within Google Analytics. This report provides a high level snapshot of how many people are coming to your site and how well they’re engaging with the content.
To get the most value from this report, you’ll want to look at various date ranges. Look at a week, a month, a quarter, and a year at a time, comparing stats to previous periods to measure the health and growth of your marketing efforts.
Here are some examples of insights you could gain from this report:
If you’re hosting an event and pushing awareness through a combination of offline and online campaigns, you can see the overall effectiveness of your efforts by looking for traffic spikes in analytics. For example, if you see that you received 60 percent more traffic than usual in the two weeks leading up to the event, you can likely count your promotional efforts successful. But, if you see barely any increase, you know you missed the mark and will want to rethink your strategy for the next time around.
Through this report you can also quickly see spikes in traffic from an email newsletter or other regular marketing pushes. For example, in the screenshot below you can see regular spikes when a newsletter was sent out linking back to content on the site. You can also see at a glance that the most traffic came from the April 7 issue, leading you to assess the particular items that worked in that newsletter for future strategy.
This report can also be used to raise a red flag about site performance, causing you to look deeper to identify the source of the problem. To do that, graph some other metrics besides the session (traffic) – which is the default. You can select the metric that is graphed by choosing from the selector in the upper left. For example, you may select bounce rate and see a sudden increase indicating that engagement on your site is hurting. You can then dig further to find that a popular landing page isn’t displaying properly – perhaps the page’s images are broken or an important call to action is being cut off.
Top Traffic Sources (Acquisition > All Traffic)
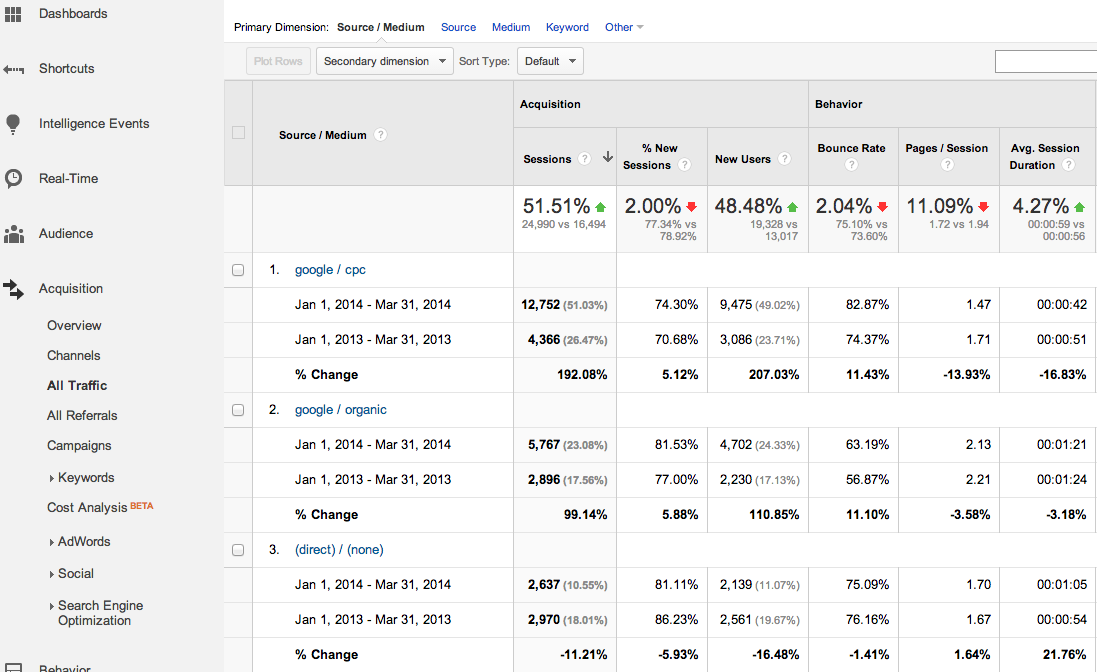
The All Traffic report breaks down the top sources by which people arrived at your site. This report can help you compare where advertising, organic search, social media, press placements and other referrals rank together in driving traffic and conversions. You should also look at engagement for each source (bounce rate, time per session, pages per session). Once again, you’ll find the most value by comparing stats to a previous date range to see how particular sources have increased or decreased. Google’s documentation describes how to select and compare date ranges . The report below compares Q1 2013 with Q1 2014.
Here are some takeaways you can get from this report:
A sudden drop in traffic from a particular source can flag a need to ask your team to assess your strategy for that source. For example, if Twitter traffic dropped by half from the previous month, you may want to rethink how you’re promoting your content via Twitter.
- Has your rate of engagement changed – whether an increase or a decrease?
- Have you changed the way you are interacting with your followers on Twitter?
- Did you begin posting different types of content that your audience may be less interested in?
- Did you recently attend an event where you live-blogged material at a rapid pace?
On the flip side, a sudden rise in traffic from a source should push you to see what specifically worked to boost visits and what you can learn for the future. For example, an increase in organic traffic should lead you to look further at what pages people were landing on from organic search. You may find that a specific product page or blog post captured a popular phrase people are searching and work off of that information to optimize more pages.
Top Pages (Behavior > Site Content > All Pages)
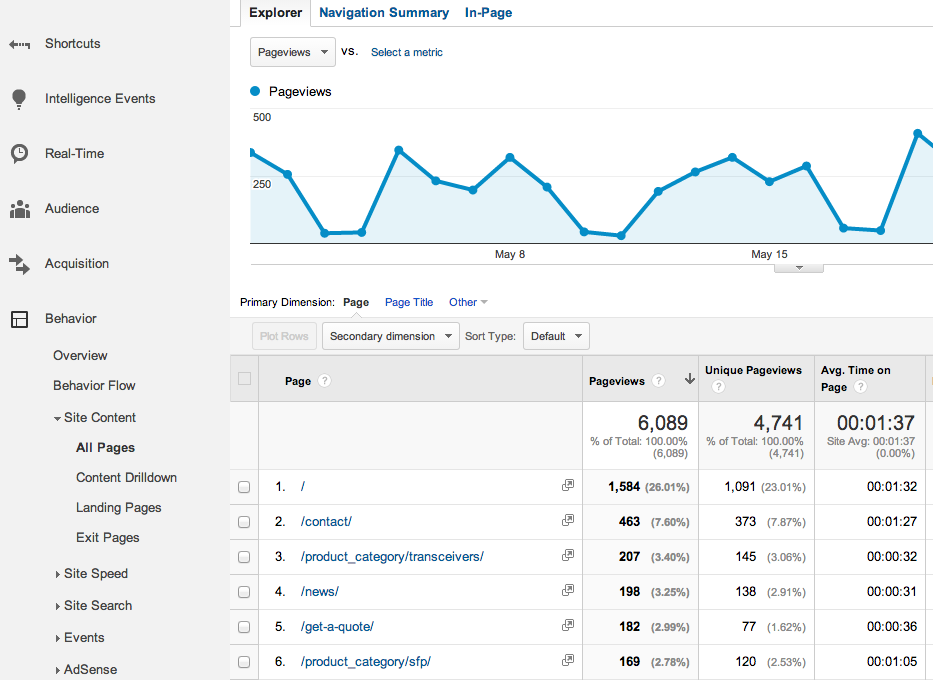
This report shows the most popular pages people are viewing across your site. The data helps to see not only what users consider most important but also how well they engage with specific portions of the site.
So how can this report provide insight for business owners?
First, you can see at a glance what products and services customers are most interested in. Then, you can use this data to inform marketing decisions. For example, if you run a wood furniture store and see that most people look at the dining room set category on your site, you should probably put more marketing effort toward dining room sets. Or, on the flip side, if you’re concerned about selling more dressers and see most customers don’t reach those pages on the site, you may want to focus some blog content around your dressers, run an AdWords campaign focused toward the dresser pages or feature your dressers in an upcoming email campaign.
Next, you can see which pages are showing the best and worst engagement, sorting by bounce rate and average time on page. Use a weighted sort to make sure you’re looking at the pages that get enough volume to show accurate stats. For example, you can identify the product pages where people are most likely to bounce off and then prioritize improving the content and layout of those pages.
Goals Overview (Conversions > Goals > Overview)
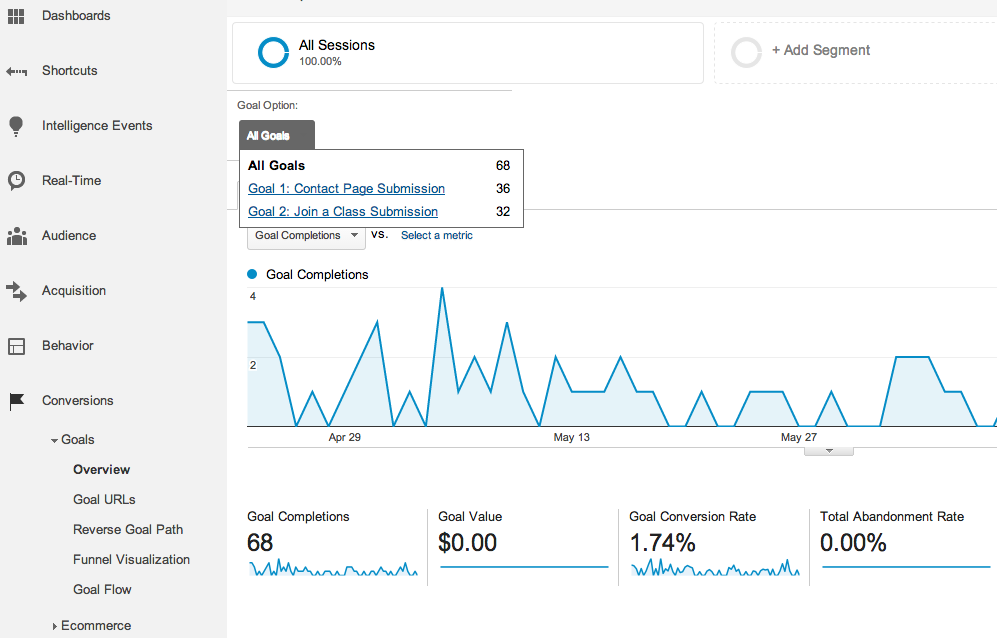
For sites that have set up conversion tracking, the Goals Overview report shows you the conversions that are happening on your site. Conversions may measure anything from a lead form submission to a newsletter signup. At a glance, you can see overall conversions and conversion rates, as well as a breakdown of specific conversion goals.
What can you learn from this report?
First, if you have multiple conversion goals set up for your site, you can see which ones perform the best. You can look at each individual goal by selecting it from the “Goal Options” selector in the upper left of this report. By default, it is set to show “All Goals” combined together.
For example, say you run an auto repair shop. You have a dedicated page for scheduling service, but you also have a generic “contact us” page. In this report, you can see if more people are contacting you through the general contact form or if they’re going to the page dedicated to scheduling a service appointment. If you’re getting a lot of service requests through the general contact page, you may want to make the “schedule” page more visible.
Next, you can see what sort of overall conversion rate you’re getting for each of your specific goals and how that is changing over time. If you just launched a major ad campaign or a content plan and see your conversion rate for an important goal dropping, you may want to revisit your strategy.
By default, Google Analytics graphs the total goal completions. To see the conversion rate, choose it from the selector appearing underneath the “Overview” tab.
Conclusion
As a business owner, you may not have the time, nor interest, in becoming a Google Analytics expert. However, you still understand the importance analytics holds to your business. By honing in on specific reports, you can ensure you see the information that is most important in helping you to make decisions or the data you need to push your internal team to investigate further. If you need it, Megalytic can help streamline your monthly business reporting by providing easy-to-read, customized reports to give you the insight you want, without all that noise.