
May 21, 2024
Tips for Building Your Data Reporting Templates
By Megalytic Staff - November 28, 2016

What Data Do You Need to Show?
Identify what data will best show how well your client’s digital campaign performed over the previous period. Ideally, you should define KPIs (key performance indicators) at the onset of a campaign in collaboration with the client. Establishing these early on helps you to create reports and helps clients know what to expect when receiving them. Of course, clients may not always anticipate all or the most relevant KPIs for inclusion, but that’s where your expertise comes in handy.
First, you should show a summary of website performance on an overall level. Next, think about which channels you’re directly touching as part of your efforts for a client. If you’re managing paid search campaigns as well as an organic search engine optimization plan, you’ll want, at minimum, to use widgets showing performance for each of those channels. Finally, provide a basic breakdown of all channels; for instance, even if you’re not directly managing social media, you should still be aware of spikes in Facebook traffic.
Key performance metrics you want to show for each channel typically fall into traffic, engagement, and conversion categories.
Important traffic metrics include:
- New Users
- Sessions
- Pageviews
Top engagement metrics include:
- Avg. Session Duration
- Pages/Session
- Bounce Rate
Key conversion metrics (ideally tracked both on an overall level and for individual Goals) include:
- Goal Completions
- Conversion Rate
If you’re running ad campaigns, you should also show these metrics:
- Clicks
- Impressions
- CTR (clickthrough rate)
- CPC (average cost per click)
- Cost
- Cost/Conversion
While there may be other data worth including associated with offline efforts or ranking reports, these metrics will cover the bulk of how users are reaching and interacting with the site.
Showing Top Level KPIs
The KPI widget in Megalytic provides a simple way to show high level metrics at the top of your report, comparing against the previous period and previous year. Use the Multi-KPI widget to show up to four metrics side by side.
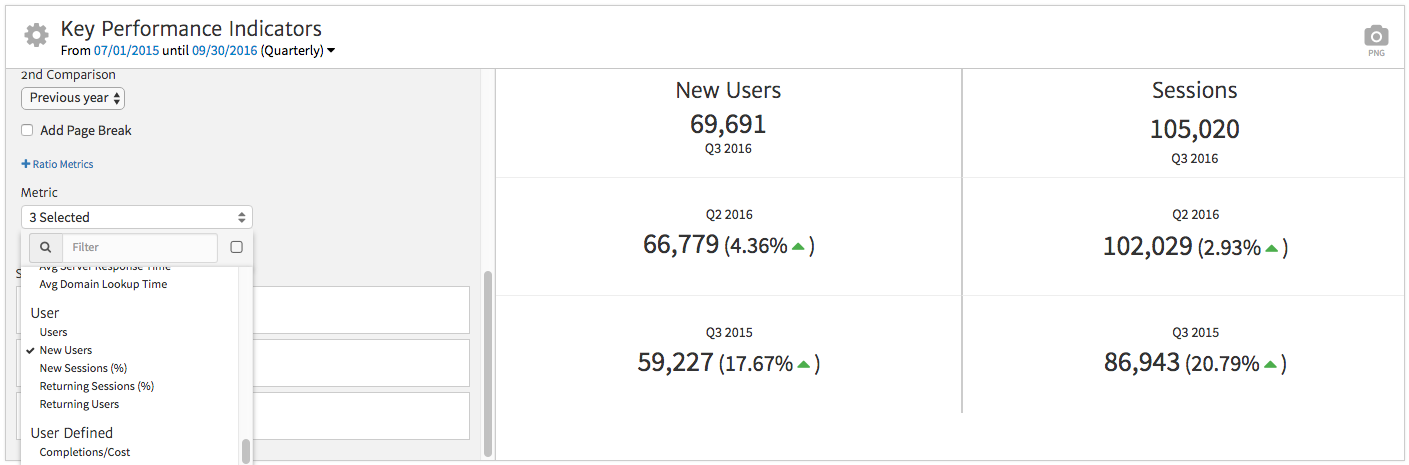
Below is an example of configuring the Multi-KPI widget, in which we’ve selected some traffic-based metrics to put at the top of our report. Within the widget options, use the “Metric” dropdown to select from most metrics available in Google Analytics.
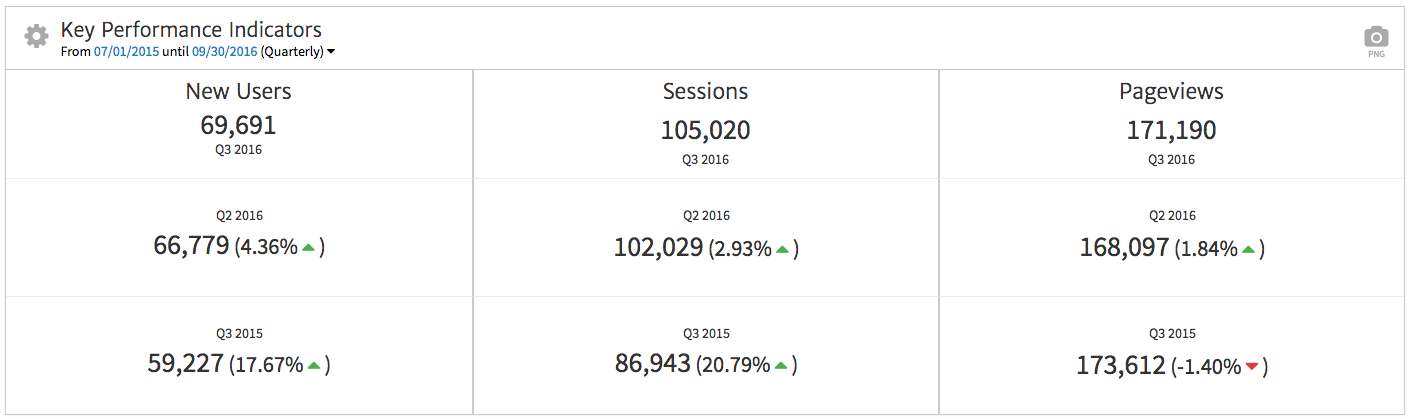
Next, see the final widget with our metrics chosen. In this case, we’ve chosen to look at quarterly data, but note that you can click the date range at the top to choose from daily, weekly, monthly, quarterly, or yearly options.
Showing KPIs by Channel
Next, you should show KPIs for top channels that you’re involved in managing. You can easily configure the KPI widget to show data for a specific channel or source using Google Analytics Segments or Megalytic’s built-in filtering function.
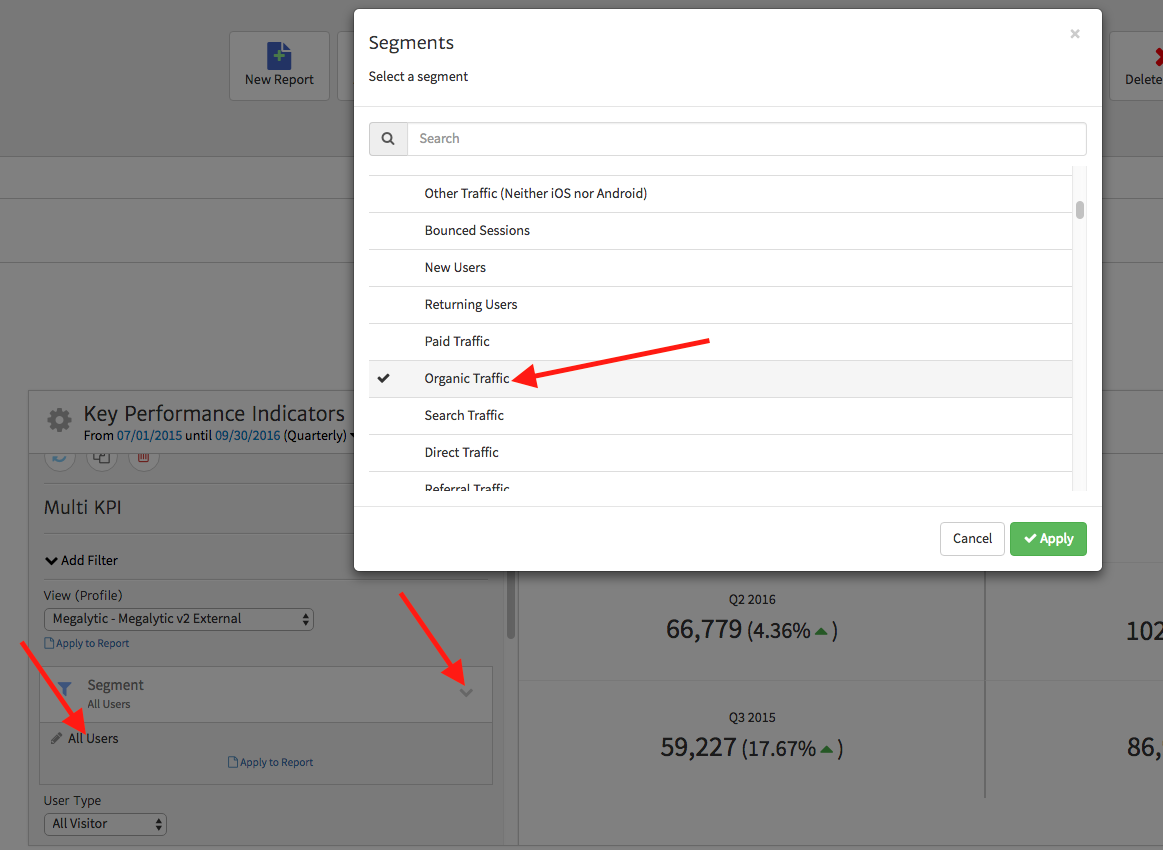
For instance, say you want to show KPIs for organic search. Within the widget options, click the “down” arrow symbol on the right of the Segment box. In the dropdown that appears, click on the current Segment name (“All Traffic” by default) and choose the “Organic Traffic” segment from the overlay box that appears. Finally, click Apply to finalize the setup.
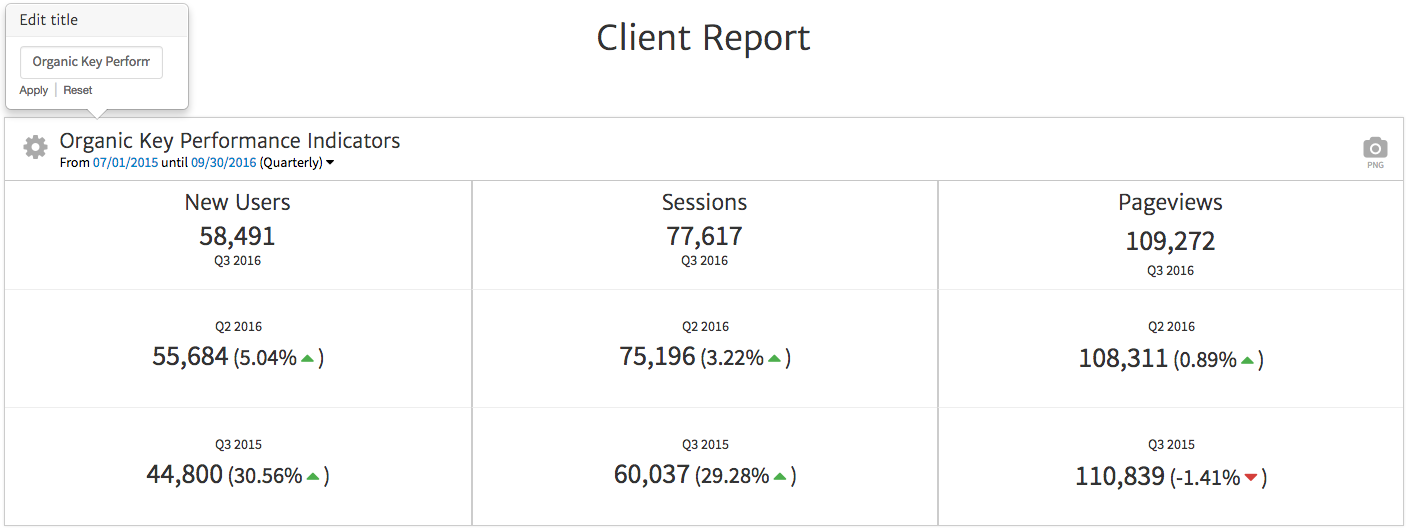
A quick shortcut when showing KPIs for multiple channels is to duplicate the first one and then edit the applied Segment to change the data shown. Once you’ve applied the new Segment, don’t forget to change the widget title so it describes what type of traffic it shows. Click on the title to see a text box and edit away. Here, we’ve labeled the widget so it specifically says “Organic.”
If you’re showing Paid Search performance, you can show Google Analytics metrics with a regular Multi-KPI widget, but you can also integrate with AdWords to use a widget that pulls stats directly from the ad platform. In fact, this is the only way to show conversions tracked within AdWords itself.
Compare Performance by Channel
Next, you should move beyond KPIs to compare performance among channels. By showing channels side-by-side, you can see which are most effective at driving value for your client’s site.
Whenever possible, focus on showing conversion-related metrics. For instance, in this example we want to break down conversion volume by channel to show how they stack up against each other in driving free trials. We’ll use the Completions by Channel widget. In the widget options, we’ll leave Completions as the metric and choose the Goal we want (in this case, “New Account - Trial,” representing trial signups).
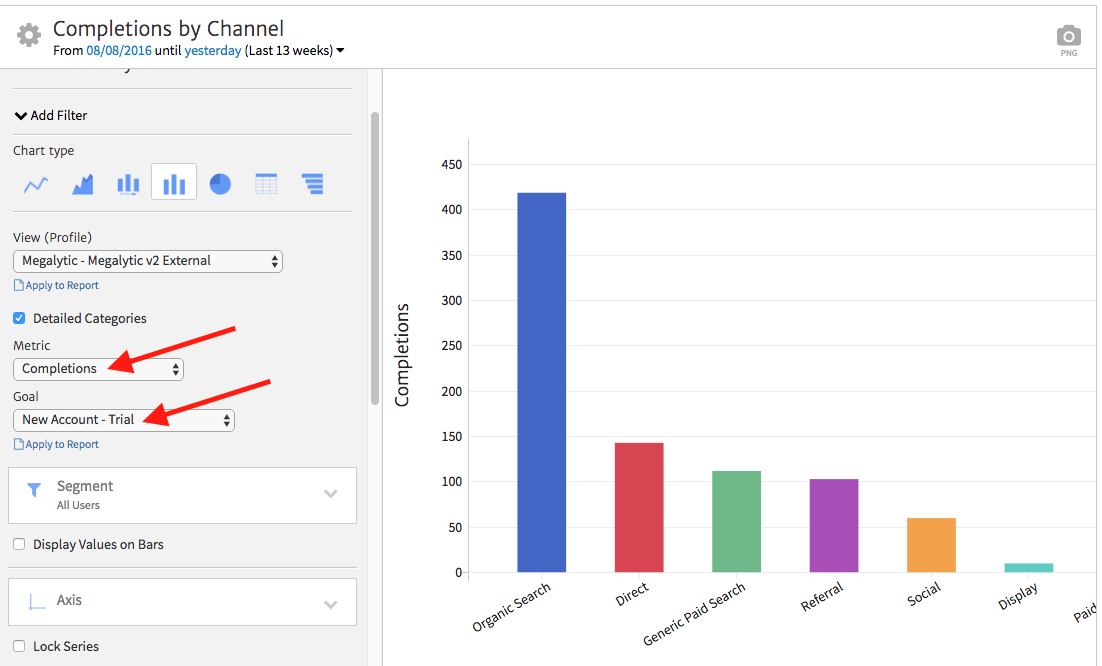
Our final widget shows a pie chart breaking down total Completions by channel. You can choose from different display options, including bar graphs and line charts based on which types of visuals resonate the most with your clients.
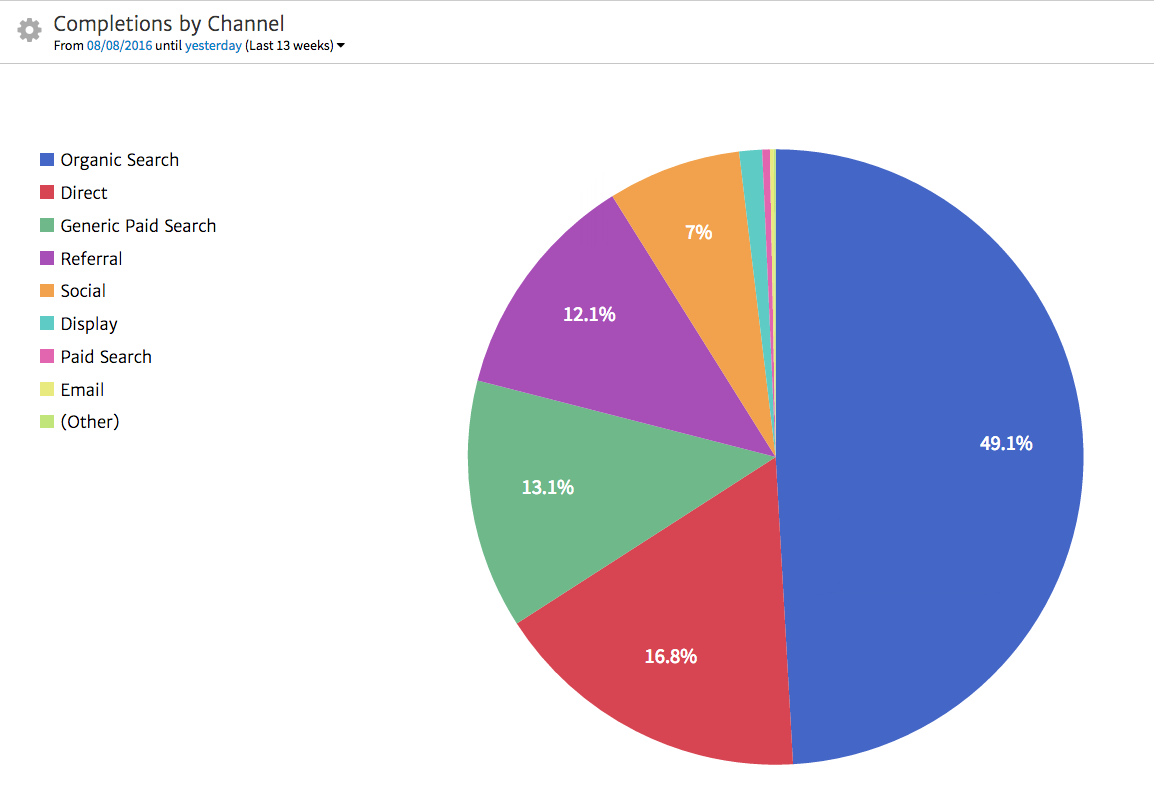
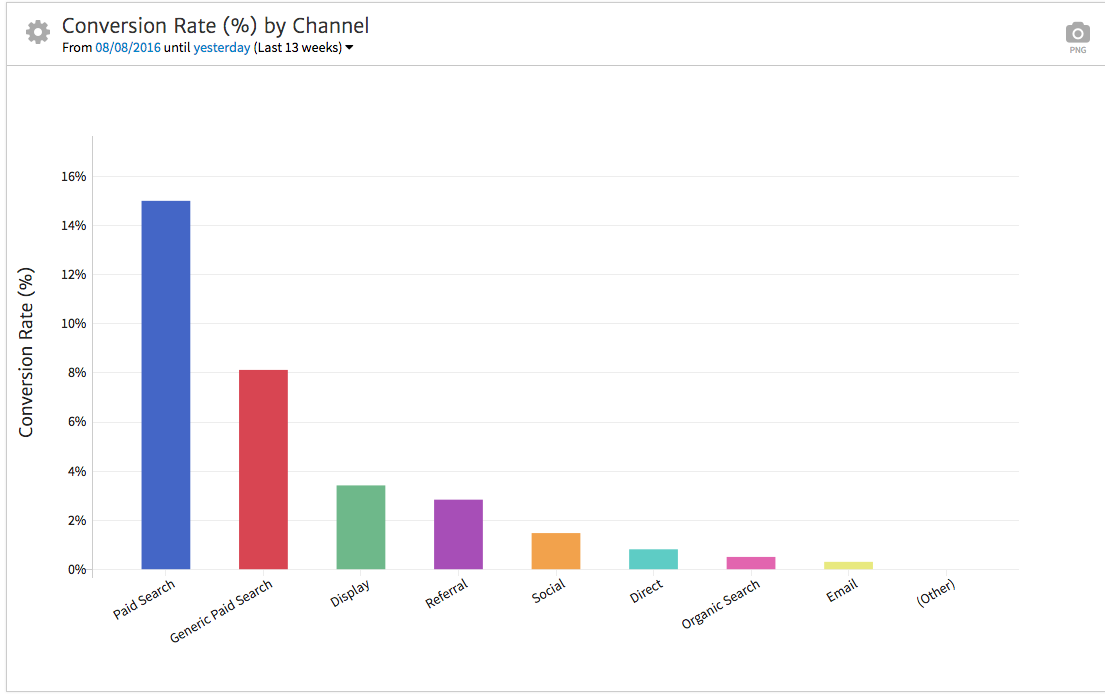
In addition, be sure to show enough widgets to provide multiple perspectives on data. From the example above, organic search drives, by far, the highest volume of Completions. However, showing conversion rate will point out which channels are most likely to drive conversions (vs. which drive the most conversions).
What Data Don’t You Need to Show?
While you’re considering which data best proves performance, consider what extraneous data you don’t need to show clients. We’re not talking about hiding data that reflects negatively on performance. But too much detail can both distract clients from the ROI metrics they should focus on and confuse people who don’t review web analytics metrics on a day-to-day basis.
For instance, a monthly report probably doesn’t need to break down pageviews for every single page of a 1,000-page site. Instead, the top 10 pages may suffice.
Also, consider the technical level of the clients to whom you’re reporting. A CEO likely wants to focus on top level metrics: How much traffic, how many leads, and how much revenue are your efforts driving, at what cost? Keep KPIs front and center when reporting to someone on this level.
However, a marketing manager may want to focus on more granular details: What geographic regions convert at the highest rate? Which landing page call-to-actions are most effective? How did last month’s TV commercial impact brand searches? Even when putting KPIs at the top for a CEO, fill in more detail further into the report for the staff member who wants more specific information. In every case, consider your audience and use the “Notes” widget to provide additional context that may not be immediately apparent in the data.
Conclusion
Once you’ve added all the widgets that make sense for your client report, you can save a template within Megalytic to use in the future . You can re-use templates both for the same client and for other clients where the same metrics make sense.
Don’t assume that your templates are 100% finalized from the point of creation though. Solicit feedback both from your client and from your team as to additional data you should show, unnecessary metrics you can remove, or widget order to prioritize the most important data. The most important thing though, never settle. Continue to refine your reports as your relationship and work changes over time to continually prove the value of the work you do for clients!