
May 21, 2024
Measure Blog Marketing Success with Cohorts in Google Analytics
By Megalytic Staff - June 06, 2014

Why Do Product Companies Invest in Blogs?
Many product companies invest in blogging to build awareness of their product within an online community. These blogs are often not specifically about the product, but rather cover topics that are of interest to potential users of the product. The idea is that blog readers get indirectly exposed to the brand while visiting the blog site. They develop a positive image of the brand, remember the product, investigate the product content when they have a need and hopefully make a purchase.
Blog visitors might not click through to the product content during their first blog visit. However, the end goal of the sponsoring company is that blog readers will check out their product. For this reason, it is critical to be able to measure if blog readers come back, learn about your product and eventually become customers.
Measuring Success
Measuring success of purchases or new accounts is relatively well understood using Google Analytics Goals and/or eCommerce features. But, what about awareness building?
How do you measure the impact of blog reading on product awareness? Awareness is a fuzzy concept and can be defined many ways. From a web analytics standpoint, you can focus the measurement problem by simply defining awareness of your product as having visited a product content page (e.g., your product home page, or features page). With that simplifying assumption, we can create a measurable definition of success:
The Awareness Success Rate of your blog is measured by the percentage of blog visitors who eventually also visit a product content page.
Success, defined like this, can be measured using a type of conversion. This conversion could be defined using Google Analytics Goals (see Footnote 1 - Why didn't we do this analysis using Google Analytics Goals? ). But, this is a real-world example and we didn't have the goals set up during the period we wanted to track! So, instead we used cohort analysis in Google Analytics to count the number of visitors that first viewed blog content and then later viewed product content.
Real World Example
Between May 19 - 23, we experimented with some new methods for promoting this blog. It is now about 12 days later and naturally, we are wondering what has happened to the people who found us via the blog during that period of time. Did they come back for additional visits? Did they visit the product pages on Megalytic . Did any of them open trial accounts or purchase subscriptions? Since we want to track the behavior of a specific group, this is a perfect opportunity to use cohort analysis .
Setting Up Our Cohort
We want to define a set of users in Google Analytics that found us via our blog for the first time between May 19 - 23. To do that we created a User Segment. Read this blog post by Justin Cutroni if you need to brush up on Google Analytics Segments.
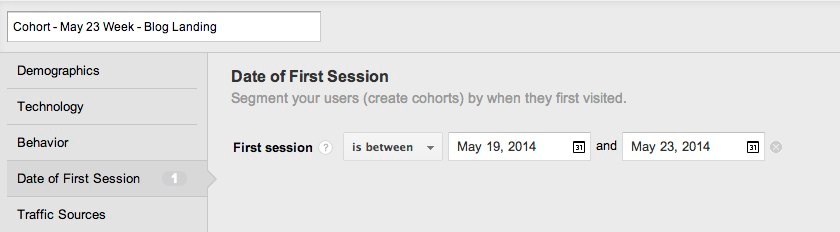
Our segment is called Cohort - May 23 Week - Blog Landing . Using the "Date of First Session" tab, we set the date range for the users' first visits.
But, we do not want all users who came to the site for the first time during that date range. We want to isolate those who landed on a blog page during their first visit. To accomplish that, we use the "Advanced >> Conditions" tab to set the landing page.
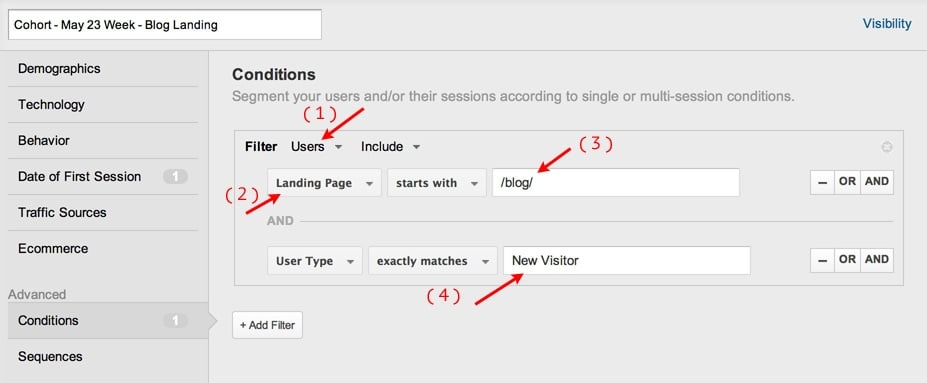
The four numbered arrows point out some important details that determine how this segment works. Each number is described here:
- We want to filter on Users (not Sessions). That is because we are creating a cohort of Users and want track them over time. If we had selected Sessions, the filter would only show sessions from this cohort that landed on blog pages and we wouldn't see any of the repeat visits where they might have landed on product pages (and maybe become customers!).
- The dimension that we are filtering on is Landing Page. We want to restrict our cohort to people who arrive on the blog having never seen our product content.
- We filter on Landing Pages that start with /blog/ . All our blog content is under that path. Depending on how your blog is structured, you may need to use a different type of condition (like Regex).
- We restrict the filter further to only include users who are New Visitors. This ensures that we don't accidentally grab somebody who arrived during May 19 - 23 first on a product content page; and then later came back during the same period and landed on a blog page.
Tracking the Cohort
Once we've defined the cohort, we can look at any report - including custom reports - to check out various aspects of their behavior. For the purposes of this blog, we created this simple custom report that we can use to look at the issues of product awareness and conversion mentioned at the beginning of the post.
Out of the box, we can already get some useful information from this report.
![]()
The numbered arrows point out the details described below:
- Starting on May 24, we are seeing only the repeat visits from the cohort. As you can see they drop off rapidly, but there is "a tail", i.e., there are a small number of users coming back each day. Even 12 days out, on June 4th, 7 users from this cohort showed up. Ideally, we'd like to see more repeat visitors, but at least we know that some readers liked the blog enough to come back. The next step in this analysis would be to try to understand the characteristics of that group of repeat visitors better - and effectively market to them. But, that is a topic for another post.
- 872 users are members of our cohort. We will use that number to calculate some conversion rates in a minute.
- 3 new trial accounts were opened by members of this cohort (so far).
- 1 transaction for $239.76 came from this cohort (so far).
That's some pretty useful information isn't it? Cohorts are a powerful tool in Google Analytics. But, so far we have just scratched the surface. Next, we'll dig a little deeper and calculate the Awareness Success Rate introduced at the beginning of the post.
Calculating the Awareness Success Rate
To do the calculation, we need to explicitly define the ratio. Here's what we going to use:
Awareness Success Rate = Cohort Users Who Viewed Product Content / All Cohort Users
We know the denominator - 872 - from the report shown above. To calculate the numerator, we need to isolate the users in this cohort who visited product content. For that, we use another simple custom report .
All this report does is show us the number of users who visited our pages. When we apply our cohort segment to this page, we will see which pages our cohort visited. The idea is to then filter these results to show only the non-blog pages visited. Then count up the users.
Here is the advanced filter that we apply to this report. It excludes Pages that are not blog pages. For us, that is the product content.
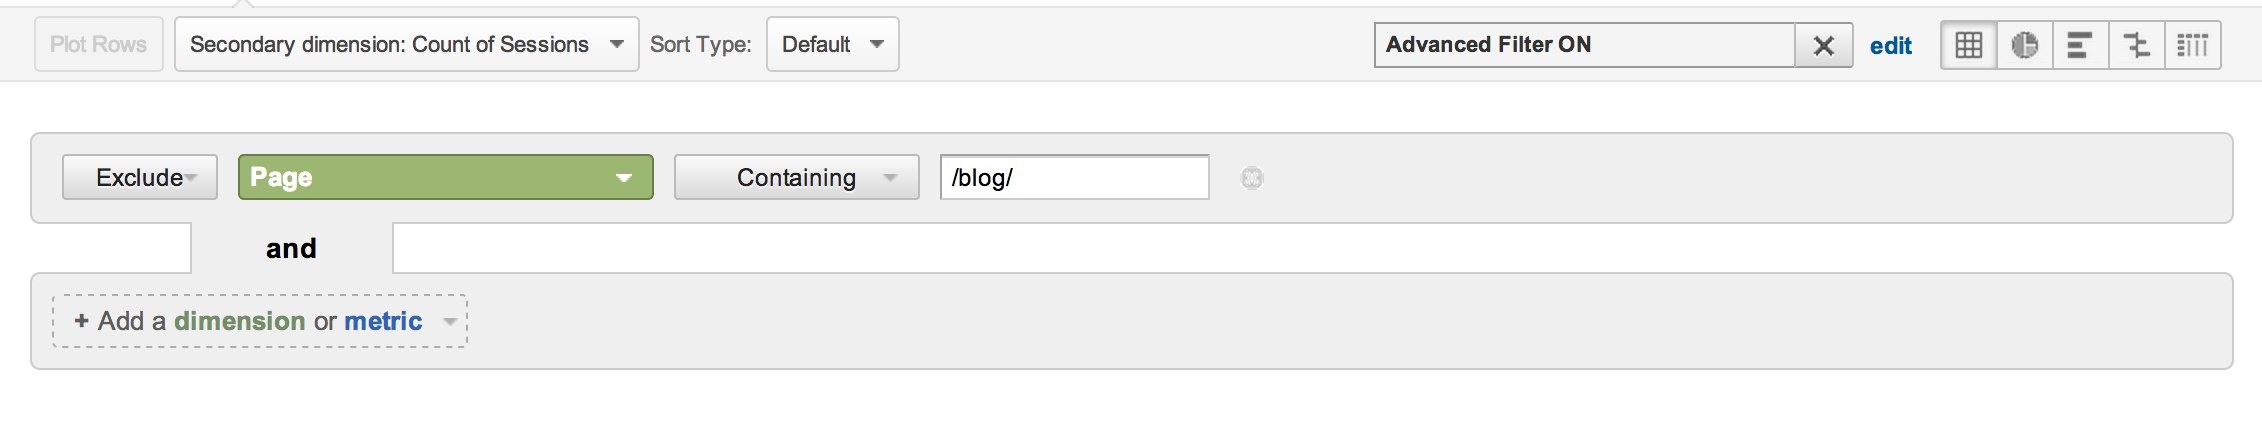
When we apply this filter to the simple Page report, along with our cohort segment, we see the product content pages viewed by the cohort.
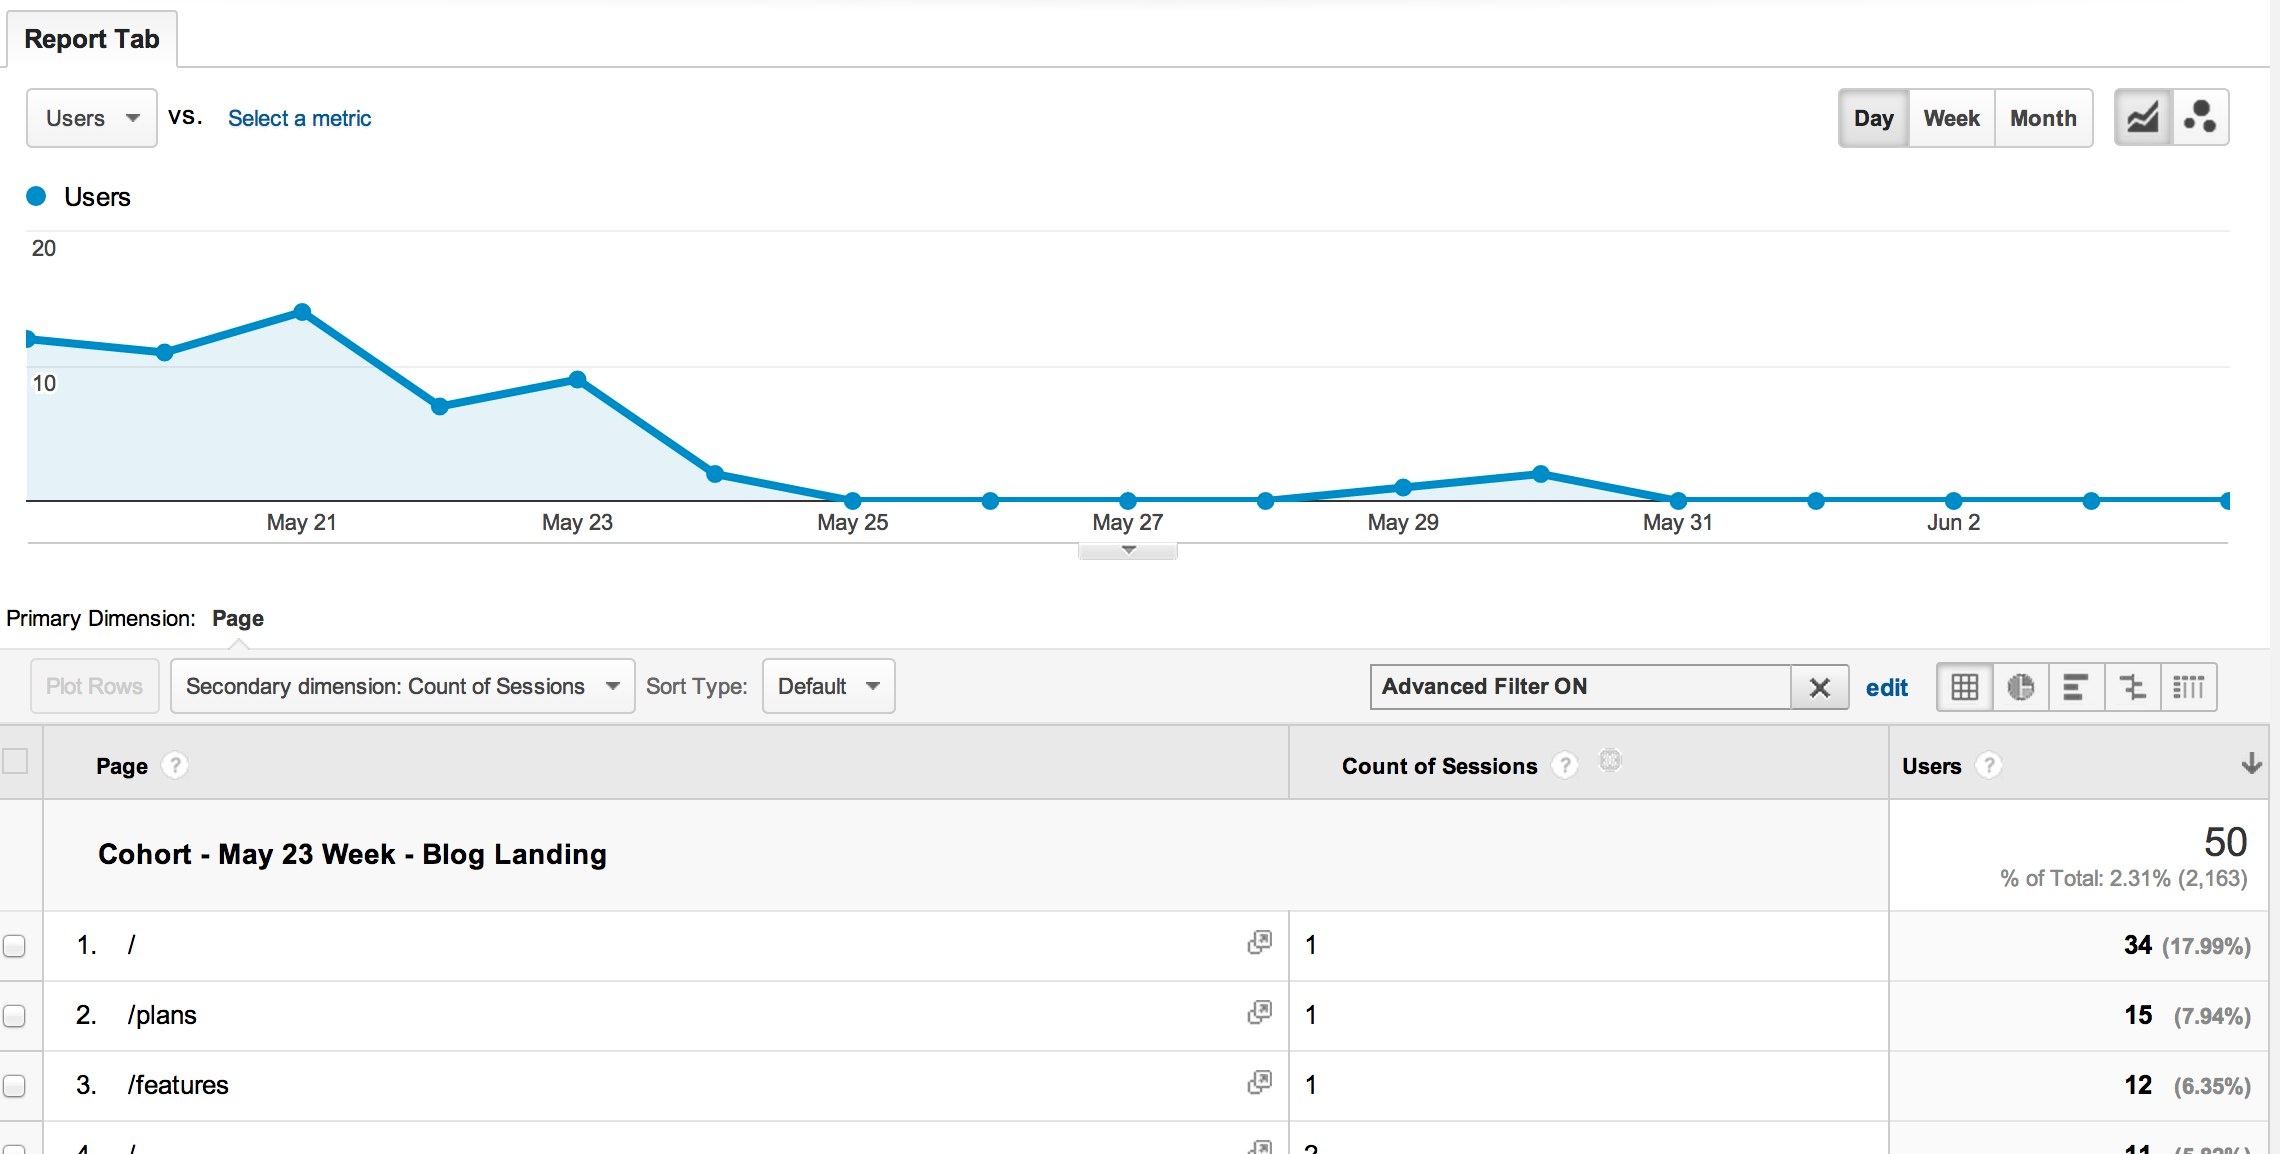
In the top right of the table, it shows that the total number of Users is 50. So, 50 Users in our cohort viewed product content. Going back to our ratio:
Awareness Success Rate = 50 / 872 = 5.73%
As a click-through rate, 5.73% is not too bad. Of course, this is different than a click-through rate, so it would be premature to pat ourselves on our backs. It would be interesting to see how this rate varies based on the type of blog content that the User viewed. I'll bet we can move that number up and that's the whole point of this analysis! Once we are measuring the Awareness Success Rate, we can start working on improving it.
Calculating Repeat Visitors
At the beginning of this post, we mentioned that generating repeat visitors (i.e., a loyal audience) is an important goal of this type of blogging. So, can we measure the percentage of repeat visitors in our cohort?
You may have noticed that I snuck an extra column into the custom report above (as a secondary dimension): Count of Sessions. This isn't a dimension that you see often, but it is useful. It tells you whether you are looking at data for a 1st visit, 2nd visit, 3rd visit, etc. So, if we want to look at only the repeat visits, we can filter for Count of Sessions > 1, like this:

Applying this filter to our simple Pages custom report above, shows the repeat visits over time, as well as the total number of users making repeat visits.
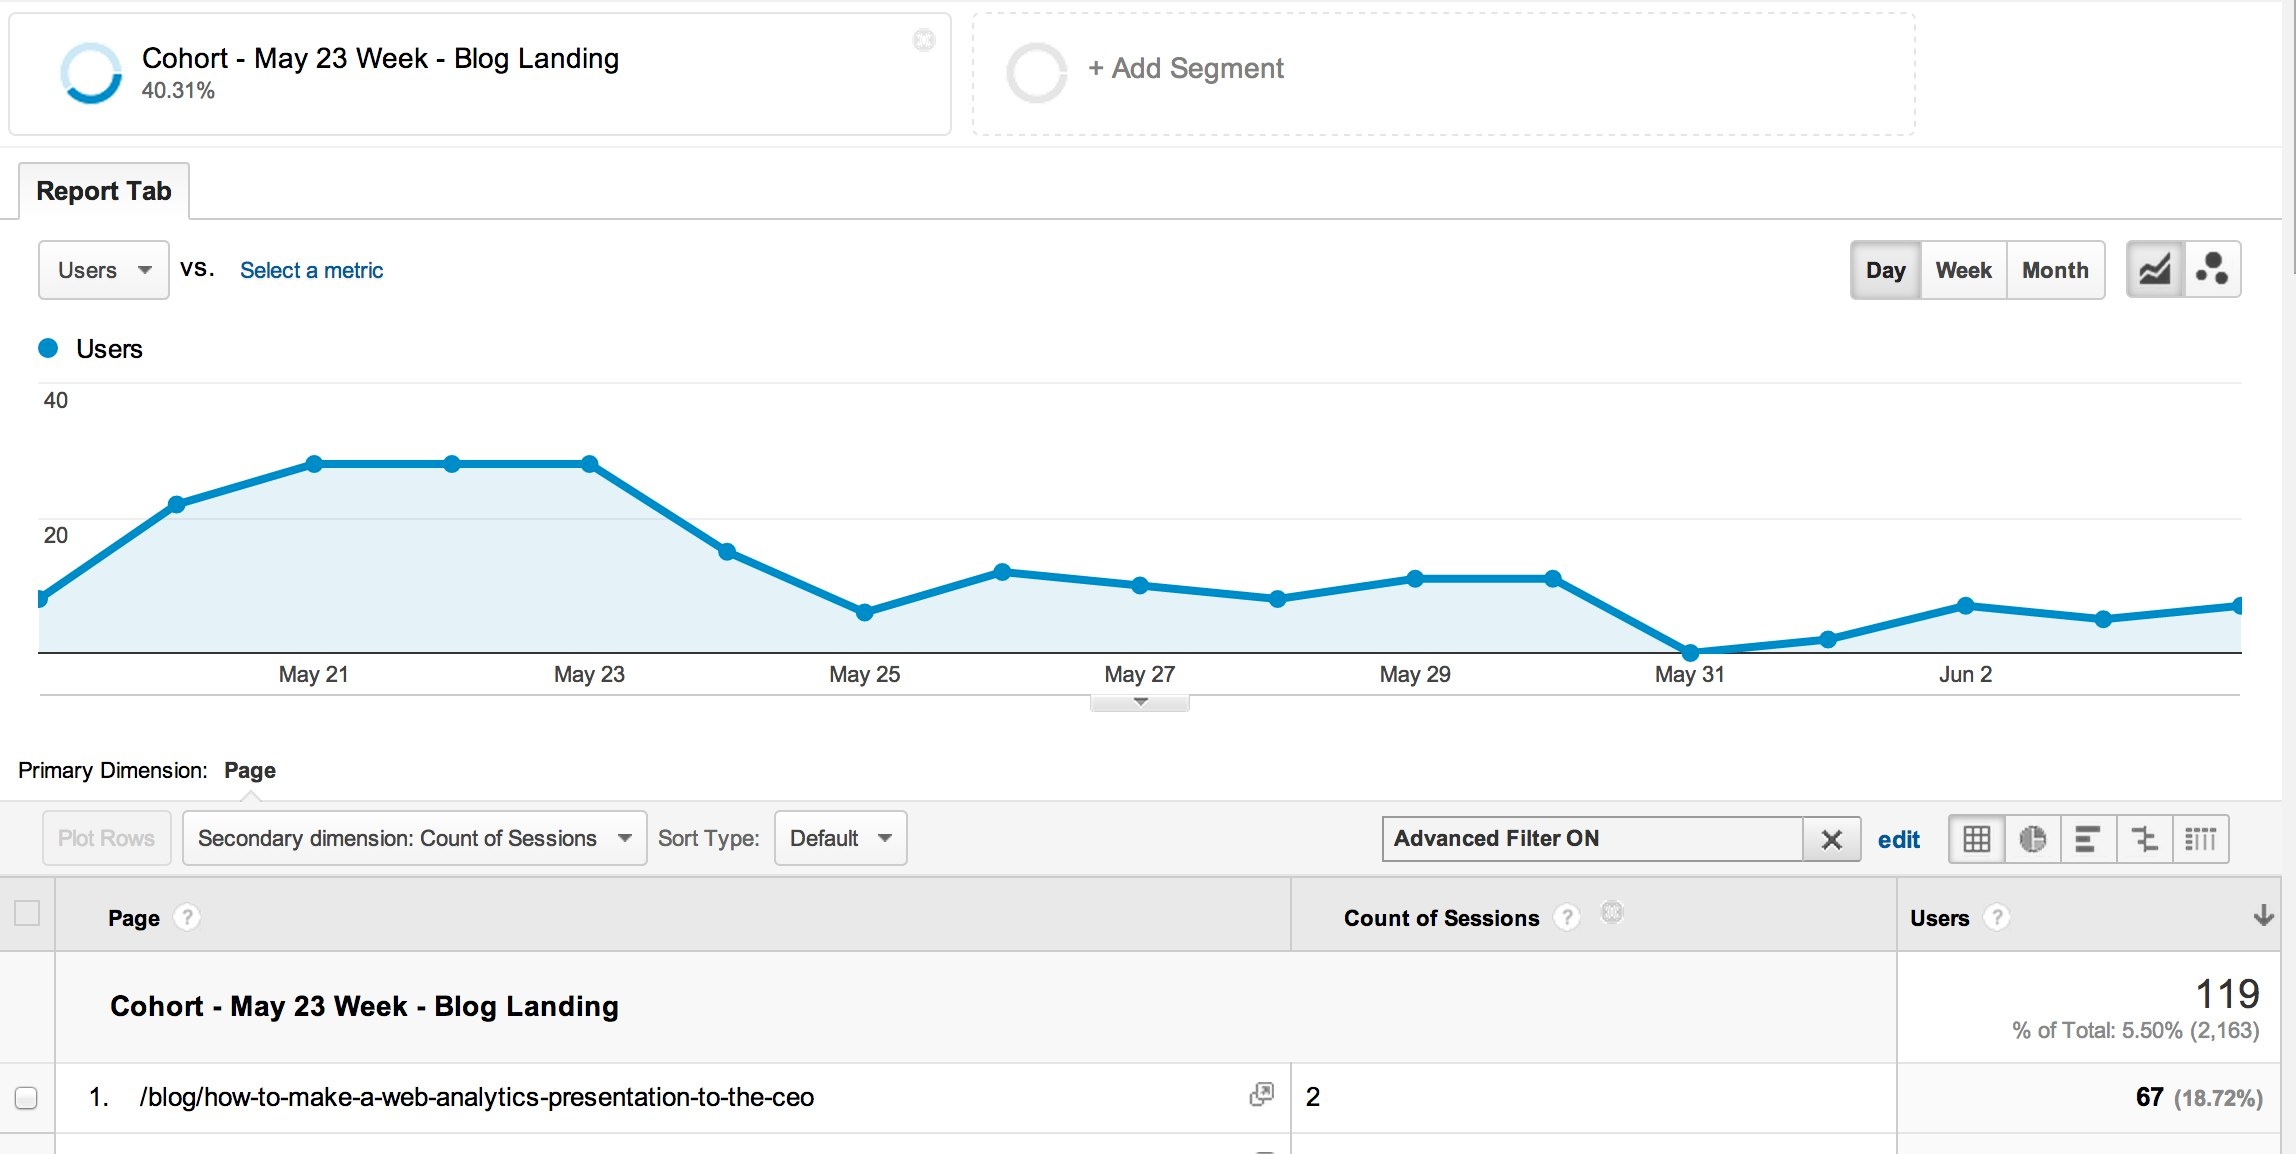
This is like zooming in on the "long tail" we saw in the first report we looked at. The scale is smaller, and now it seems clearer that there are people in this cohort who are steadily coming back. At the bottom right of that image, the top right of the table again shows the total number of Users - 119. That is the number of users in the cohort who made repeat visits.
Looking at that number as a percentage of the total cohort, we see that:
Percentage of Repeat Visitors = 119 / 872 = 13.65%
Conclusions
This post has showed you how we used Cohort Analysis in Google Analytics to measure the success of some blog marketing we did during mid-May. We've tried to explain all the details so that you easily copy these techniques and apply to your own blog marketing efforts.
Once you've mastered the basics of using cohorts, you can start doing even more interesting things. Like understanding the demographics and interests of the repeat visitors. Or zeroing in on the blog content that drives product awareness. That's the information you can use to better target your marketing efforts.
Footnote 1 - Why didn't we do this analysis using Google Analytics Goals?
The Awareness Success Rate analysis described in this post could have been accomplished using Goals. To do that, you would need to define a goal in terms of any visit to a product content page. In the example used here, that could be done with the regular expression for "not a blog page", like this:
^(/[^b]|b[^l]|bl[^o]|blo[^g]|blog[^/])
. Then, you just need to look at the cohort users who completed the goal.
In our case, we didn't have a Goal like that set up during the measurement period. That happens a lot. You only realize what goal you need after the fact. One of the side benefits you might get from this post is realizing that a lot of the analysis done using Goals can also be accomplished with filters and custom reports.