
May 21, 2024
Improving PPC Campaigns With Google Analytics
By Megalytic Staff - August 27, 2014

Setting Up the Data
Before we analyze our PPC traffic in Analytics, we have to make sure it’s been set up correctly and that we’re sending our AdWords data to Analytics. If you haven’t linked your Analytics and AdWords accounts, see the instructions under “Forgetting to Link AdWords” in this article . Note that some people may choose to use manual tagging for ads, but in general, we’d recommend linking accounts so all data comes through accurately tagged via auto-tagging . Linked accounts will be required for the steps we’ll show in this article.
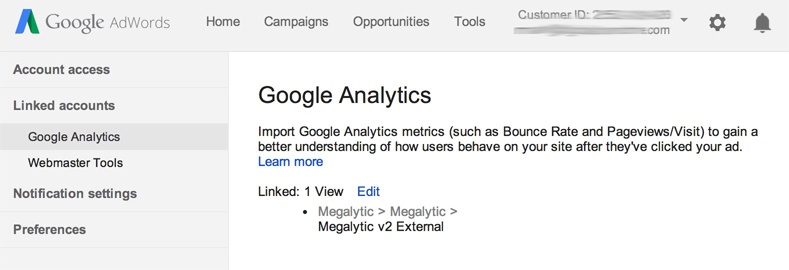
Next, set up your AdWords account to import GA data so you can see statistics like bounce rate right from AdWords. While logged into AdWords, click the gear icon in the upper right, and then select “Account Settings” from the dropdown that appears. Once on the Settings page, click “Linked Accounts” on the left menu and select Google Analytics. From here, choose the Analytics view for which you’d like to import in data.
Once you’ve set up the import process you’ll have the option to add Google Analytics columns when viewing campaigns in AdWords. To see these, select the “Columns” dropdown in Adwords, and click “Google Analytics” to see the relevant columns you can add.
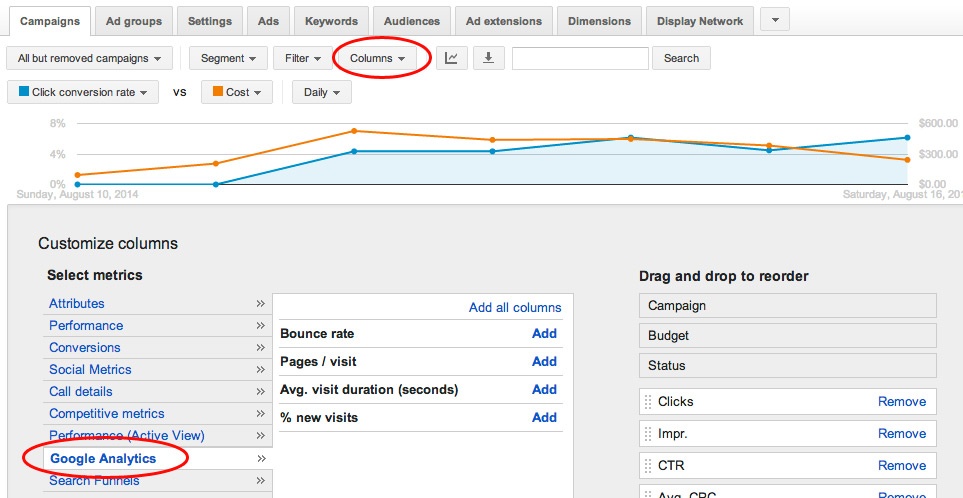
As noted in the screenshot above, you will be able to see bounce rate, pages/visit, average visit duration, and percent of new visits on the level of campaigns, ad groups, ads, or even keywords. Once added, you will be able to see the data alongside clicks, impressions, and all other standard metrics in AdWords. Of course, you can also look at this data in Google Analytics under Acquisition > AdWords, but feeding the info right into AdWords allows you to have the analytics at your fingertips while adjusting your AdWords campaigns.
So once you’ve gotten the setup details out of the way, how can you put the data to practical use?
Ultimately, integrating Analytics data helps you to look beyond ad clicks to understand how PPC visitors are engaging with your website. Stats showing poor engagement can help you to flag site issues you may not see by looking at general stats like clickthrough rate. A high percentage of searchers may be clicking an ad that seems relevant to their query, but they may not be finding what they want once arriving on the site. Looking at data at a high level (campaigns and ad groups) can help you flag areas to look further at data for specific keywords and ads.
Identifying Keyword Improvements
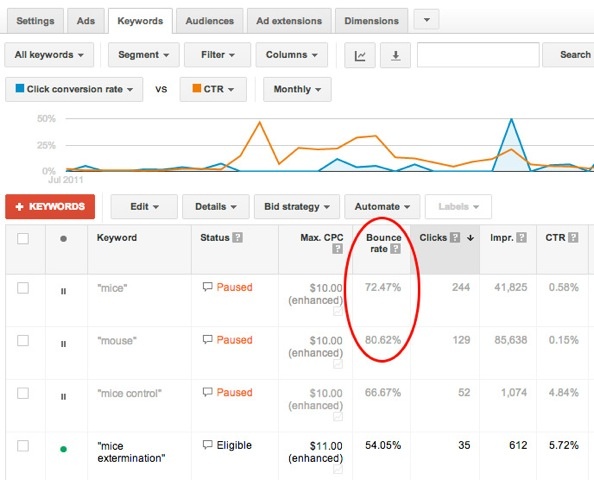
First, look at Google Analytics stats for individual keywords. If you see keywords that show low engagement - exceptionally high bounce rate, low visit duration, or low pages/session - consider modifying your campaigns.
Perhaps you notice a particular keyword is driving in a lot of poorly engaged users. This may cause you to pause that keyword and add more precise keywords to your campaigns. In this example, a pest control company was bidding on general keywords like mice and mouse. These resulted in high bounce rates, as they were matched to phrases like “computer mice” that had nothing to do with getting rid of pesky animals. Bidding on more specific terms like “mice extermination” proved more effective in driving qualified leads to the site.
If you don’t see specific keywords standing out with poor performance and instead see the same engagement issues across the board, you may want to examine your ads and landing pages.
Flagging Issues Beyond the Click
You also want to look for ads that have a high clickthrough rate and decent click volume, but a high bounce rate. Generally, a high clickthrough rate indicates that ad copy and keywords are working well to attract visitors. But a high bounce rate could indicate issues with the pages after users land, especially if you’re seeing low conversions. To improve the bounce rate, think about what the users are expecting to find based on their searches and your ad copy, and whether the landing page(s) meet their expectations.
For example, an online clothing retailer’s ad may mention “blue ties” but land people on a generic homepage instead of on a page specifically displaying blue ties available for sale. As a result, people don’t see the ties they expected to see when clicking the ad, and most will not take the time to filter through inventory to get to blue ties. Instead, they leave. To improve the bounce rate, and ultimately conversions, you would want to change the destination page for this ad to a page actually showing blue ties.
Comparing Performance by Hour
In general, most brands will see performance of ad campaigns vary by day and time. For example, an ecommerce site may see a boost in shopping activity around lunchtime on a workday. Examining performance by time should drive decisions for time-based bid adjustments to focus more spend when people are likely to convert. The Hour of Day report in Analytics allows you to look at performance of AdWords campaigns by time.

To see this report, go to Acquisition > AdWords > Hour of Day. You’ll then see data broken down by hour, with 00 being midnight, 01 being 1:00 AM, etc. In this report, we’ve set the graph to show average conversion rate. The conversion rate drops around 8 a.m. and 4 p.m., likely the times when a majority of the target audience for this site is traveling to and from work. From this data, we should then choose to bid down around 8 a.m. and 4 p.m.
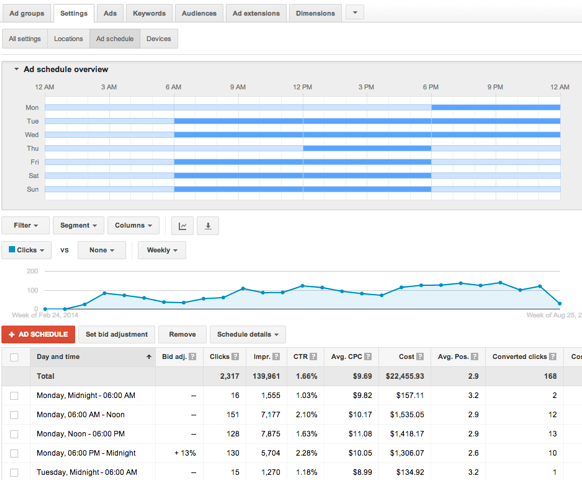
To adjust bids by time in AdWords, go to the Settings tab while viewing the campaign you’d like to edit. Select Ad Schedule from the bar that appears right below the Settings tab. You’ll then find yourself on a screen where you can add blocks of time by hour and day to define when ads will be active and choose to adjust bids by a percentage up or down.
We also learn that the highest converting time is 1 a.m. While a lower amount of visitors arrive on the site at this time, we should not discount their value and should ensure ads will be showing aggressively during this timeframe.
Conclusion
This short post just scratches the surface of how Google Analytics can help inform management of PPC campaigns. If you haven’t been using Analytics to guide decisions in managing AdWords, start by making sure you have accounts linked and data importing properly. Next, review the reports you see to flag ads, keywords, and landing pages you need to edit, as well as reviewing additional factors like hour of day. You’ll soon find the value of Analytics in helping to fine-tune your campaigns.