
May 21, 2024
Identifying & Reporting Facebook KPIs
By Megalytic Staff - May 19, 2016
- Don’t focus solely on one factor; consider multiple metrics together. For instance, likes alone are far from the key to Facebook success.
- Think about how KPIs relate to your overall business goals. While direct conversions are the ultimate goal, Facebook is a prime opportunity for brand exposure and awareness. You want to make sure that people recognize and respect your brand online, and in that vein, willingness to share and engage with your content shows that people are noticing and interacting with your brand.
- Choose KPIs that you can benchmark against over time as they change. Your own historical data is the best place to look in knowing whether the numbers you see correlate to success.
Common Facebook KPIs
Page Likes
While likes certainly don’t tell the whole story of a brand’s social media performance, you should report on your like volume and how it changes over time. Ultimately, likes do correlate to people choosing to follow your brand online, whether they heard about it through a friend on Facebook, an ad, or an offline interaction with the brand. Of course, keep in mind that not every like necessarily belongs to an active Facebook user who cares about your brand. However, overall like numbers, and cumulative likes, point to a general level of interest in your brand.
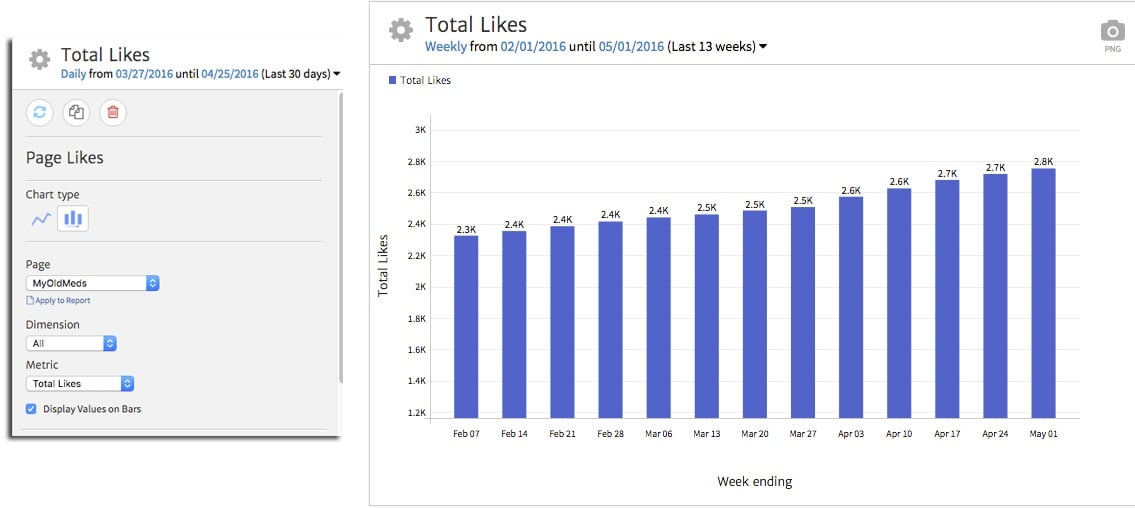
Megalytic’s Page Likes widget allows you to clearly show numbers over time, comparing data to a previous period if you want. For example, here we’ve set up the widget to show weekly likes over the past three months, demonstrating big picture growth over time. We can point out obvious trends, such as the fact that likes in general are increasing, as well as noting when we break thresholds (e.g., the 2,500 likes mark).
Page Reach
Next, Page reach will tell you how many people are actually exposed to your brand’s posts across Facebook. Reach includes not only people who like your page that see posts but anyone who sees posts, whether served via ads or via a friend liking a post.
By looking at total reach, you can determine how effectively your message, and your name, are getting in front of a broader audience online. Since brand posts are hidden frequently, even from the people who like your page, reach provides a more accurate number of how many eyeballs are actually seeing your brand’s stories.
It’s definitely a good idea to show a high level overview of reach over time when presenting performance metrics to your clients. In your Megalytic reports, you can use the Page Reach widget for that purpose. Below, we’ve configured the widget to show weekly reach over the last 13 weeks.
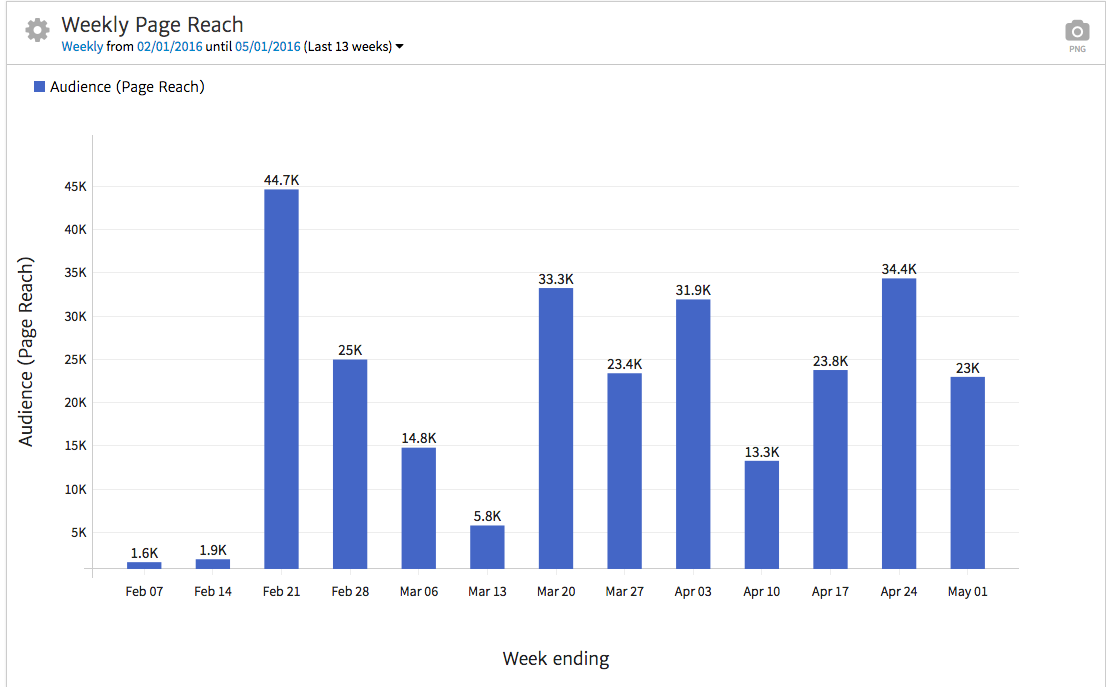
With this, we can point to big picture trends for reach over time, showing maximum and minimum weekly reach for the period. Later in the report, we can dig deeper into what specific posts drove greater reach and how outside factors like advertising contributed. However, the KPI section should focus purely on top level numbers.
Website Traffic from Facebook
If you’re posting links back to your own site on Facebook (which you should be!), one of the most useful measurements for any marketer is assessing how well these posts contribute to overall website traffic. With your Google Analytics account linked, you can use Megalytic’s KPI widget to show your website’s overall traffic and engagement from Facebook.
Choose the Multi KPI widget and select the corresponding Analytics account. By default, we see all data from the account, so we’ll want to add a filter to include only Facebook data.
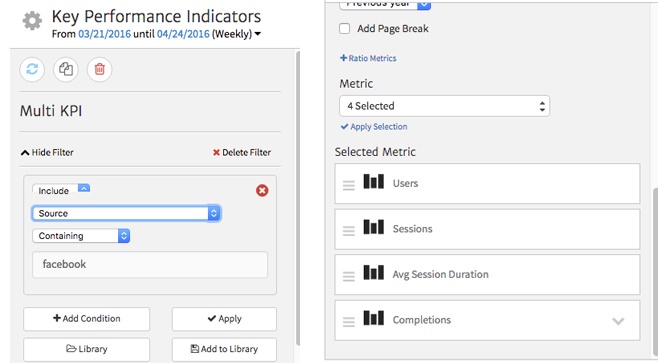
In the widget options, select “Add Filter” and choose Source from the dimension dropdown. Next, type “Facebook” into the text field, so the widget is set to filter “Source containing Facebook.” Finally, choose the four metrics you want to show in the widget.
In this case, we’re showing Users, Sessions, Avg. Session Duration, and Completions. These metrics will prove representative of total traffic, engagement, and lead generation for this site.
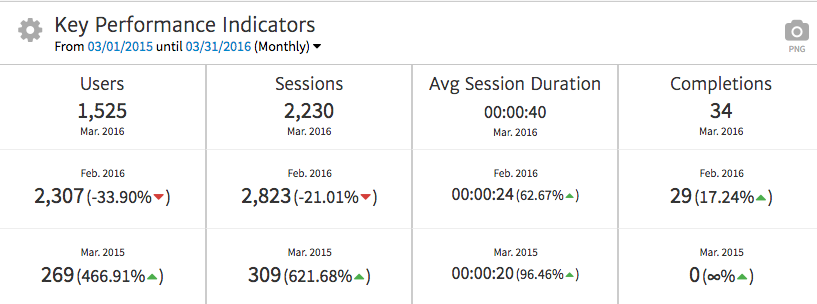
Now, later in the report, we can point to the specific pages on the site where Facebook drove traffic. However, in this portion, we should simply point out high level traffic numbers. Comparing the data to previous periods allows you to show how web traffic from Facebook has gone up or down over time. For instance, in this example, we can see that Completions have increased despite overall traffic going down. Based on this data, we can show that the quality of traffic has increased even though the number of visitors decreased.
Templating Your Report
Once you’ve determined what KPIs you want to focus on, make each of those metrics front and center in your report. You’ll want to maintain a consistent format for reporting and cover KPIs first before delving into more in-depth analysis of metrics.
It’s a good practice to build a template to reuse each time you create monthly or quarterly reports. This template will make your process of building reports simpler while also shaping your clients familiarity and expectations of the content within the reports. You should also add a Notes widget to comment on any major trends you detect from the KPI data. In addition, be sure to define any unfamiliar metrics for your clients.
Megalytic offers an easy way to create a template once you’ve finalized your report format. For more details, see our article on building Google Analytics report templates . Start building your reports for Facebook and create templates customized to each client’s needs.
Conclusion
When building a report for Facebook, start by focusing on the KPIs that matter for your client. To demonstrate value you’ll always need to unite your client’s business goals with measurable online KPIs to correlate online marketing efforts to general business efforts.
Once you’ve established those KPIs, build a report template that you can keep consistent for your client. Reinforce your Facebook marketing efforts by reporting the high-level data that matters to show growth over time, along with the granular content based analysis that contributes to overall performance.
Aside from delivering a report, take the time to go over performance with your client in a conversation, walking them through improvements and areas for growth. Make sure they understand what each KPI means and how it relates to the overall success of the campaign.
Your client knows the numbers, but you know what the numbers represent. From brand reach and visibility to actual clicks and conversions, there can be value to every component. Having the insight to find that value and cultivate its growth is the primary purpose of reporting. Facebook is an excellent platform for storytelling, and the data found there can tell you quite an informative story, too.