
May 21, 2024
How to Create Digital Marketing Reports Your Clients Really Value
By Megalytic Staff - June 03, 2015
- Does this report help my client understand how their website or app performed?
- Does it speak to their business goals?
- Does it identify areas for improvement, as well as successes?

Understand Your Client’s Business
Of course, you can’t offer valuable client reporting without a clear understanding of your client’s business, so immerse yourself in it! Schedule phone or in-person meetings with your client, speaking with people from many different roles within the organization, to learn what they’re trying to accomplish and how they measure success. Are they trying to increase leads for financial consulting services? Are they trying to sell shoes? What is their industry like? Who is their prime customer?
This information will guide you in identifying what data your client will consider most valuable to measuring business success. Ultimately, they care about how much revenue they’re making, so identify the goals most closely tied to revenue. Once again, these goals ultimately come down to either leads or sales.
On the path to achieving these goals, also understand how your client’s potential customers think through the process of choosing to do business. What search terms are most relevant to your client’s business and are crucial to rank for in organic search? What terms are best suited for a paid search campaign? Understanding what search terms relate to your client’s business helps you to report on the visits from users who are most likely to become customers.
What sites do these potential customers use to research your client’s business? By knowing these sites, you can look for them in referrals to show that people from relevant sites are making it to your client’s site.
It’s also important to understand who’s reading your reports. Are you providing a big picture report for the president of the company, or are you reporting to a detail-oriented middle manager who wants to see data broken out on every campaign? Or maybe, will both people be reviewing the report? You wouldn’t explain the process of changing a tire the same way to a mechanic as you would a new driver. Don’t expect to get away with it when reporting for different types of clients and client roles.
Talk directly with your client about the level of data they want to see, while also using your own understanding of the client to guide what you feel most important to show them. They know their own business best, but you know analytics best and how to relate those metrics to their business goals.
Determine the Data that Matters
Once you’ve established an understanding of your client’s business objectives, determine the data that matters to measuring those objectives. This data may include:
- On-site conversion goals (lead form submissions, product purchases, ebook downloads)
- Visitor trends (volume of Sessions and Users over time)
- Engagement trends (Average Session Duration, Bounce Rate, Pages/Session)
After deciding what data is most important to report, determine how you will represent website data in a report . If your client is more detail-oriented, you may want to provide tables full of detailed information. If your client wants more high-level, simple stats, a few carefully-selected data points and graphs will tell the story of website performance.
When showing this data, compare it to previous date ranges (whenever possible) to provide history and context. This will help your client to see whether data has improved or worsened over time and to know whether the site’s performance has been good or bad. In addition, you can point out seasonal trends.
For example, Megalytic’s KPI widget allows you to see data compared to two different time periods. For this particular client, we’re comparing data from April 2015 to both March 2015 (the previous month) and April 2014 (the previous year).
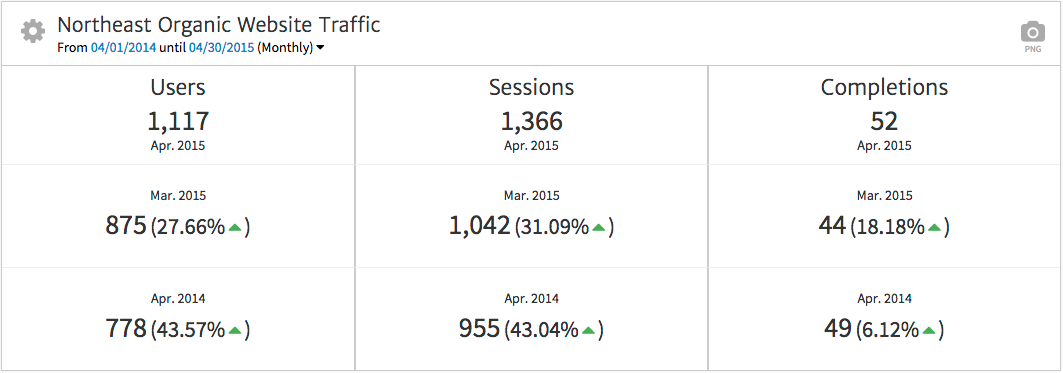
If we were to show just the top row of data (total Users, Sessions and Completions) with no context, our client wouldn’t know whether the data indicates positive or negative trends. However, with historical data included, along with percentages for improvement, we show that statistics have trended upward from both the previous month and the previous year. This provides meaning to the numbers.
Don’t Include Unnecessary Data
When it comes to reporting, you don’t want to include all of the data. You want to include the right data. Too much data can result in confusion over what’s actually important to an account, distracting the client from understanding what matters.
While analytics data is powerful, you can all too easily get carried away in pulling the data you choose to include in a report. For example, if your clients’ have asked about seeing mobile traffic, you could pull a Google Analytics report that breaks mobile usage numbers down to the level of specific mobile devices segmented by operating system.

But, again, just because you can, doesn’t mean you should. This information may be helpful to developers seeking to ensure a site’s compatibility with all mobile users, but this level of detail is not practical for a business owner who just cares about how well his business is reaching the large percentage of consumers on mobile devices. Instead, you should simply show a breakdown of conversions by device.
Megalytic’s Traffic by Platform/Device provides a useful way to show this breakdown. Here, we’ve configured the widget to show total Completions by device category.
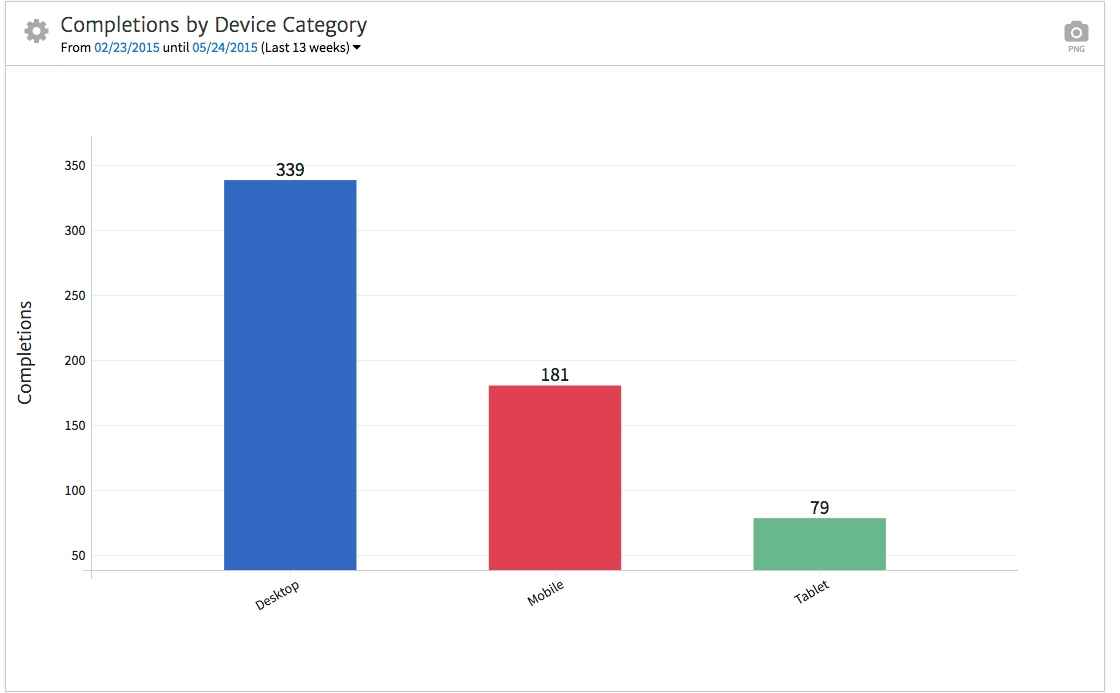
Here, we can see that for this site, desktop drives the majority of conversions, with mobile driving a little over half the number of conversions from desktop, and tablet driving the least. From this data, we can identify that opportunity likely exists to more heavily promote the business specifically to mobile users. Even if a desktop “saturation” point has been reached, you can push ad campaigns more heavily toward mobile, as well as evaluate the mobile experience on the site to improve conversions there.
Provide Action Items
Don’t use monthly reports to just report on the data. Instead, use them to provide action items on how you will move forward with regard to the new insights. For example, in line with the device conversion data shown, you may recommend the client begin utilizing in-app ad placements to boost volume of mobile traffic to landing pages and improve conversions on mobile.
Or, you may be responsible for SEO strategy and notice that search volume has begun to pick up for certain search terms. This is a good opportunity to make recommendations as to how to best optimize the site around those terms. You may recommend creating a page specific to a search term.
Also, provide items that the client needs to act on. Perhaps they need to determine the offer that they’ll be willing to promote in ads once you notice that traffic is picking up in line with seasonal trends.
Conclusion
Providing reports of value to clients involves a process of understanding their business, representing the data that matters to their business goals, and showing how to best act on that data. When you’re able to demonstrate that you know a client’s business and can show data that will matter to your client, they’ll have confidence in your digital marketing strategy based on the reports they see.