
May 21, 2024
How Megalytic Helps our Marketing Succeed at Mercator Media
By Megalytic Staff - December 05, 2016
- a sponsored article about a client’s new product or event published on our news websites;
- a directory entry about a client’s organization with details on their specialty, address, contact details and lots of other useful content;
- jobs published in our jobs section for all relevant positions within our industry;
- a sponsored post on our Social Media channels (Facebook and Twitter);
How we measure success
Our sales team sells a sponsored article to our client, who needs access to our 160,000 member audience. When the sales team talks to our client, they discuss: exposure to a quality audience, new traffic to their websites from different sources (our websites and our social media channels), clicks to their ads, amplification of their marketing message. In other words, they define the client's measures for success, which can be used as the client's KPIs.
In this image below you can see the comparison between the most viewed directory entry vs the paid campaign clients buy from us. The sponsored article has 2,381 views while the most viewed non sponsored article only 173.
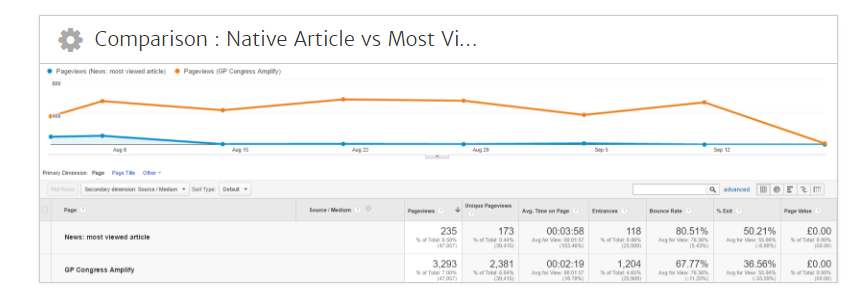
Also, the sales team promises our clients that they will have those results delivered in one single marketing report, that incorporates all traffic sources with relevant stats about the campaigns.
Our sales team and clients can make educated, data-driven decisions quickly
This is when Megalytic comes into the game, it allows me to build these reports pulling stats from different sources. By clearly defining what results constitute a win for the clients, I am able to build reports with Megalytic that allow data-driven decisions both internally and for our clients.
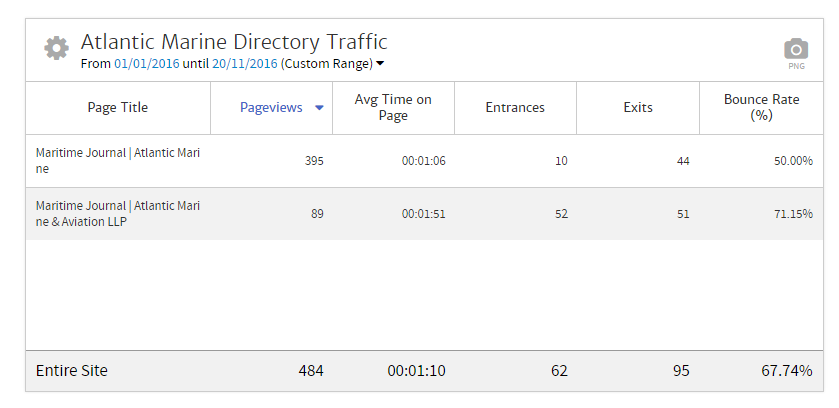
I don’t set a standardized process for all reports because I work with very different clients for very different campaigns as I showed you above. When we hear that a client wants to know how much traffic their directory entry is getting and how it compares to other directories within the website, I just add new Megalytic widget into the report to display this information.
This allows me to define success and when I notice our client is not getting the desired result, I can talk to our sales team to adjust the campaign to drive better traffic.

I can build highly informative multi-channel reports
I believe transparency is very important in our reports. That means there aren't any buzzwords, taglines, or marketing jargon. Instead of focusing on just having our reports look good, we focus on our reports being good, as I have written about extensively in this post : What makes a good digital marketing report? . This means reports have to include lots of different comparisons numbers to give a measure of success to clients. Megalytic allows me to add traffic from different Google Analytics segments:
- Traffic stats for specific pages on our website – the directory spaces;
- Comparison of different directories to show clients the value of our campaigns and how they spend their marketing budget with us;
- Traffic sources from different channels: google organic, direct, bing organic, yahoo, social media, newsletters;
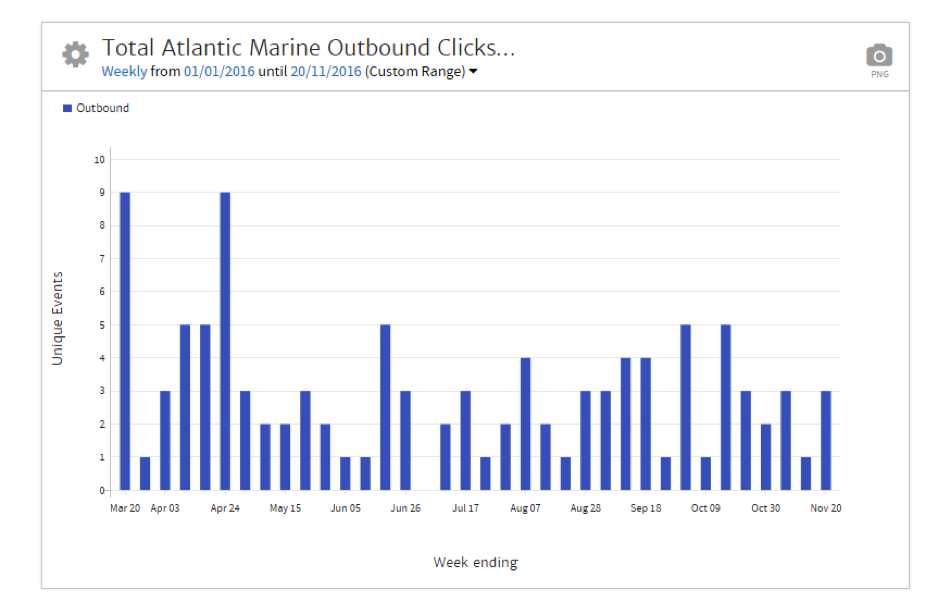
- Outbound clicks to client’s websites. With Google Tag Manager you can set up outbound clicks to client’s URLs and mailto: and then pull the report from Google Analytics into Megalytic;
- Impressions, clicks and shares from Social Media. Megalytic allows you to differentiate paid and organic posts so you visually organize the information.
Also, Megalytic offer different chart types: lines, time series, bar chart, pie chart, table view. I particularly like how the Time Series Bar Chart can be used to visualize traffic trends. This allows me to understand how much traffic clients are receiving to the specific spaces that they purchased.
Multiple marketing channels are supported by plenty of widgets
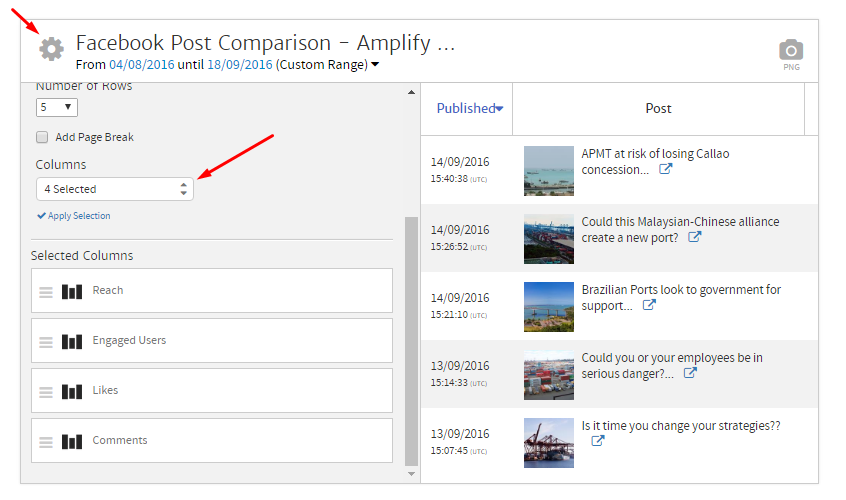
With Megalytic you can compare content within the same Social Media account, for example you can compare which post has the most reach, engaged users, likes and comments all into one nice table, as below.
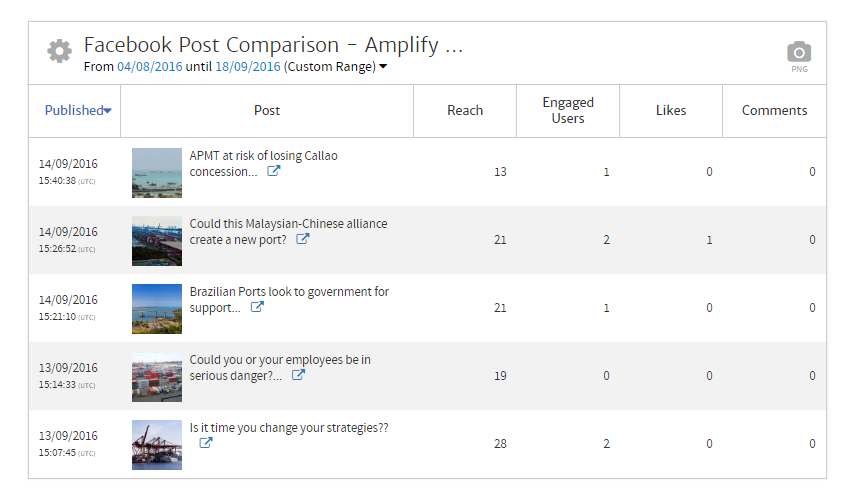
If you are not happy with the number of columns, you can add more by clicking to the “settings” icon top left
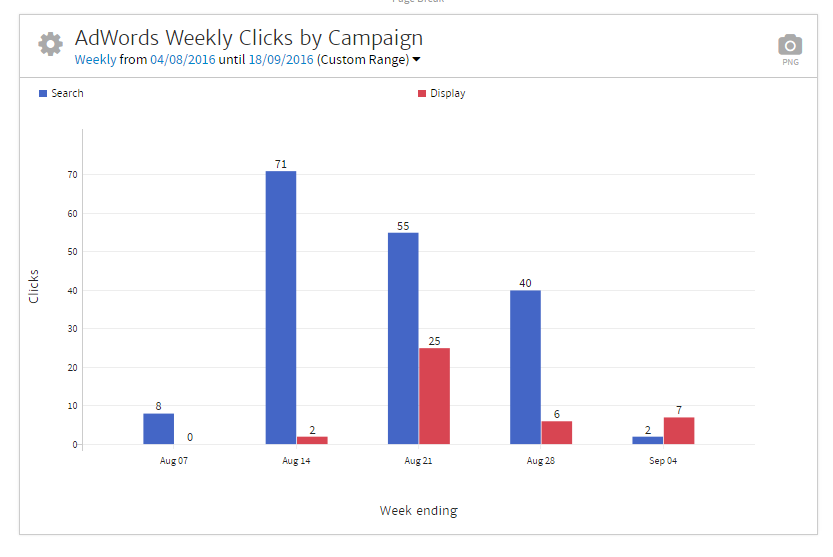
In our campaigns, we also send AdWords traffic to our client’s advertising spaces within our websites. For example, we need to show clients how much traffic we send them from AdWords. Megalytic has got us covered with all sorts of graphs, tables and integrations.
What I find really useful is the distinction between Search and Display campaigns within the same graph:
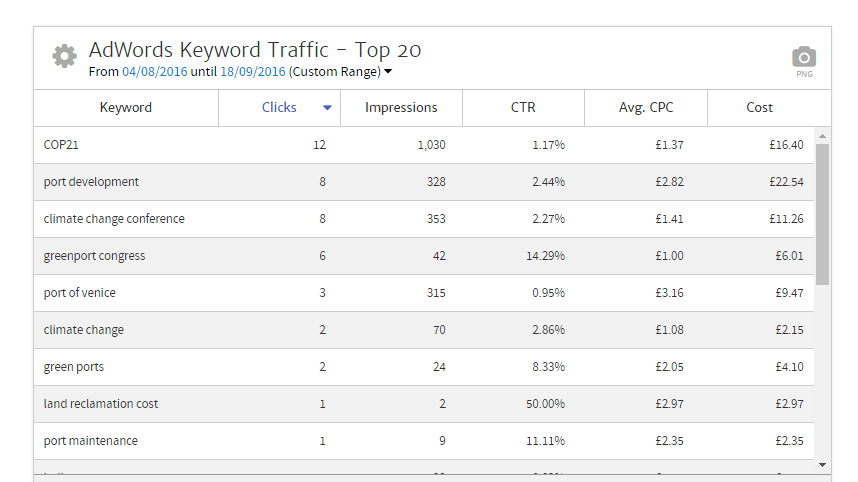
For the most sophisticated clients, we also provide ad-hoc reports on keyword performance that allows us to take decision on which keywords to pause and which to increase traffic from.
Megalytic offers over 100 widgets: AdWords conversions, Facebook likes, posts reach, viral impressions, social referrals, SEO rankings, eCommerce, goals, etc. It’s all there.
Superior technical support
One of the reasons why we have chosen Megalytic over other automated reporting tools is because Mark and his team are so knowledgeable and quick to reply to all sort of questions and fix all sort of issues in a professional manner.
Mark even produced a YouTube video for me to explain some things about Megalytic and I was really impressed by his commitment to make my problem like it was his problem and resolve it quickly.
About the author
 Luca Tagliaferro has over 6 years' experience in digital marketing. He has earned a MA in Digital Marketing from a leading UK University and is currently working for the UK publishing house
Mercator Media Ltd.
leading their new media department.
Luca Tagliaferro has over 6 years' experience in digital marketing. He has earned a MA in Digital Marketing from a leading UK University and is currently working for the UK publishing house
Mercator Media Ltd.
leading their new media department.
[1]
Peter Drucker
, Wikipedia