
May 21, 2024
Google Analytics Report Templates: Examples of Website Data That Matters
By Megalytic Staff - September 28, 2017

Who Is Your Report For?
The first step to building an effective report is knowing what matters most to your audience. No single template is perfect for everyone. Whether you are working in-house or with clients, most of the people you’re reports go to will fall into one of two main groups, each of which is looking to get something different from your analysis.
High-level Thinkers
Looking for:
Big picture only
. These busy individuals often look at web analytics reports only to know if the business is growing.
Marketing Teams
Looking for:
The next big idea. Marketing teams may be a bit more digital savvy and want deeper insights to help build strategy and plan new initiatives.
Building reports for each of these groups might be a little different. In this post, we will cover some template ideas for each group.
What’s Your Time Frame?
Another important factor for designing report templates is to consider variable time frames. For example, some common time frames include:
- Monthly
- Quarterly
- Annually
Each one of these may dictate what content you include in the report. A monthly report template may be more succinct, while a quarterly or annual report may require a deeper dive and more graphs or data. The insight you can achieve from the behaviors of a larger sample group over a longer period of time may be a more accurate indicator of patterns and trends. So the templates you build for monthly reports may be shorter than the reports you generate for a yearly campaign report. For the purposes of this post we’ll focus on monthly reports with some suggestions for longer timeframes.

Key Performance Indicators (KPIs)
One of the first things you’ll want to build into any GA template is an overall shot of KPIs. These are metrics that belong in a website traffic report for any audience. Both executives and marketing teams will want to know and may include metrics like:
Sessions
– How many total sessions occurred on the website?
Users
– How many site visits were made by new users vs. repeat users?
Average Session Duration
– How long on average did users spend on the site?
Conversions
– How many interactions that are being tracked as goals occurred on the site?
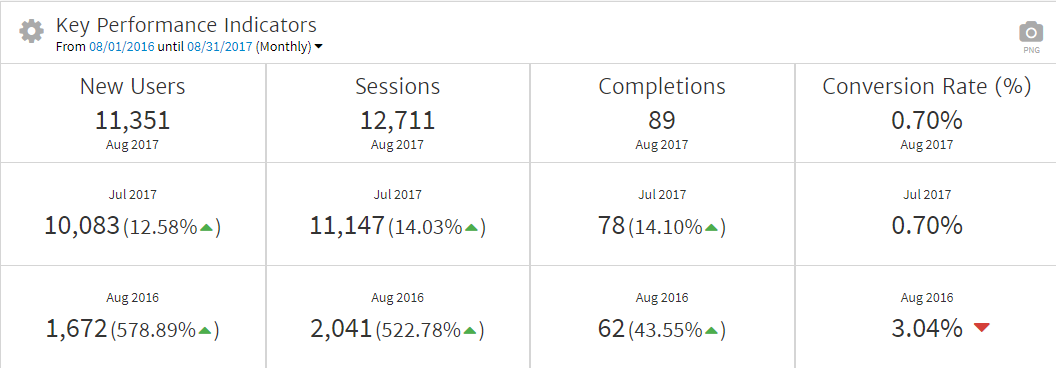
It’s also important to provide context with these KPIs. In a vacuum, these numbers may not reveal growth or decline. However, in analysis and reporting, when they are compared with the same data from the previous month or previous year it provides a clearer picture of which direction these metrics are moving.
More Conversion Data
Conversions or completions are often the metrics that are most directly tied to revenue or lead gen, so this is an extremely important metric and may be the only KPI that a busy executive really cares about. For that reason, you may also want to highlight completion related metrics to understand where conversions are coming from.
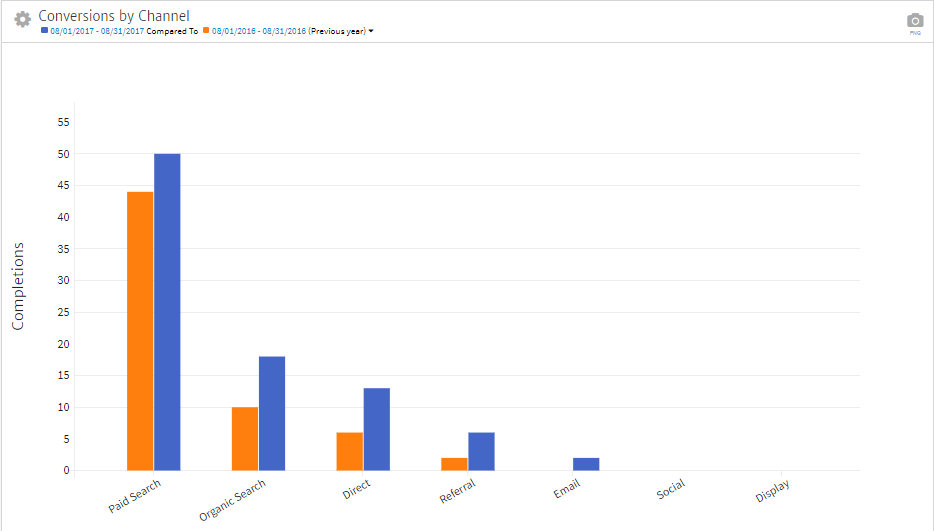
Some ways to look at this include:
Conversions by Channel – Which channels contribute the most in terms of quantity and conversion rate to new leads or sales. That breakdown can help drive investments in channel-based efforts.
Top Converting Pages –Looking at the top converting pages can help identify points, like where the messaging is most compelling or which call to actions (CTAs) are performing. It can highlight underperforming pages and pathways.
Reverse Goal Funnel – The reverse goal funnel is another opportunity to identify which pages users may not have entered through, but passed through on their way to completing a goal. This can also help refine CTA positioning, messaging and internal linking strategy.
Assisted Conversions – We’ve written in-depth about assisted conversions before. But essentially they can help illustrate when one channel made the introduction, but another channel resulted in the conversion. This report helps show where the first contact was made, showing how other channels influenced the final result.
Conversions by Geographic Area – This is most relevant to businesses that target a specific geographical market, but it can really help inform any business. Knowing where your conversions are coming from can help drive important decisions like product offerings or branch expansions that matter to a CEO. It can also help marketers understand where to geographically target or even where traditional media efforts could be intensified.
The theme here is that for any report, there are good reasons to examine conversion-based data from every angle, and so your website reporting template should include them. This data, and the insights it contains, can be relevant to all audiences because it has the most influence on revenue.
Active Campaigns
Next, an ideal Google Analytics reporting template also takes into account the ways you’ve allocated your digital marketing hours or spend. In all cases, the different channels being used should be individually featured based on some of the most indicative metrics associated with each.
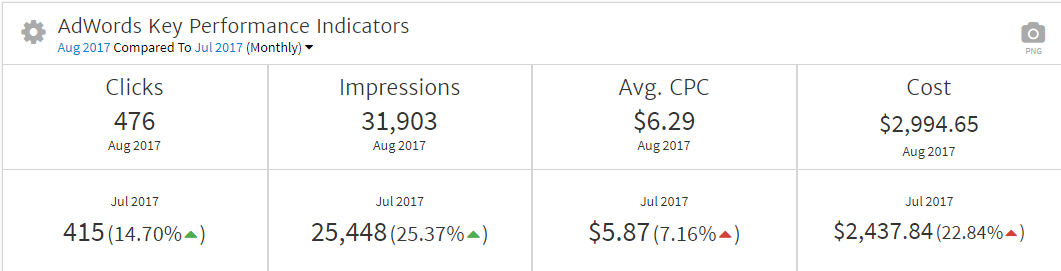
For example:
Paid – When a paid campaign is active, in addition to the conversion and KPI data laid out, a report template should feature information on spend efficiency and visibility. This relates to figures like cost-per-click and cost-per-conversion. This should also include conversion rates, click volume and rates, and overall impressions. It’s also worth showing how various ad groups and campaigns perform compared to one another. For example, a remarketing campaign next to a search campaign may show a lower volume of total conversions but at a much higher rate.
Organic – If SEO is an ongoing function, then KPI and conversion data should be segmented by Organic to show data specifically relevant to that channel. Reports for campaigns with a heavy SEO component might also contain rankings data and keywords driving clicks derived from Search Console.
Social – While some social media efforts may also overlap with paid initiatives, even time spent making organic posts or having interactions cost money in resource allocations. With this in mind, it’s important to show metrics associated with the efforts that help validate their ROI, or suggest that engagement, as it stands, is not working well and the content strategy may need modification.
Email – Email marketing can be an extremely effective way to drive users to a website to take specific actions. With proper tracking, these campaigns can be isolated and assessed with regard to their success rate. The details surrounding each campaign can be studied to identify common factors that worked well in order to replicate them.
There are obviously other channels associated with referrals, direct traffic or even organic branded vs. non-branded traffic that can be evaluated more granularly. The overall goal for a template should be to include breakdowns with specific data for any channel that is actively being used to generate traffic and business.
Conclusion
There is no one-size-fits-all Google Analytics reporting template that is right for everyone, in every situation. However, for a strong foundation, you can tailor your template to your audience, focus on KPIs and revenue related data, and highlight metrics for individual channels. It may take some trial and error to find the best mix for your clients or team but reports, like websites, should always continue to evolve. And, if you’re really pressed for time or ideas, there’s always Megalytic where we’ve got ready-to-report templates waiting for you now.