
May 21, 2024
Google Analytics Exports: Options & Strategies
By Megalytic Staff - December 01, 2016
Google Analytics Export Options
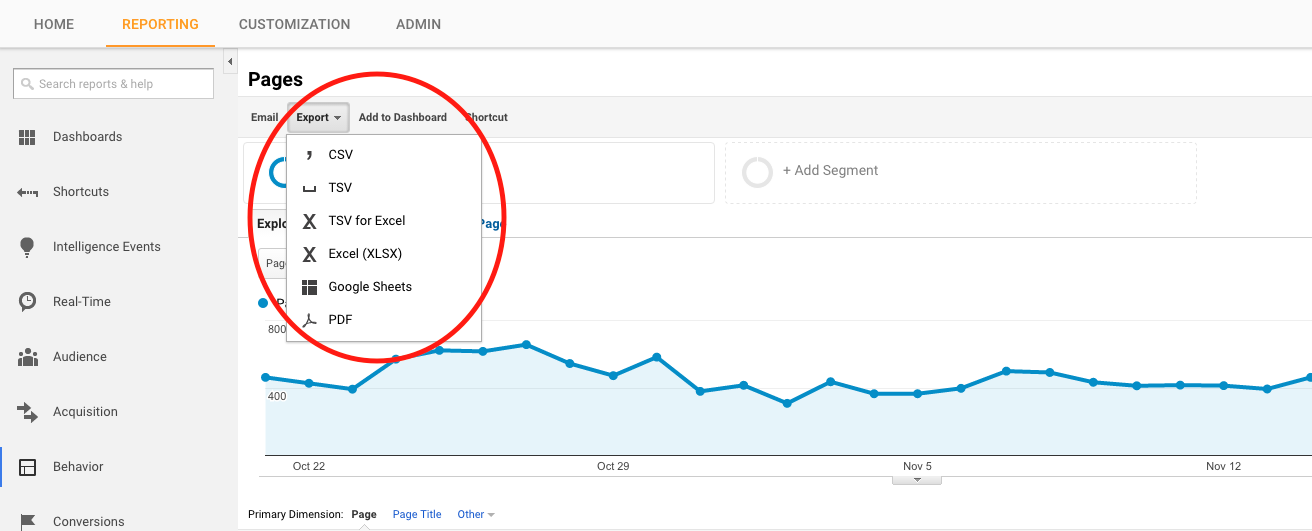
You can export from just about any reporting view within Google Analytics (excluding Real-Time reports). When viewing a report, select the “Export” button right above the graph. Next, choose your desired file type from CSV, TSV, TSV for Excel, Excel (XLSX), Google Sheets, and PDF. You may want a spreadsheet for deeper analysis or a PDF to quickly share top-level data with a client or agency team.
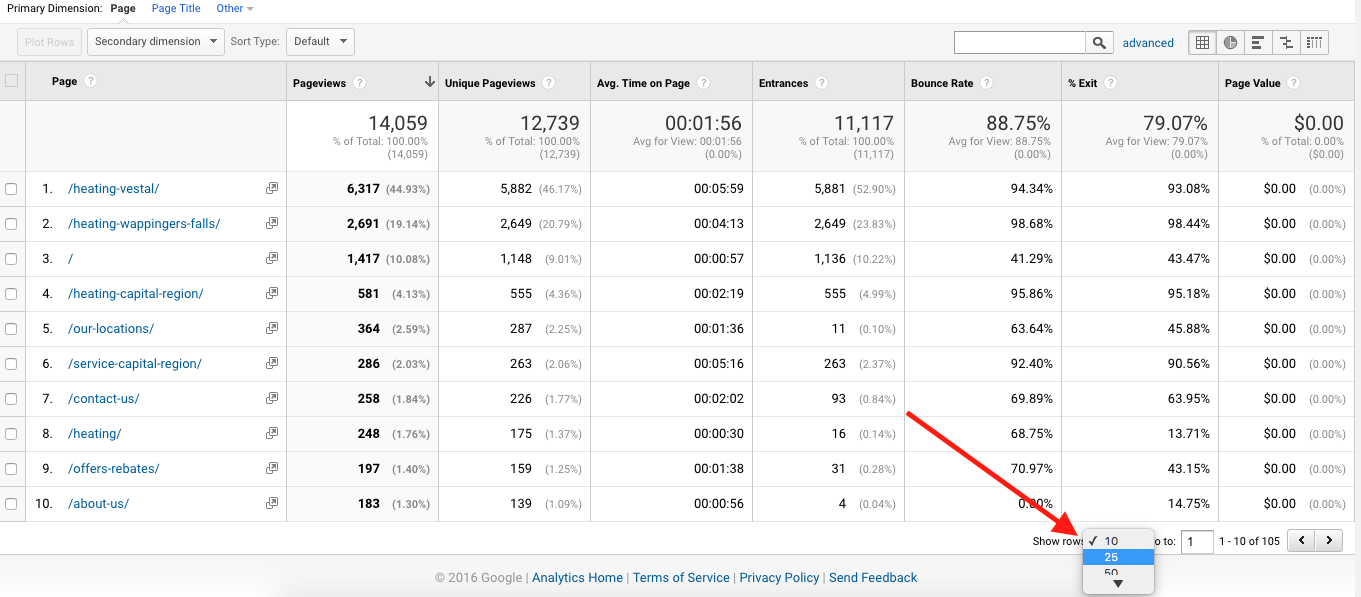
There are a few technical concerns to be aware of, with data exports. First, when exporting data in any format, you’ll only get as many rows in your document as you have chosen to show in the interface. By default, reports show only 10 rows of data. If you have more than 10 pages on your site and want to download full pageview data, you’ll need to show more rows.
Scroll to the bottom of the window and use the selector after “Show Rows” to choose how many rows you want to show. Once applying this, you can now export the report for a complete list of page data.
Next, note that any Segments applied to your current view will apply to the data you export. For instance, if you’ve applied an Organic Segment, your final export will include only data from organic search. In addition, if you’ve applied secondary dimensions (such as showing a Source/Medium breakdown in an All Pages report), you’ll see that data in the final downloaded document. That may be exactly what you want, but if you want to look beyond your segment remember to reset to All Users or a different segment before you export.
Finally, when exporting a PDF you’ll see the data in whatever format it shows up on the page - including the graph types you’ve chosen. For instance, if you’ve chosen to show a pie chart instead of a table, the final PDF will show a pie chart.
Now, let’s get into some tips and strategies for using exported data from Google Analytics.
Showing Time Period Breakdowns
When downloading an Excel document from a report, you’ll see one sheet with a breakdown of whatever data appears in the table for the report. For instance, the Channels report, this will contain rows showing channels and metrics for each.
You’ll also see another sheet showing indexed data from the graph above the report which correlates to the metric and unit of time chosen. For instance, if the graph shows Sessions by day, you’ll see rows showing the number of Sessions for each day within the timeframe selected in your report.
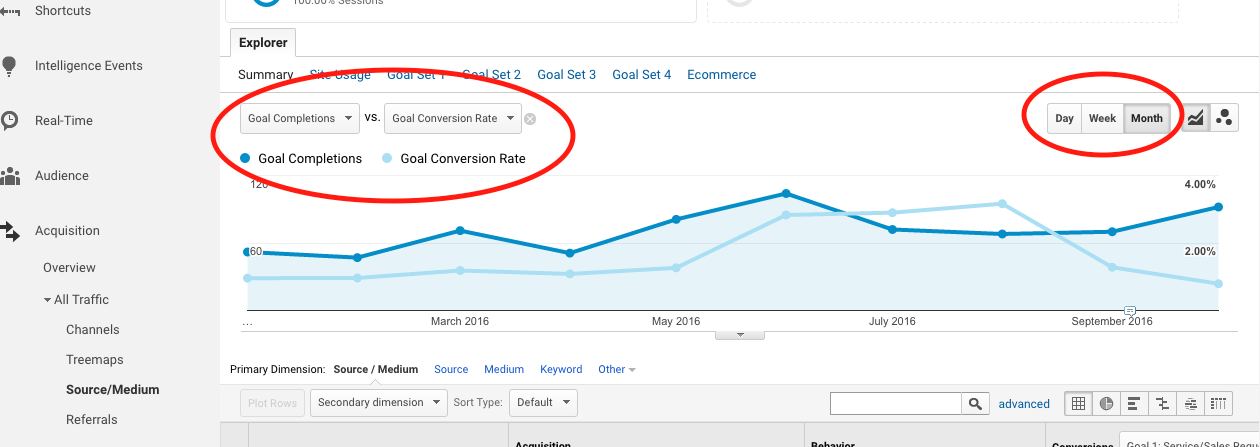
By customizing the graph, you can tailor the data you receive in your final downloaded file. Say you want to look at how total conversions and conversion rate have trended by month. First, choose your timeframe from the data selector. Then use the graph selectors to choose Goal Completions and Goal Conversion Rate. Finally, set the unit of time on the right to Monthly. Your final exported spreadsheet will contain a table showing this data by month.
Bear in mind, however, that while exporting data into spreadsheets allows you to isolate and coordinate data in a more versatile format, time period comparisons may be less visually impactful than the dashboard or the PDF export
Evaluating the Reverse Goal Path
Exporting data to spreadsheets allows you to fully analyze the pages that led users to conversion. While looking at the final page before conversion can help to indicate what product or service pages were most likely to spur leads, these don’t tell the full story. Especially on larger sites, you want to look at the multiple steps users took to get to the point of submitting a lead. If a lead happens on a generic Contact Us page, that page obviously will show a high volume of submissions. So you will want to look at the pages viewed right before viewing the contact page.
Thankfully, the Reverse Goal Path report (Conversion > Goals > Reverse Goal Path) can show you up to the last 3 pages that users viewed before the point of conversion. By downloading this into a spreadsheet, you can sort through the columns to find key pages. You’ll want to look at which pages appear most frequently overall in these steps to conversion, as well as those that appear most often as the last step before a conversion. With this insight, you can begin to identify which pages are most likely to precede a conversion and effectively factor those into your user pathways.
Aggregating with non-Google Analytics Data
When reporting for clients, you may sometimes want to include data that is not accessible within Google Analytics itself. For example, a lead generation site may track form submissions as conversions but won’t show which of those conversions resulted in actual business.
By downloading a spreadsheet of conversion data, you can show this side by side with an additional column showing how many leads actually turned into paying clients. When reporting in a tool like Megalytic, you can upload this data into a custom CSV widget to show right in client reports.

Storing Search Console Data
While Google shares organic search query data via Search Console, this data is limited to the previous 90 days. Once you’ve gone past this time period, you have no way to access historical data.
Thankfully, data exports allow you to easily store this data in spreadsheets. Use the Acquisition > Search Console > Queries report to export search information for future reference. You can now aggregate documents to build up search query data over longer periods of time. When you have archived historical data, you can then use that as a baseline comparison against new data to show change over time.
Automating Exports to Google Sheets
While Excel documents are great for one-off analysis, long-term storage of data is best in a cloud-based format, like Google Sheets. Thankfully, automatic integration is available.
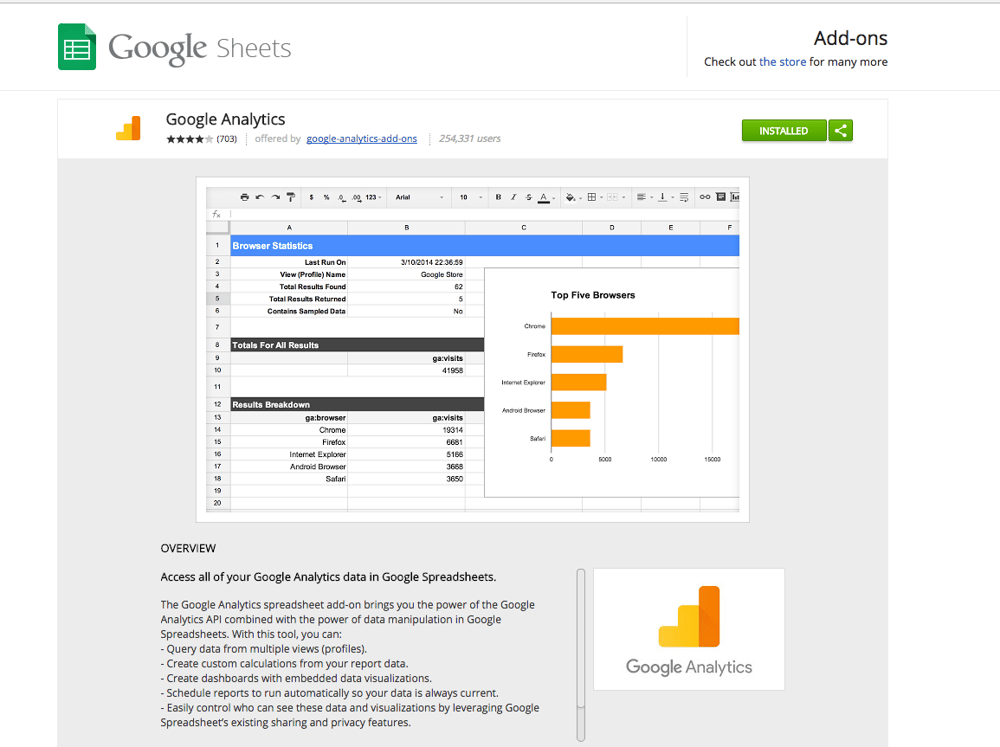
To quickly store data from multiple periods in an accessible place, you can configure Google Analytics to automatically export to Google Sheets. While development knowledge can allow for more advanced configurations, you can install the free Google Analytics/Google Sheets add-on . With this, you can automatically schedule data to go into spreadsheets, pulling the metrics you want and showing correlating graphs. You can also create customized dashboards; see the add-on’s documentation for more details.

Conclusion
Google Analytics exports offer a world of opportunities for digital marketers to better analyze and report on website performance data. Take some time to download a few exports from your Google Analytics accounts and experiment with different configurations to see how you can customize the data to emphasize the results of your work. You may find this option provides a valuable enhancement to the reports available in the web interface. As with everything when it comes to reporting to clients, going the extra mile to offer deeper analysis will help strengthen your relationship with your clients and deepen your ability to provide meaningful insights.