
May 21, 2024
Facebook Reporting Changes: Megalytic Updates from 2016
By Megalytic Staff - December 08, 2016
Integrating Megalytic with Facebook
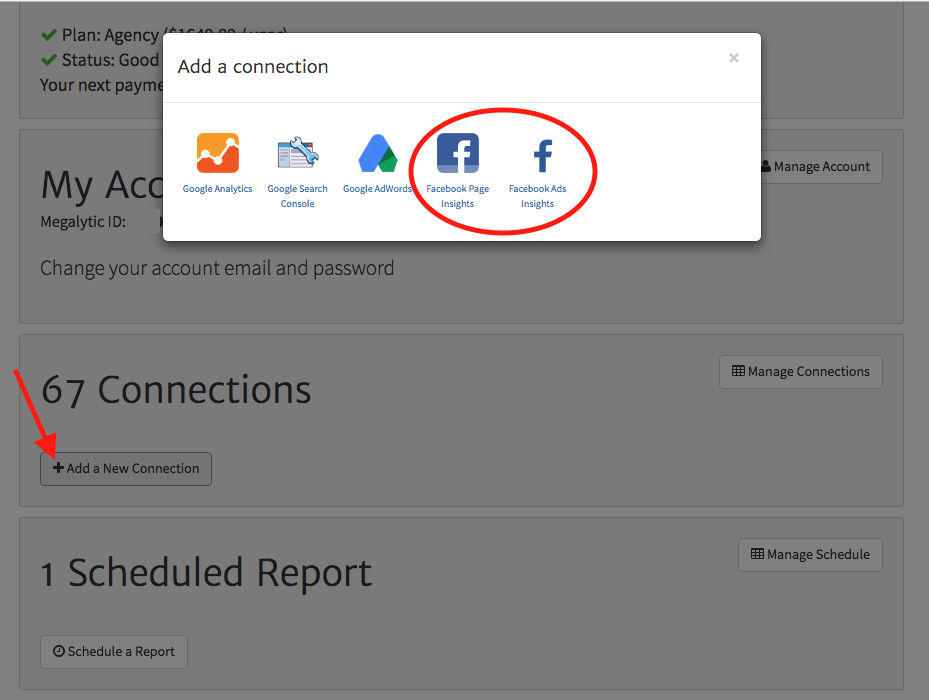
In order to integrate your Megalytic reports with Facebook, first make sure you’re logged into the Facebook account connected with the page(s) or ad account(s) you want to add. Navigate to the “Manage” page in your account. Scroll to the Connections box and select “Add a New Connection.” In the box that appears, you can choose from Facebook Page Insights or Facebook Ads Insights.
After selecting one of these, you’ll see a request to authorize connecting your Facebook account. You’ll authorize your account and then, if you have access to multiple pages/ad accounts, see a list of the ones connected to your account. Check the boxes for any you want to add and click “Connect.” Now, you’ll be able to access your new connections in report widgets.
Reporting on Facebook Page Insights
Insights allow you to uncover a wealth of data about how successfully you’ve reached your target audience on Facebook. In turn, reporting on this data can help to prove the value of your social efforts.
Facebook Page Insights integration includes six different widgets:
- Page Likes
- Posts Published
- Page Impressions
- Page Reach
- Page KPI
- Page Multi KPI
With these widgets, you can report comprehensively on who liked your page, who saw posts, and how page performance has changed over time. Whether you’re managing social media on an ongoing basis for a client or running a one-time promotion around an event, you can easily present data for your desired timeframe.
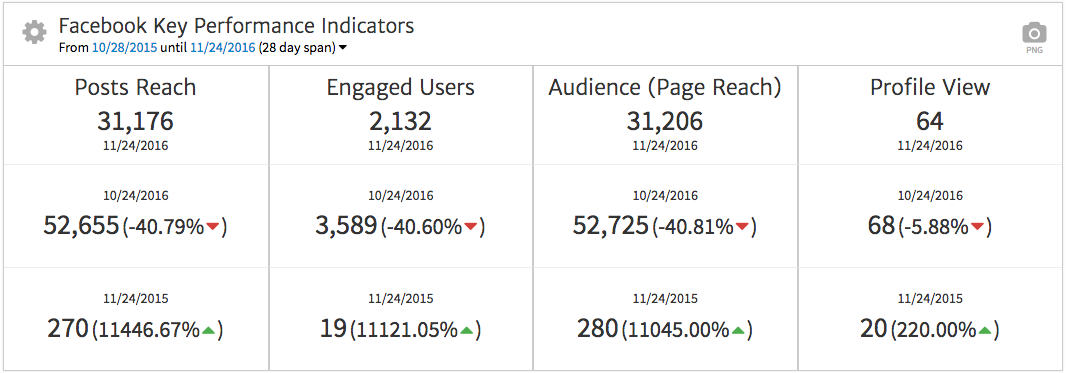
To start your report, you can highlight top-level performance using the KPI widgets. These can include comparisons on a daily, 7-day, or 28-day level. For instance, the Multi KPI widget below shows performance for the last 28 days, compared with the previous period and the previous year.
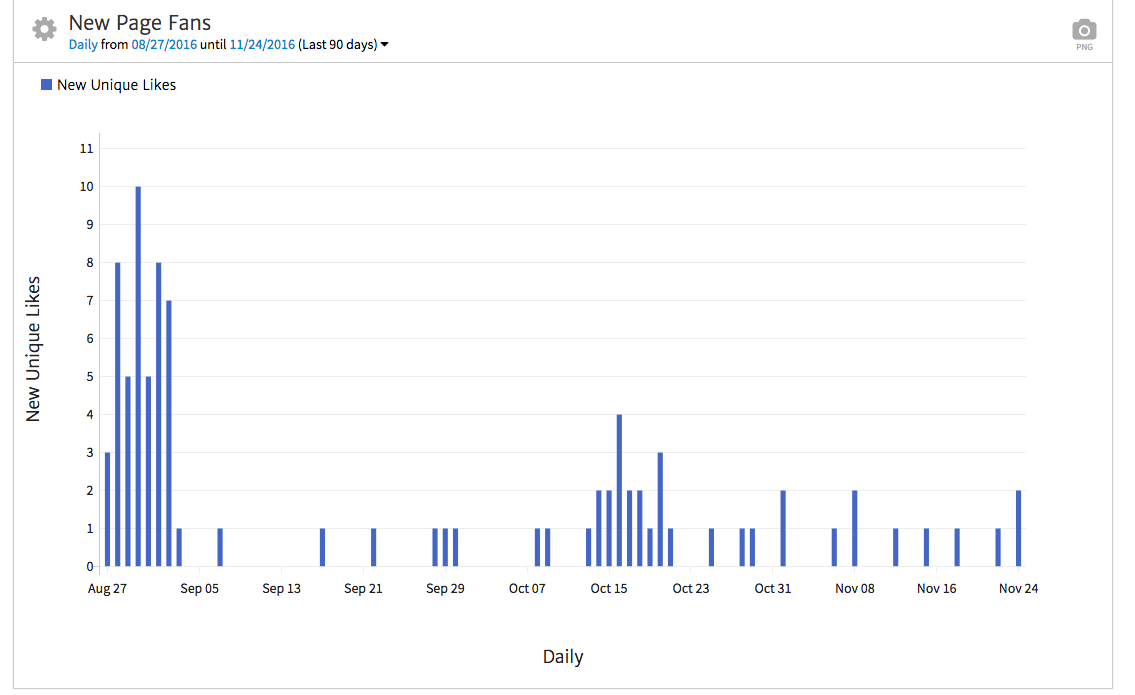
Next, you can use bar or line graphs to show performance over a period of time, demonstrating trends of growth or shrinkage. For instance, you may want to show how likes have grown in volume or frequency and highlight which periods were especially high performing. We’ve configured the Page Likes widget below with a bar chart showing daily likes over the last 90 days.
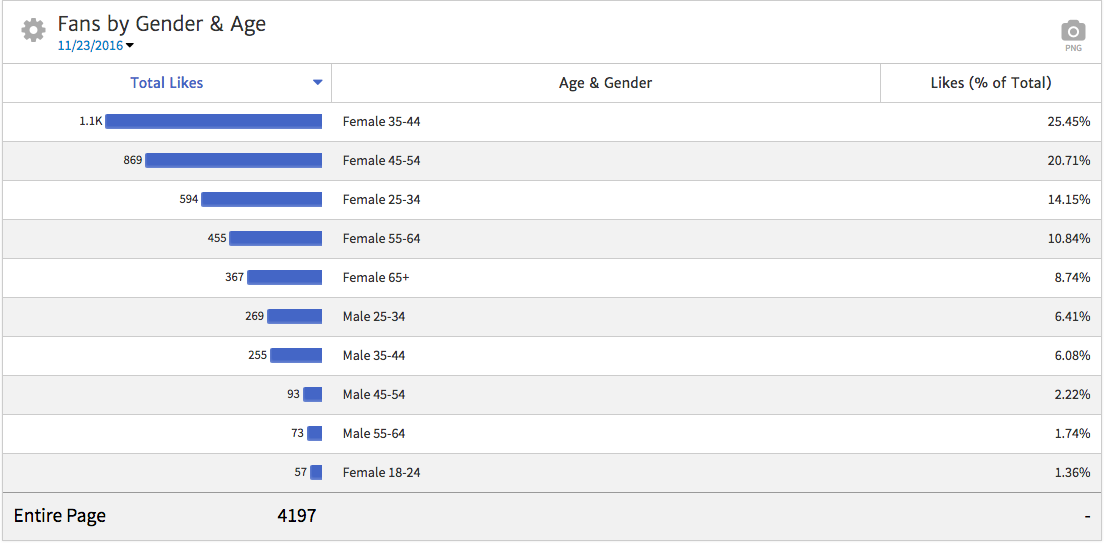
To delve more deeply into the demographic buildup of your fan base, you can configure the same widget to show breakdowns by age, gender, and geography. This data can help determine if you’re reaching the intended audience or seeing interest from an audience you didn’t initially expect.
In the example below, we use a table graph to show likes by gender and age categories. We can note that women by far make up the largest demographic, particularly in the 35-44 age range.
In addition to likes , you should also by monitoring reach , noting how many people are exposed to your posts. Remember though, your reach data can vary widely from data on those who like your page.
Many of the people who see your posts via ads, their friends’ interaction, and other factors are outside of the audience who like your page. In addition, many of the people who like your page may not actually be seeing your posts.
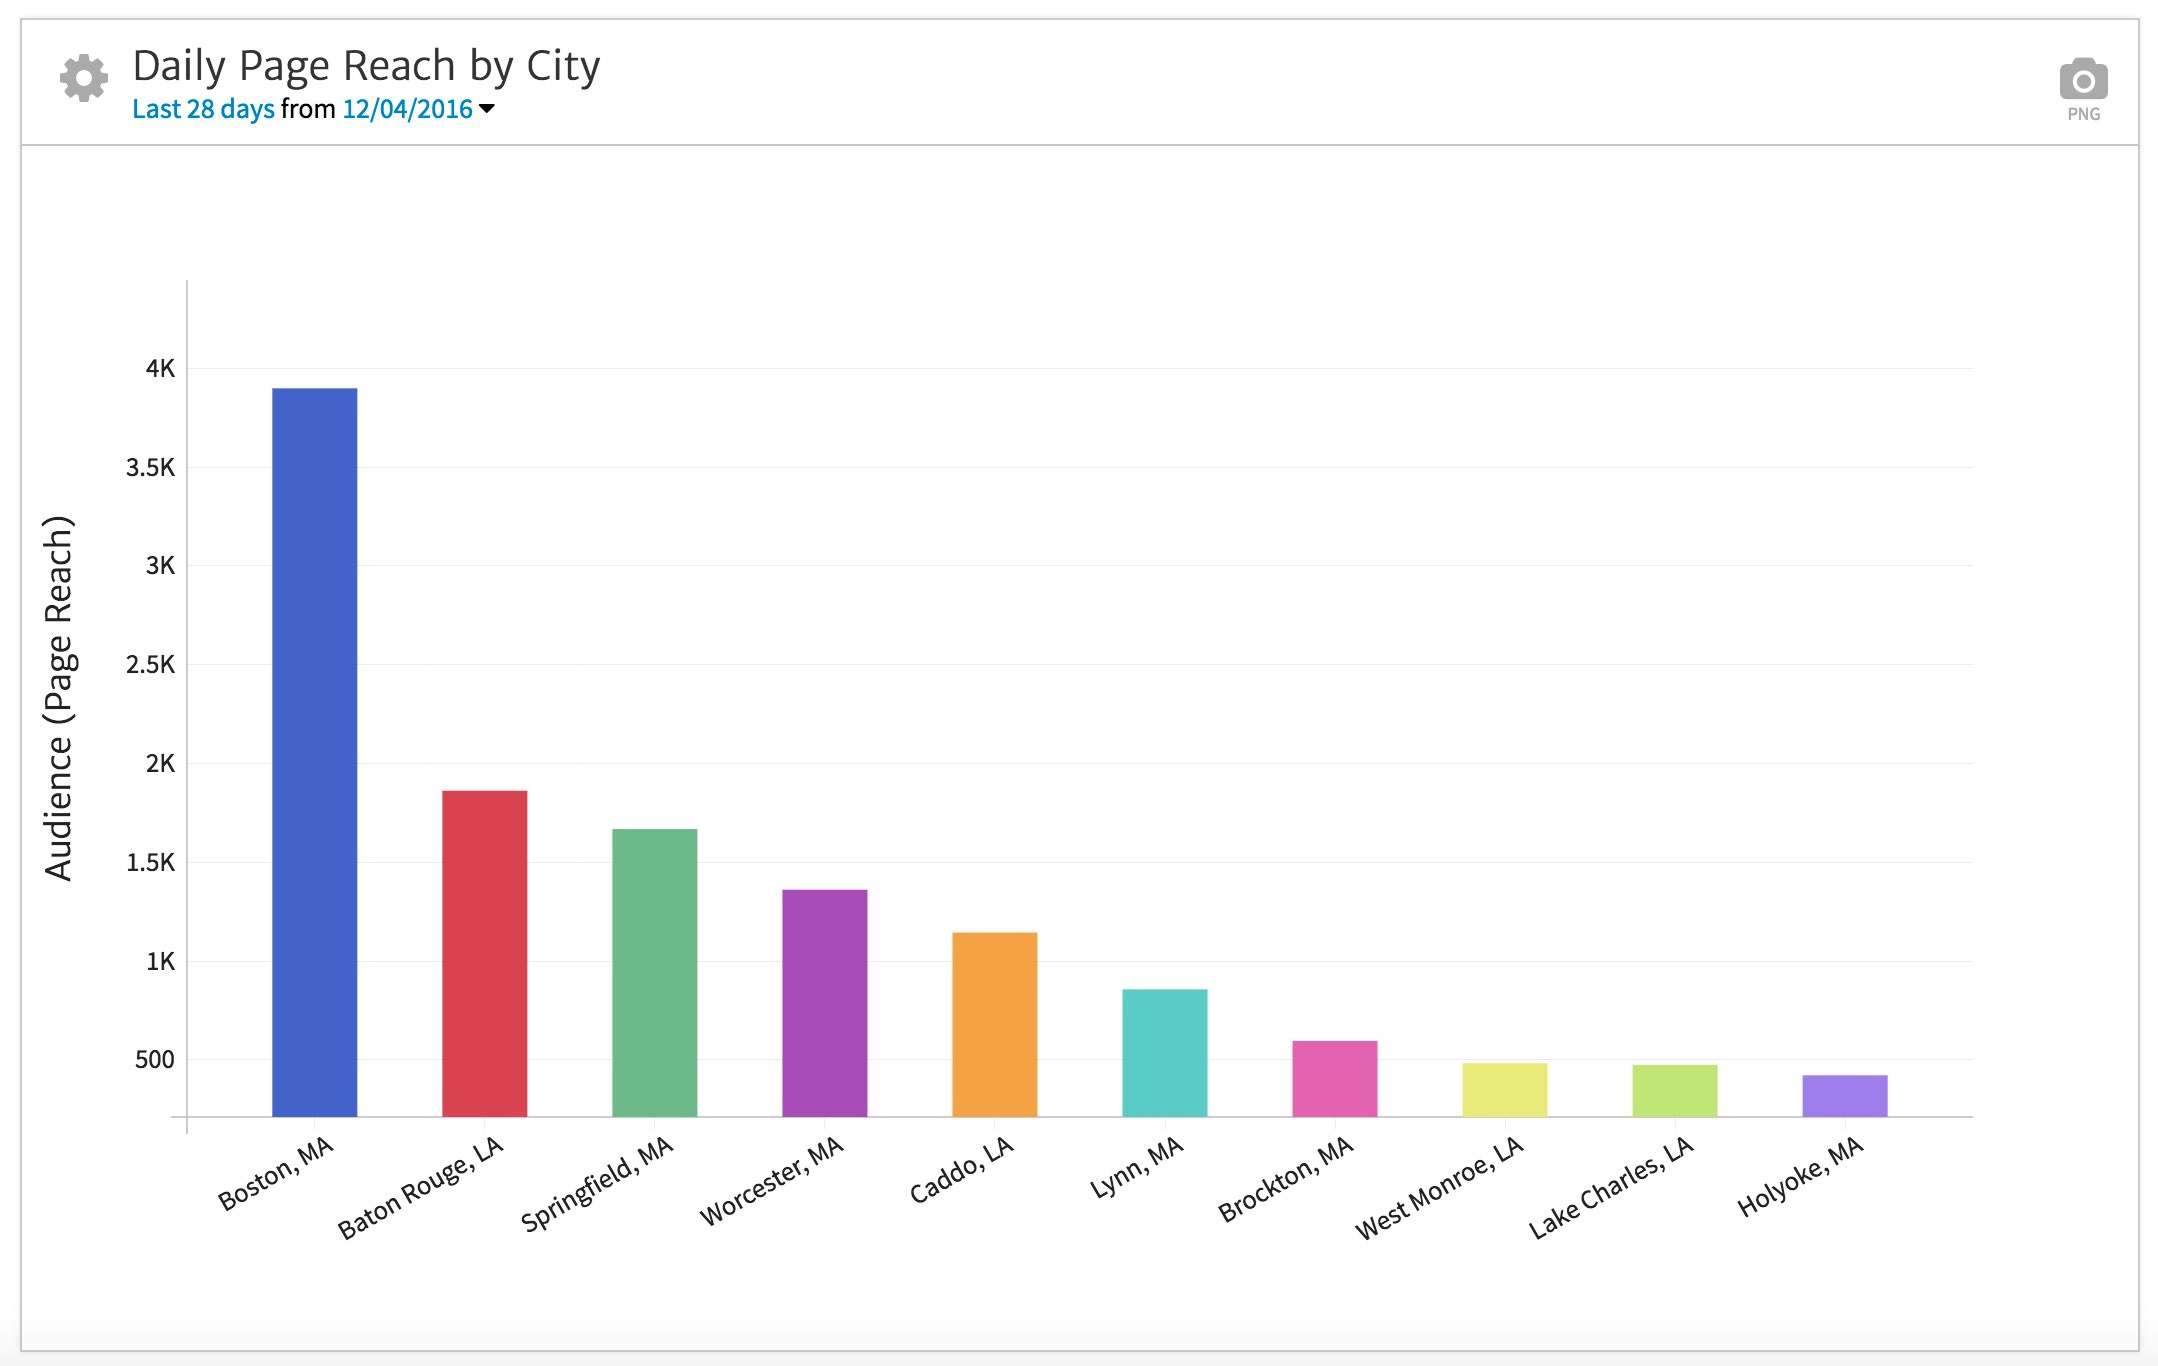
You can break down reach by time period and the same demographic factors used for likes. For instance, here we’ll use the Page Reach widget to show reach by city. We can note that Boston ranks, by far, as the city where the most people saw posts.
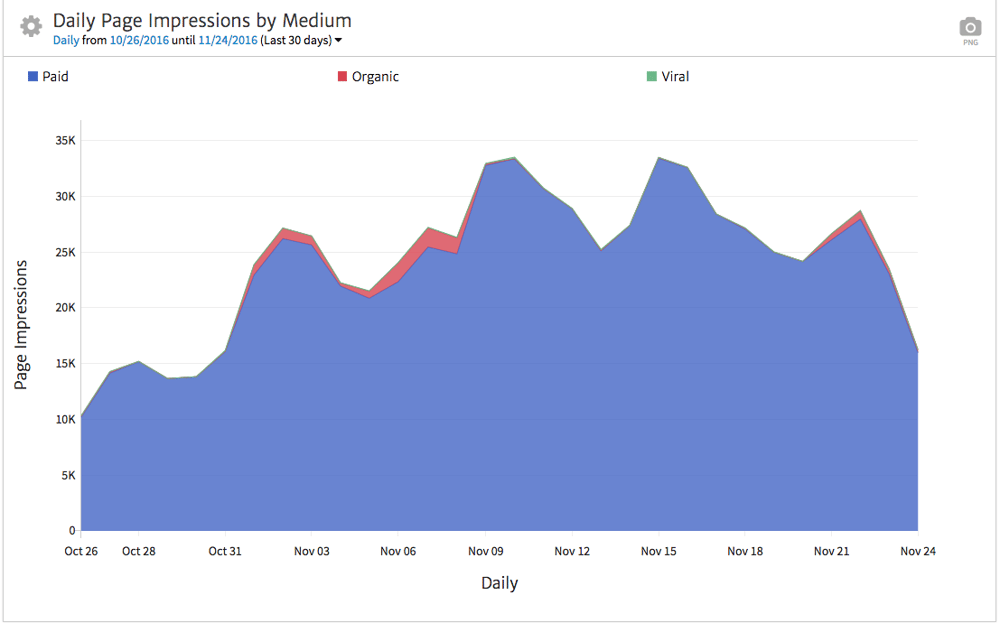
Beyond reach, you can also show how many people are looking at your Facebook business page itself by using the Page Impressions widget. You can segment the medium to break down impressions by paid (advertising), organic (natural exposure in newsfeed), and viral (shown via a friend). Below, we’ve used an area chart to show impressions over the last 30 days for a page heavily utilizing ads for a promotional campaign.

Read our full blog post about integrating Facebook insights widgets with Megalytic.
Reporting on Facebook Ads
Beyond Facebook Page Insights, you can also report on the performance of ad campaigns with integration of a Facebook Advertising account. To report on ad metrics, you can use three highly customizable widgets:
- Ads Campaigns
- Ads KPI
- Ads Multi KPI
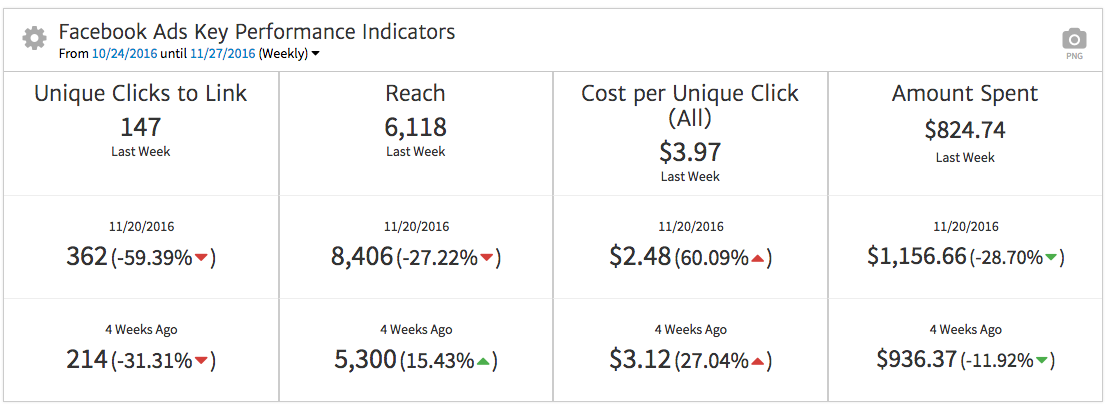
Once again, the Multi KPI widget can help to put important metrics front and center. Below, we show Unique Clicks to Link, Reach, Cost Per Unique Click, and Amount Spent for the last week, comparing data to the previous period and previous year.
Next, use the Facebook Ads Campaigns widget to break down more specifics from advertising performance. By pinpointing campaigns, ad sets, and ads that performed the best, you can determine the audience targeting criteria and messaging that delivers the most effective results. You can choose from a number of metrics available via the Facebook Ads interface; in the example below, we’re showing click and reach performance by campaign.
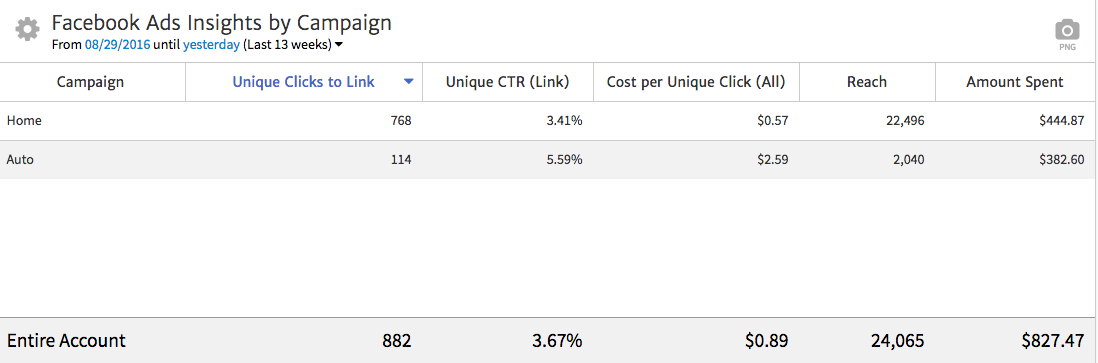
Note that including multiple metrics like cost per click and clickthrough rate can help to highlight various areas of performance. In our example, the “Home” campaign has more traffic and a significantly lower cost per click; however, the “Auto” campaign has a higher CTR (clickthrough rate).
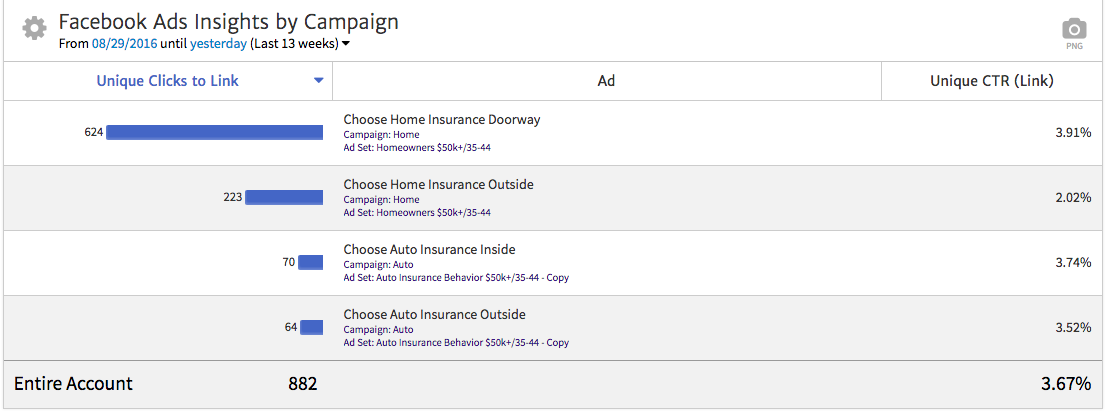
You can use this widget to show ads on the account, campaign, ad set, or ad level, as well as segmenting data to specific campaigns or ad sets. Below, see how we’ve adapted the widget to show Unique Clicks to Link and Unique CTR by individual ad. We can see that the ad labeled “Choose Home Insurance Doorway” (referencing imagery in the ad) received by far the most clicks and the highest CTR.
For more info, check out our full article on our Facebook ad integration. As a bonus we also have Facebook Templates for sample reports to inspire you.
Conclusion
Megalytic’s new integrations allow you to expand your reporting capabilities as you move ahead into a new year. As a solution to report on your Facebook marketing efforts, integrate your Facebook business pages and ad accounts to better communicate results to your clients.
Once you start customizing the widgets, you’ll find the level of customization invaluable for showing the performance of organic and paid social media campaigns. With our Facebook widgets fully integrated we’re looking toward the future. Tell us what new features you’d like to see in Megalytic over the coming year!