
May 21, 2024
Analyzing Your Website’s Mobile Visitors
By Megalytic Staff - July 11, 2014

Big Picture – The Mobile Overview
Before we can address mobile concerns, we must understand what impact mobile users are currently having on our site. We can start by looking at the trend and metrics provided in the Mobile Overview report (Audience > Mobile > Overview) to get that baseline. Click on the check box next to the “mobile” row in the table section of the report, and then click “Plot Rows”. This will produce a chart showing the trend in sessions coming from mobile, compared with all sessions. Set the date range to 6 months or more to help spot any trend.
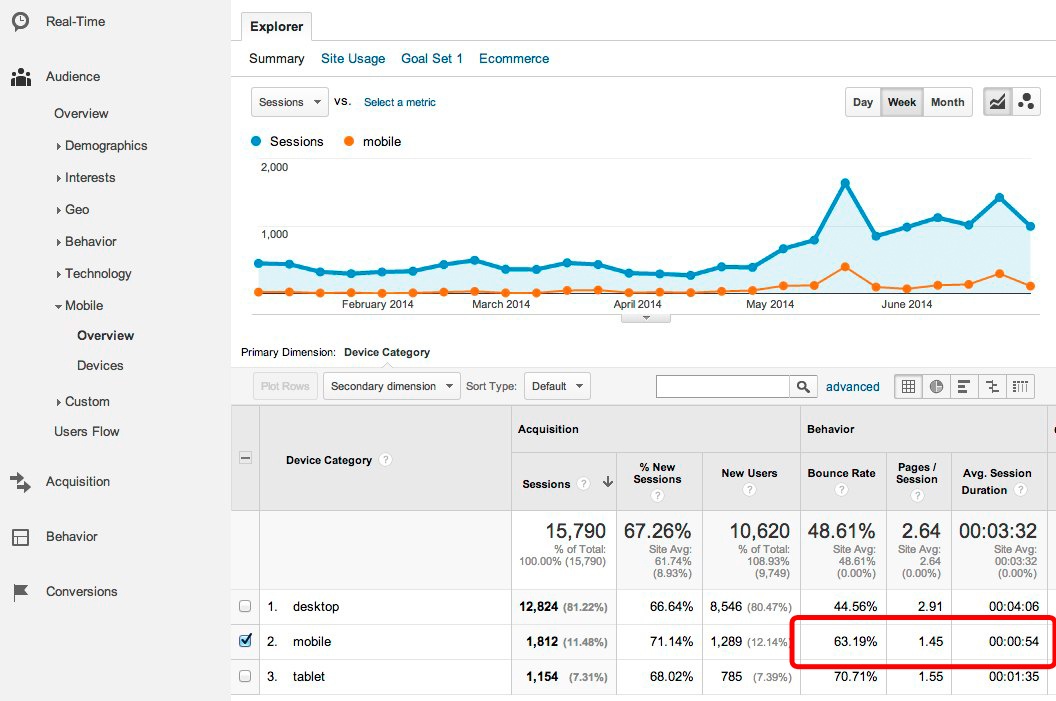
This chart shows that while mobile traffic was fairly insignificant at the beginning of the year, it has grown over the last couple of months.
When looking mobile traffic trends, you might want to see how it’s share of the total changes over time – as a percentage. For this, and other fine tuning of Google Analytics, you can try Megalytic - in the Appendix you can see an example of a chart showing how mobile share changes over time.
The Google Analytics Mobile Overview report also gives you a high level view of important engagement metrics and how they stack up on desktop vs mobile vs tablet. The mobile engagement metrics are circled in red in the image, and you can clearly see that mobile users are on this site are less engaged than desktop users. The mobile Bounce Rate is quite a bit higher, and the Page / Session and Avg. Session Duration are quite a bit lower.
The site that this data comes from is a SaaS product which subscribers primarily use from a desktop. These logged-in subscribers are highly engaged and skew the desktop engagement metrics. By contrast, mobile users on this site are typically not subscribers and not logged in. They are browsing for information.
As this example illustrates, it is important to have some understanding of what mobile users are doing on your site in order to understand what the statistics are telling you. You may find that mobile users are more engaged on some pages and less on others.
If you find that mobile users are relatively unengaged on pages where you expect high mobile usage (e.g., reading a blog, watching videos), that probably indicates a design or usability issue that needs to be addressed. At one client recently, we observed that mobile users were much less engaged on video pages than desktop users. When we investigated the issue, we found that the embedded video player was not working properly on
If you find that your mobile users are relatively unengaged, don’t despair that you are going to have to redesign your entire site to appeal more to mobile users! Keep in mind that mobile users will behave differently than desktop users and think about designing features into your site that work well for them. A good first step is to start offering some content that is well suited for consumption on a phone.
The site above added a blog with a responsive design that is easy to read on mobile devices. After doing that, their overall bounce rate for mobile dropped from over 63% to less than 43%. In addition, as shown below, for mobile visitors landing on the blog, the bounce rate dropped below 29%.
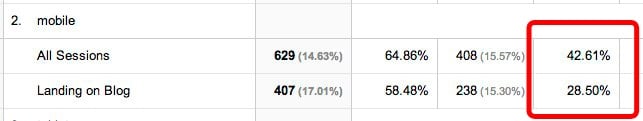
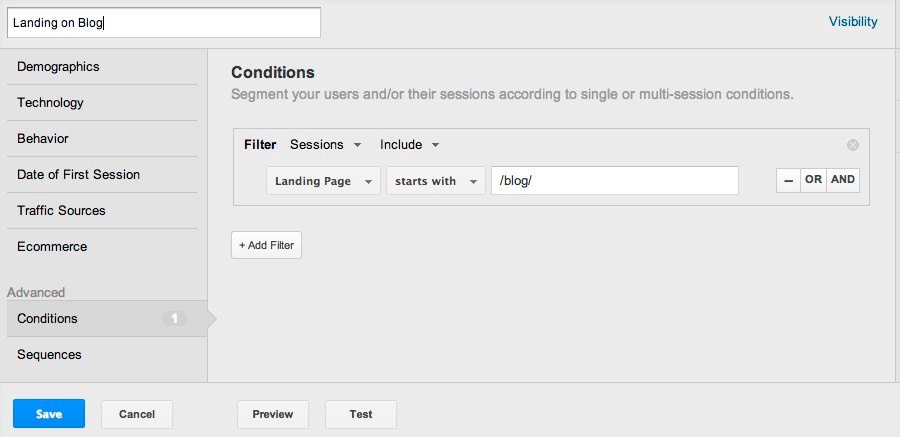
To do this kind of analysis yourself, you need to create a segment and apply it to the Mobile Overview report. Here is the segment used to capture the sessions Landing on Blog.
What devices are they using?
Designers and UI testers need to know which devices your mobile visitors are using. This information is important for ensuring pages render correctly. Before pushing out changes to the website, it is good practice to test on your site’s most commonly used devices.
You can find this information in the Devices Report (Audience > Mobile > Devices).
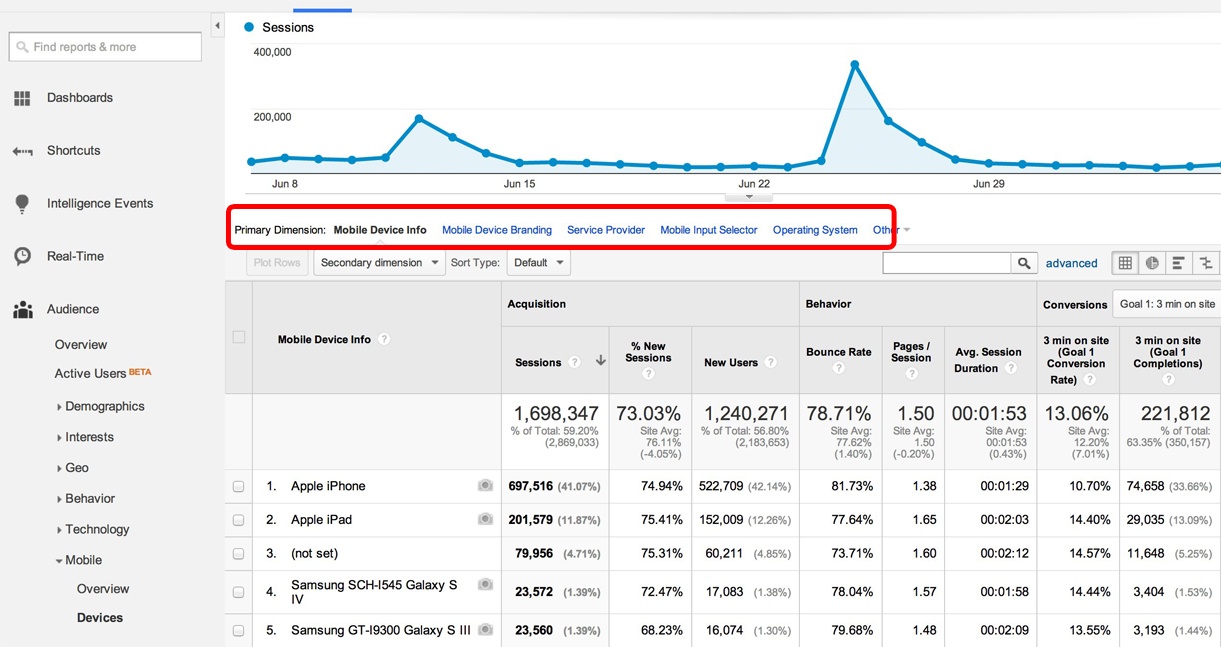
This report shows that more than half the mobile visits are from an iPhone or iPad, so those platforms would be top priority for usability testing. Note that you can get more than just device data from this report. Click on the “Primary Dimension” options (circled in red in the image) to view mobile data by device brand, wireless carrier, or operating system.
Channels – Where do mobile users come from?
Understanding where your mobile users come from can help you design campaigns to target these users with content that works well on mobile devices. For example, if a majority of your traffic from Twitter is composed of mobile users, then promote landing pages that are optimized for mobile in your Twitter advertising.
To see where your mobile users come from, open the Channels report (Acquisition > Channels). Next, apply the segment named “Mobile Traffic” to isolate the mobile sessions. To do that, click on the “+ Add Segment” button at the top right of the report. Then, select “Mobile Traffic” and click “Apply”.
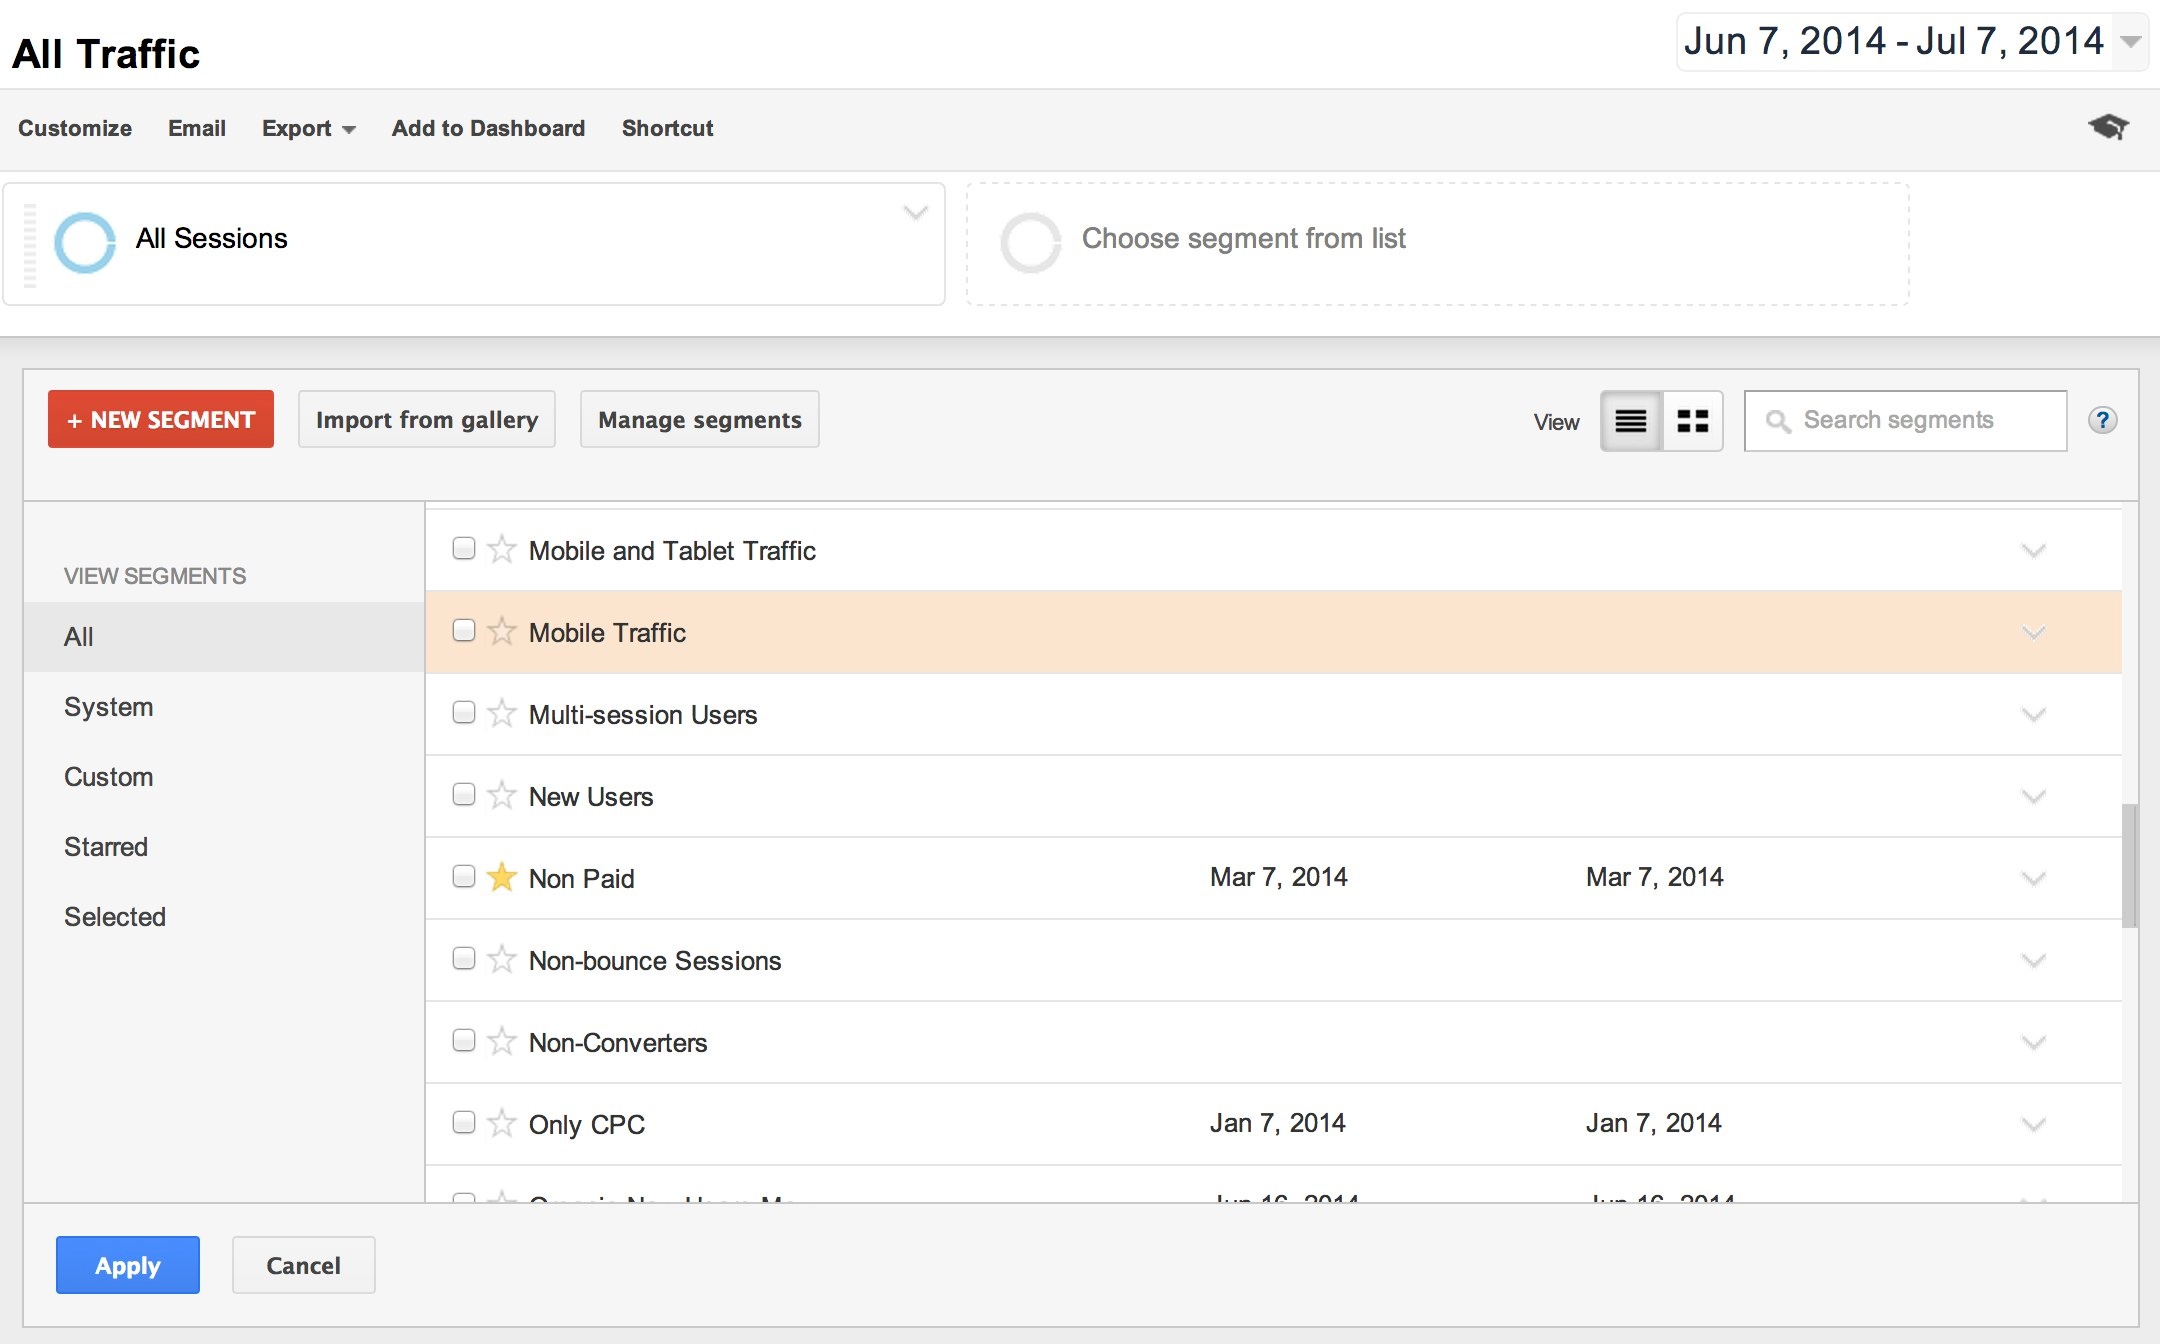
Next, click on the “All Sessions” segment at the top to remove it. The report will now show you mobile-only traffic (Mobile Traffic). Ignore the “Direct Traffic” category, as this grouping is simply a catchall that Google Analytics uses to classify traffic when it cannot identify the source.
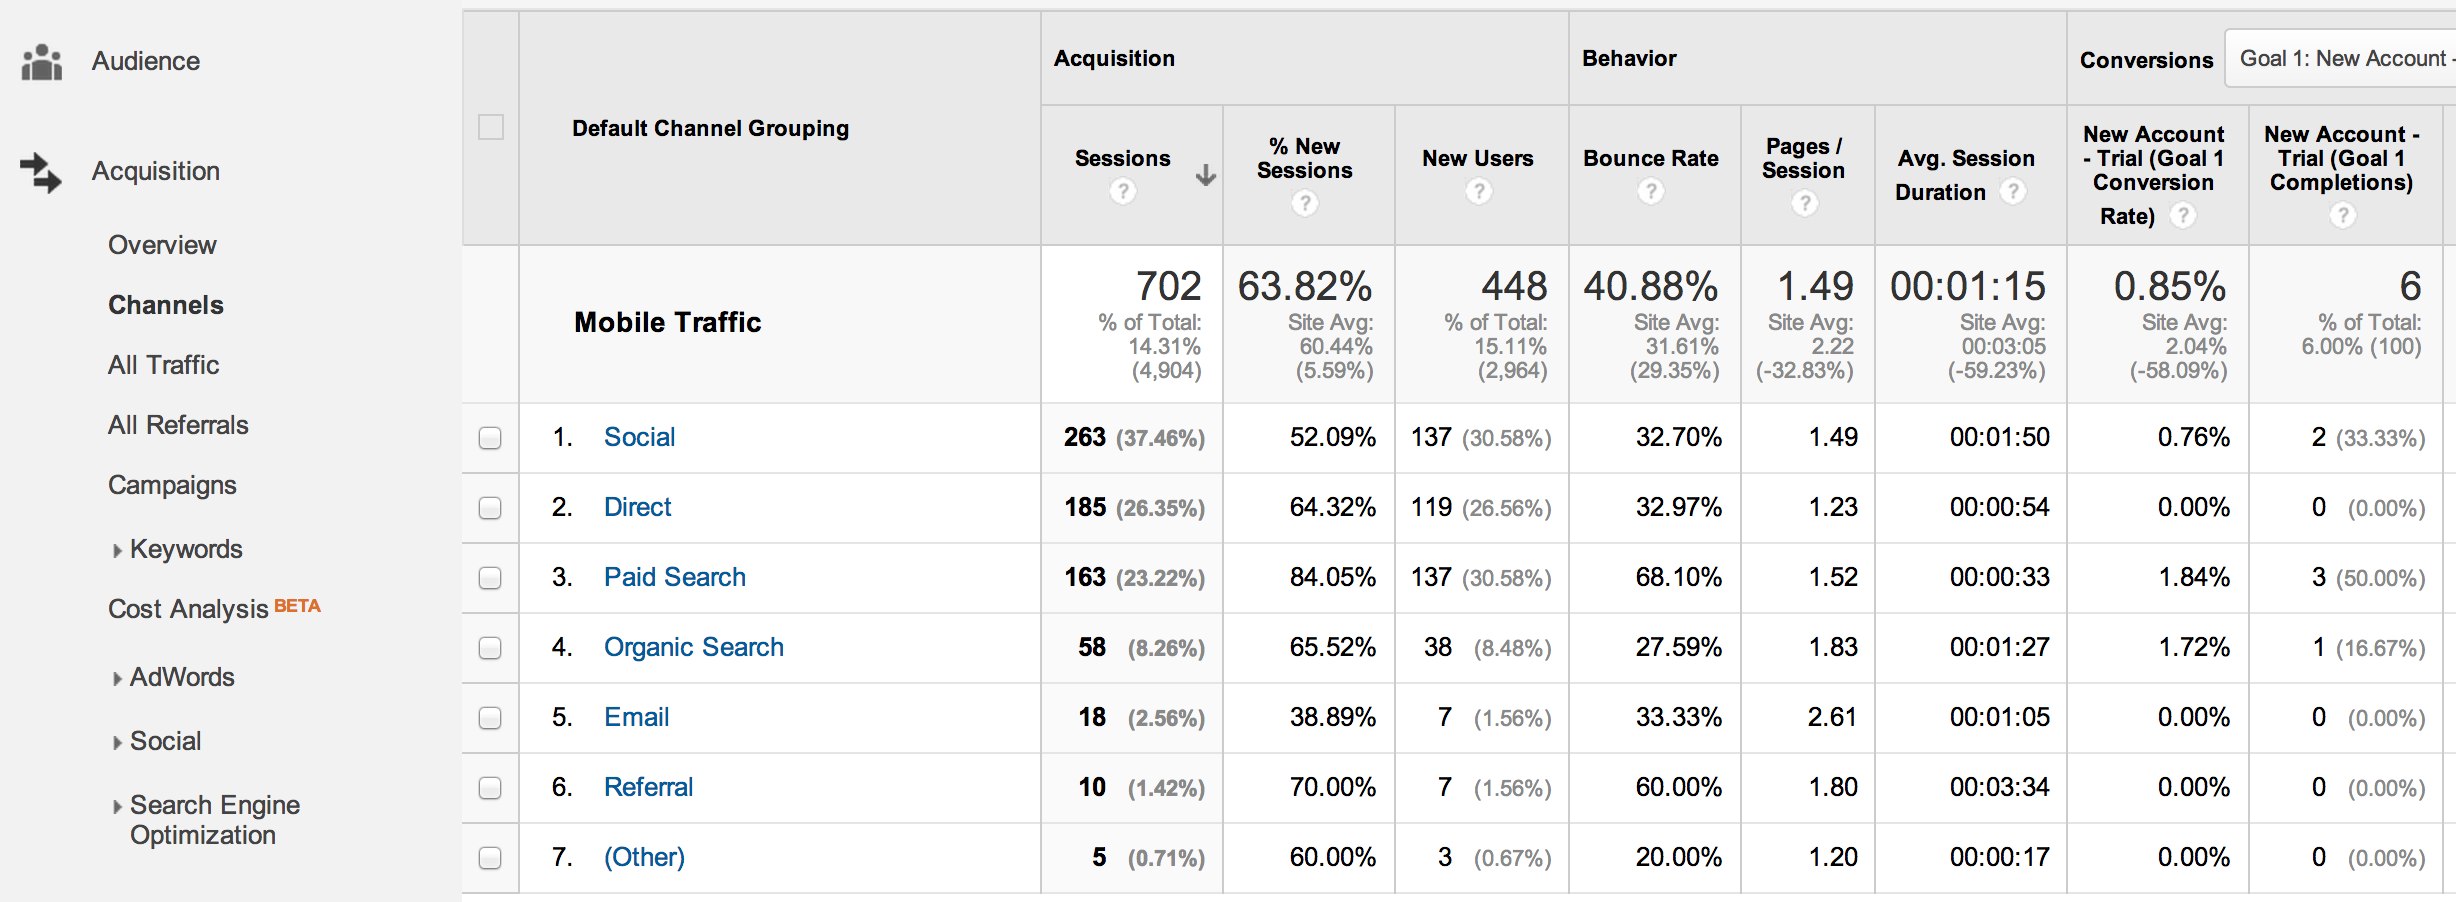
In this report, you can see that the biggest driver of mobile visits is social networks. Click on “Social” to drill down and see which networks are sending the most traffic.
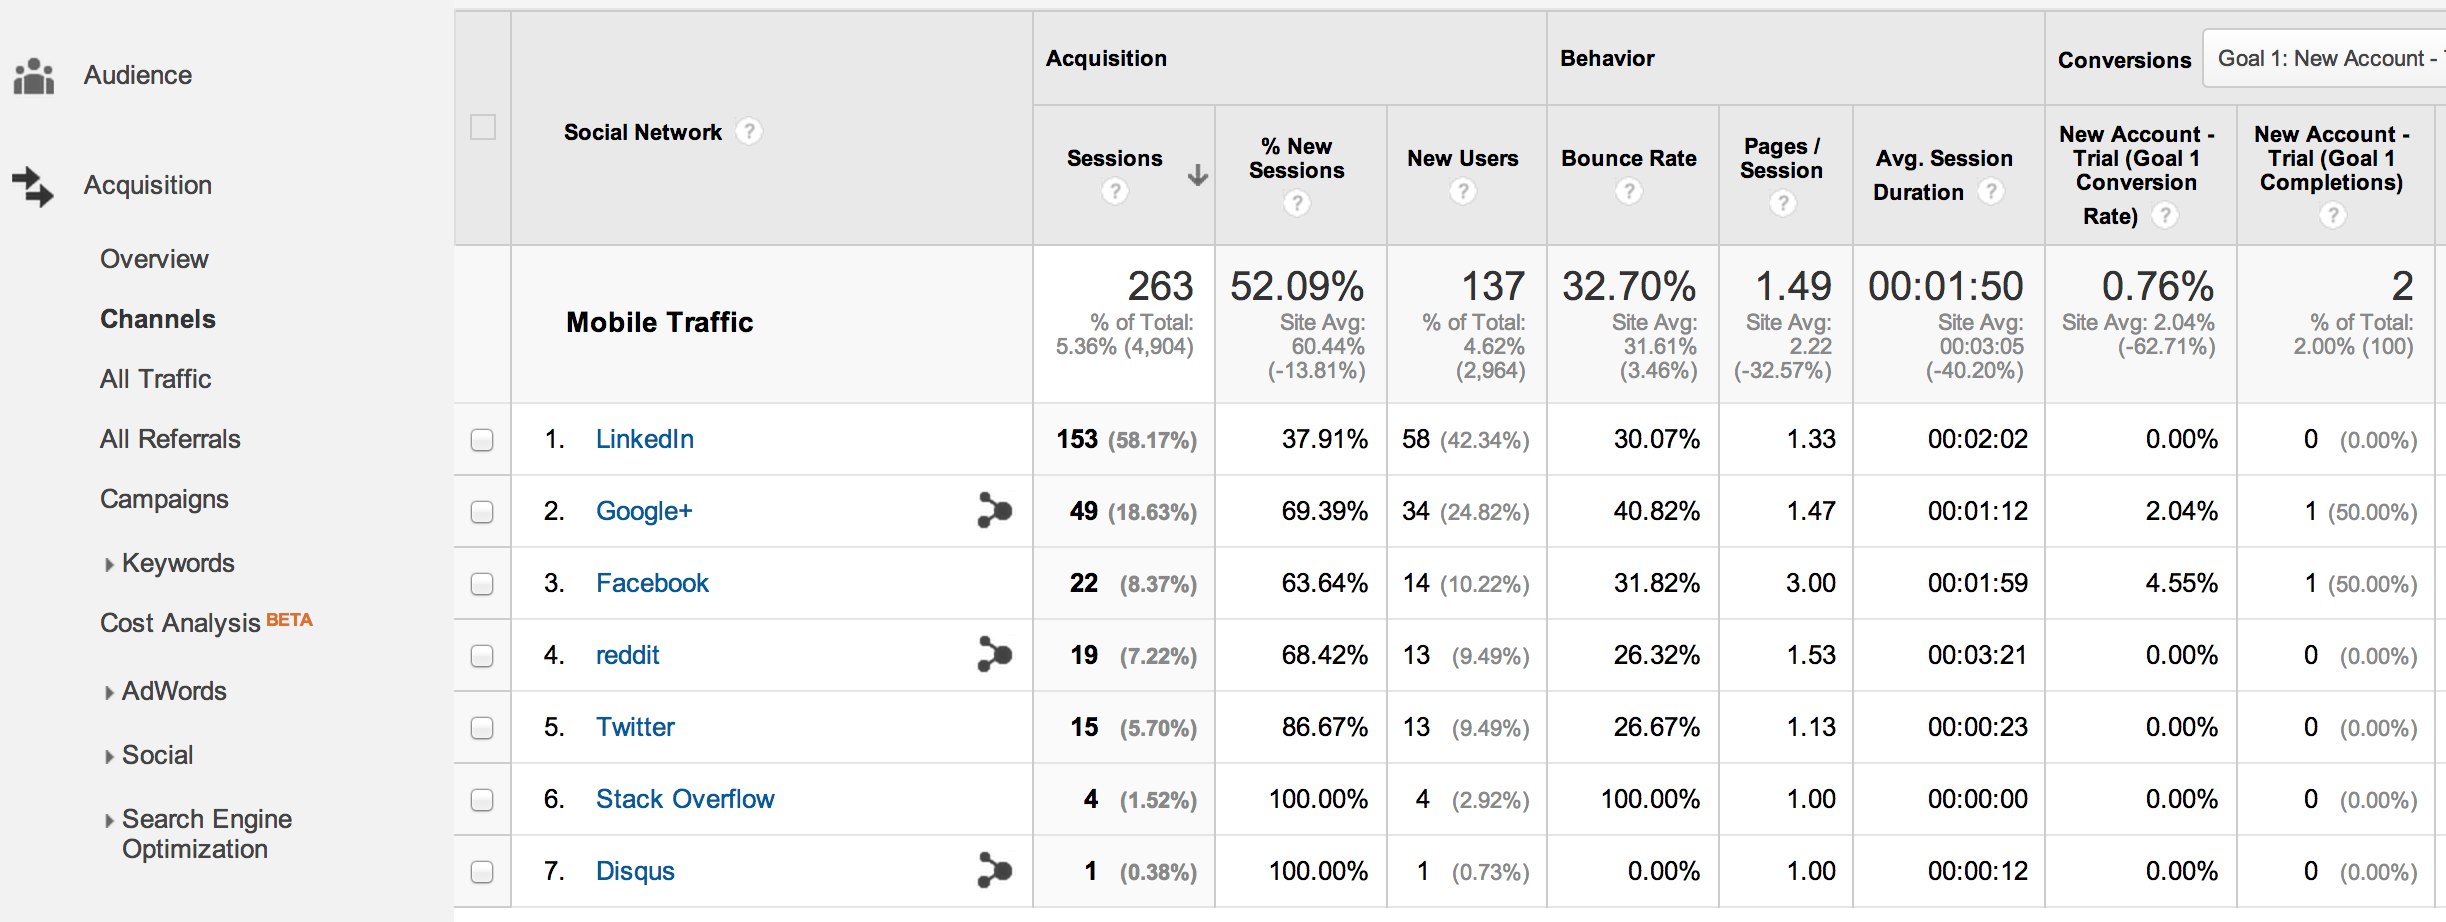
In this case, we can see that more than half of the mobile visits from Social are coming from LinkedIn. Notice, however, that there have been no conversions from these LinkedIn visitors. Does this mean that LinkedIn traffic is unlikely to convert, or does it signal a problem with the mobile conversion experience?
To answer that question, add the “Tablet and Desktop Traffic” segment and compare the engagement of these users with the mobile group.
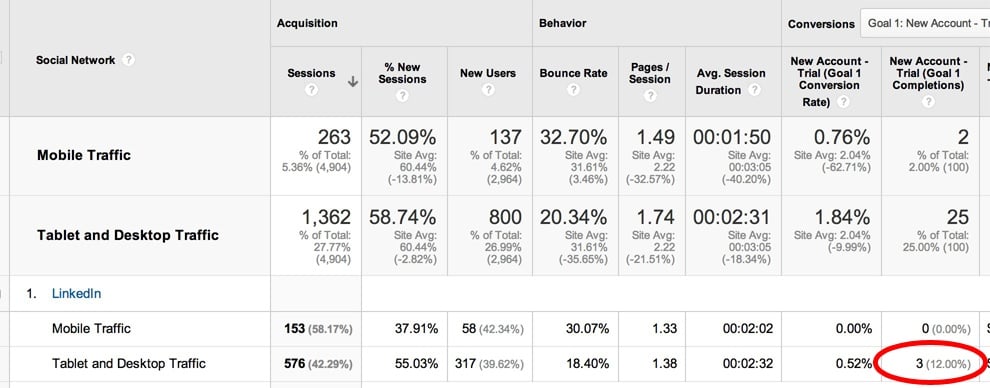
As it turns out, there are three conversions from the non-mobile LinkedIn traffic. While, this isn’t enough data to draw a definitive conclusion, it indicates that the site could be doing better with the mobile traffic from LinkedIn and should take a close look at where these users are landing and where they are going.
To do that, create a custom segment that isolates just the traffic from LinkedIn that is using a mobile device.
Use Custom Segments for a detailed understanding of mobile users
In Google Analytics, we use segments to look at specific groups of sessions or users. Segments are particularly useful for isolating mobile traffic and comparing behavior with other types of visitors.
Google Analytics provides us with the ability to create custom segments to look at the behavior of very specific sets of users or sessions. To create a segment for “Mobile-LinkedIn” traffic, click on “+ Add Segment” at the top of the report, and then select “+ New Segment”. First, select Technology and set the Device Category to mobile.
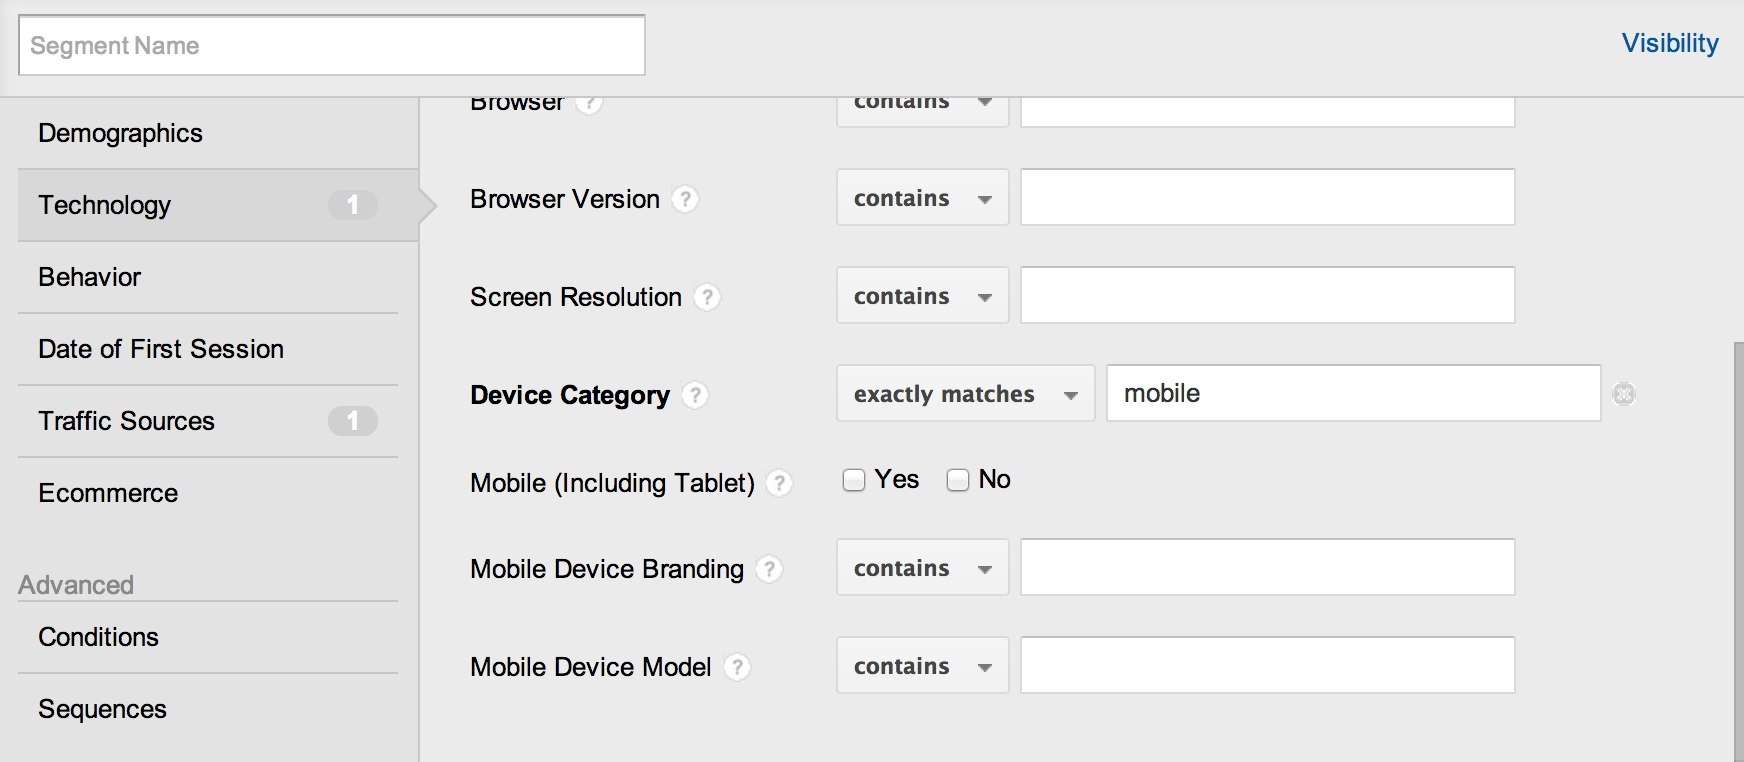
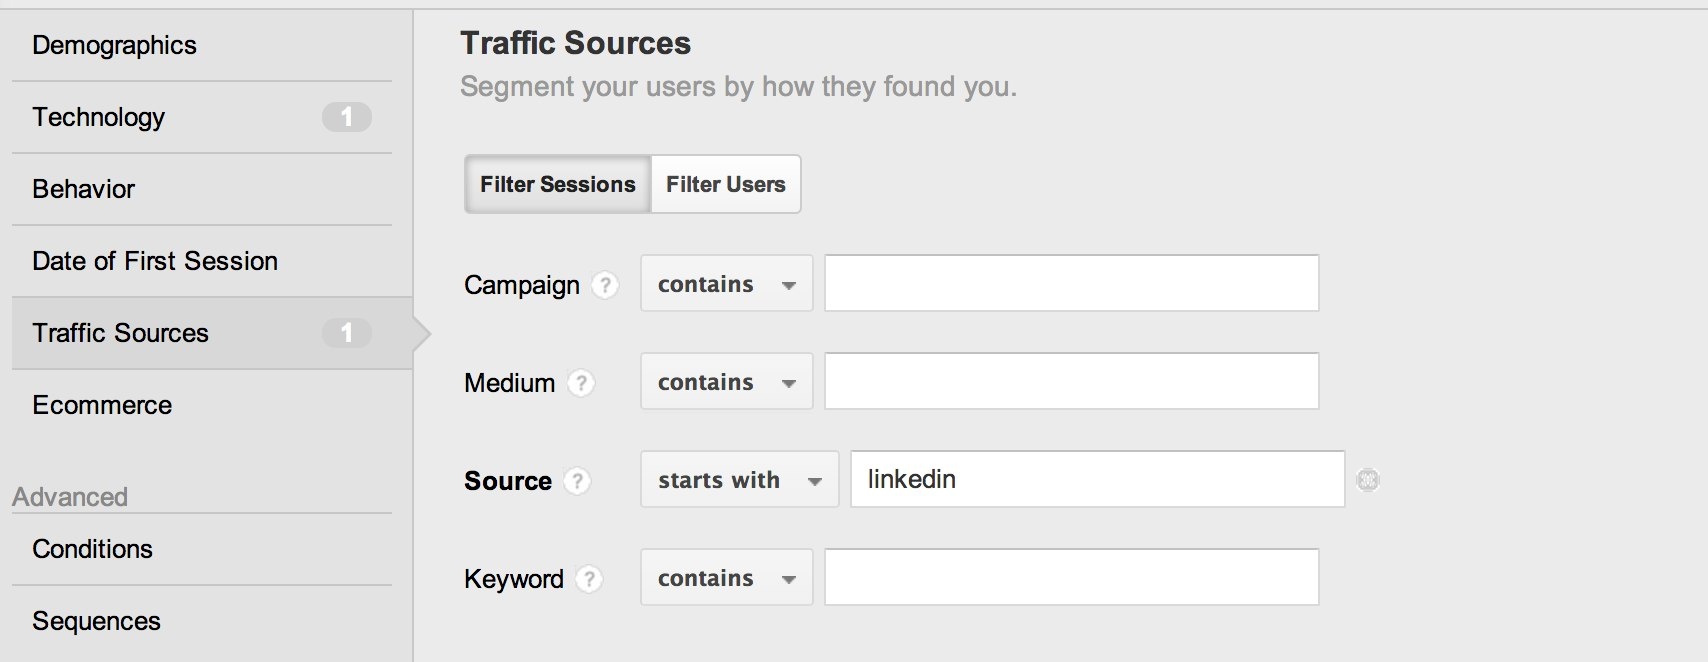
Next, select Traffic Sources and set Source to starts with “linkedin”. We are using “starts with” because LinkedIn traffic can show up as “linkedin.com” or just “linkedin”.
With this new segment, we can study the behavior of the mobile LinkedIn visitors using any of the reports provided by Google Analytics.
Where do they go next?
The Behavior Flow (Behavior > Behavior Flow) report shows us how traffic flows through a site. Open this report and apply the new Mobile-LinkedIn segment that we just created.
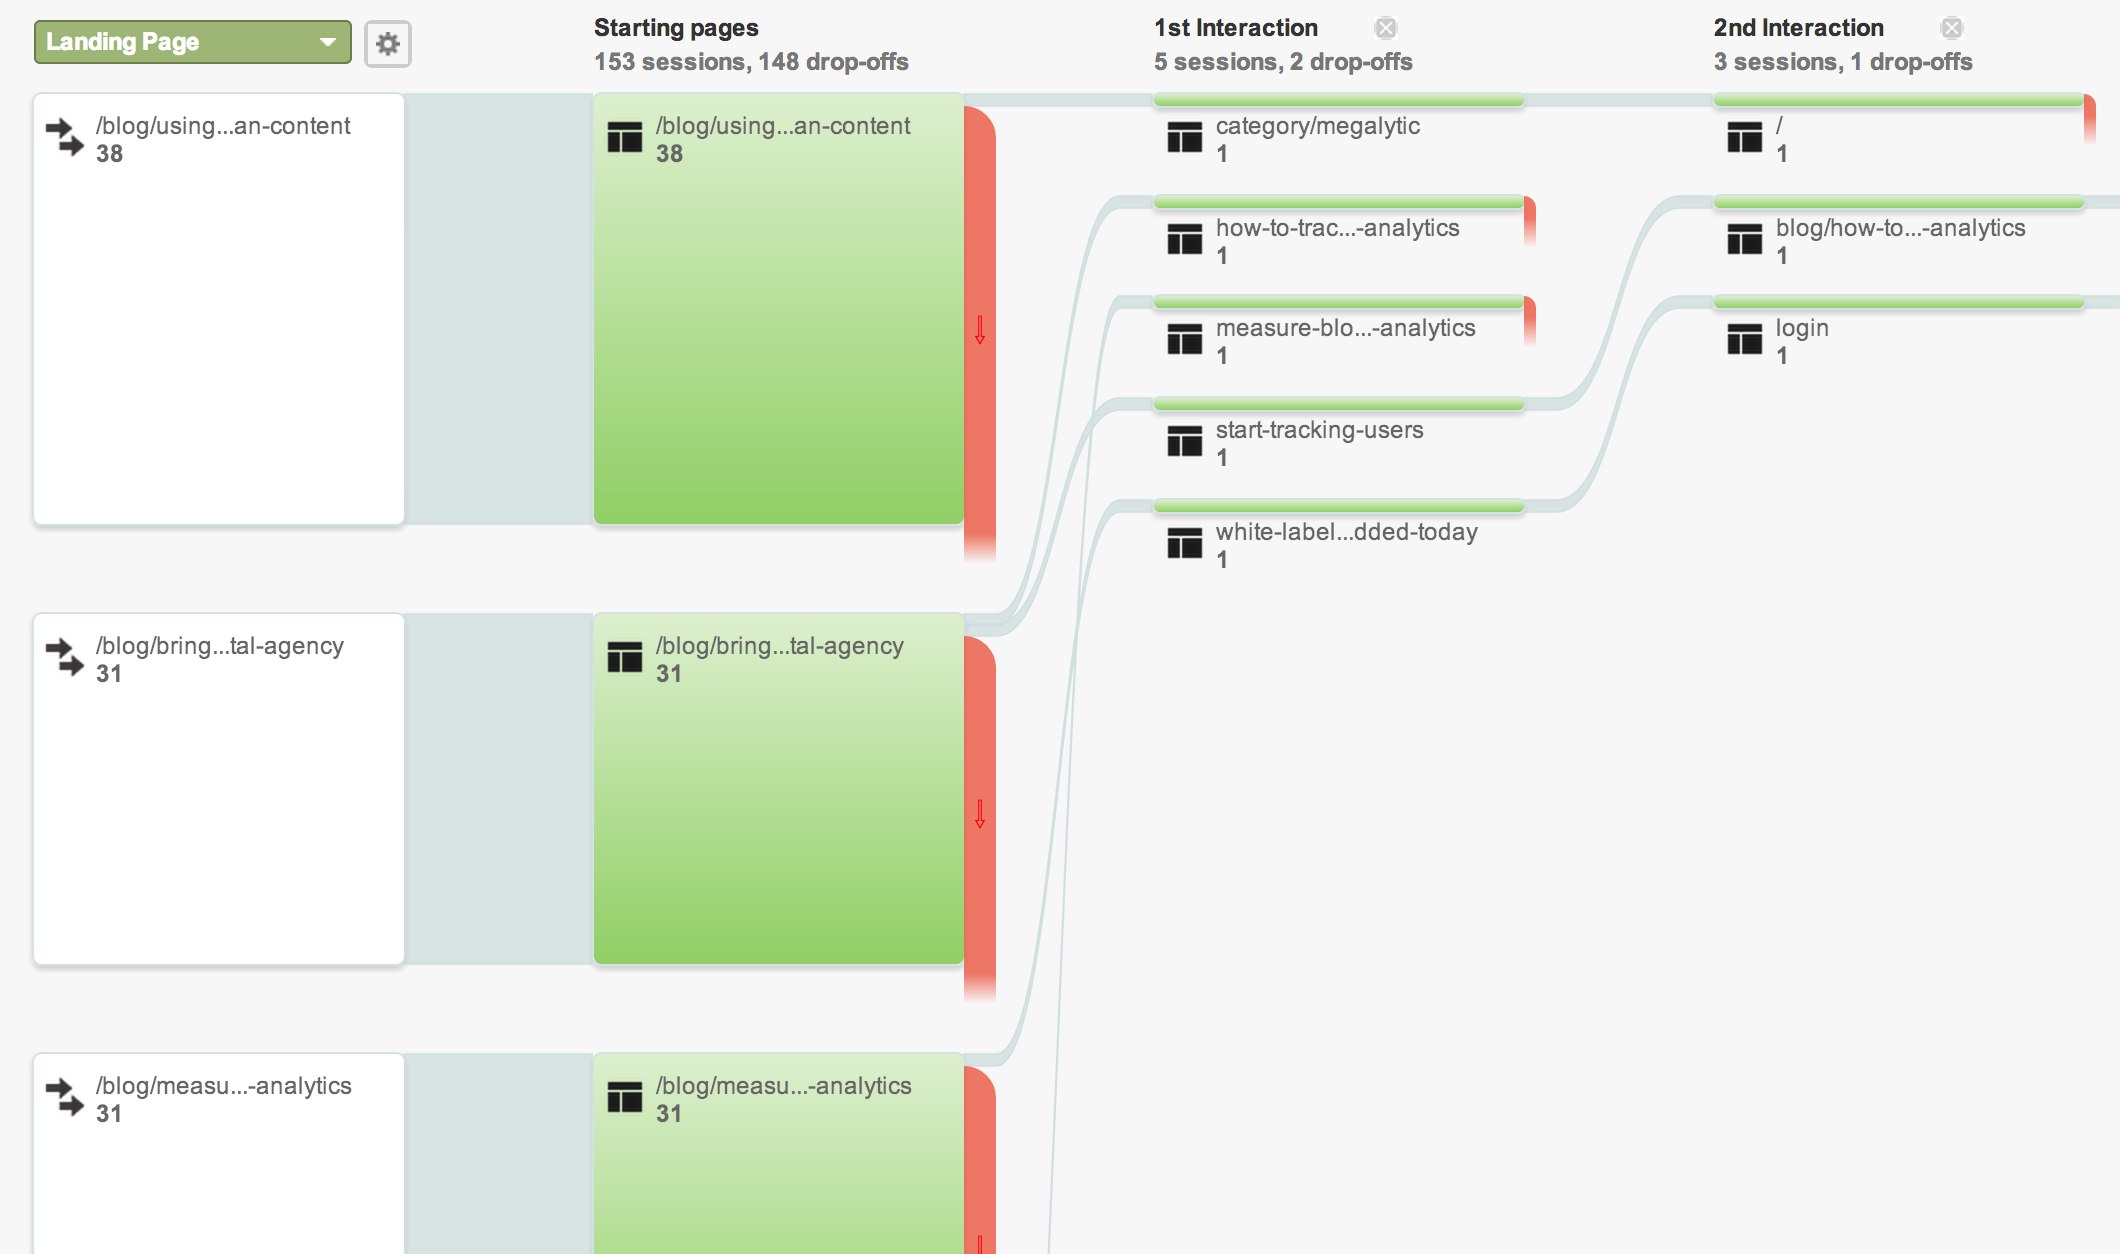
Starting with the left hand column and reading to the right, we can see the Landing Pages that the Mobile-LinkedIn users started and, and where they went next. Almost all these users landed on a blog page and exited immediately after. Of those that continued, most went on to read additional blog pages. Only a couple of these visitors made their way over to the main site.
Micro Conversions for Mobile Users
What could we do to better engage these users? Since they are mobile users who have come specifically to read a blog post, it is probably not surprising that most of them do not engage in extensive browsing outside the blog. However, many of these visitors would probably be interested in learning when new blog articles are posted, so we should probably provide a conversion funnel that leads to an email signup.
Micro conversions like an email signup are ideal for mobile users. We need to provide quick and simple ways to further engage the mobile user. Email signup enables us to reach out to these users in the future and introduce them to other content on the site.
Conclusion
Google Analytics provides powerful tools for analyzing the behavior of mobile users. Start with the basic Mobile Overview report to get an understanding of mobile traffic trends on your site. Identify the sources of mobile traffic using the Channels report and the Mobile Traffic segment. Once you find the important sources of mobile traffic, you can analyze them in detail by creating custom segments and applying them to the Behavior Flow report.
Appendix
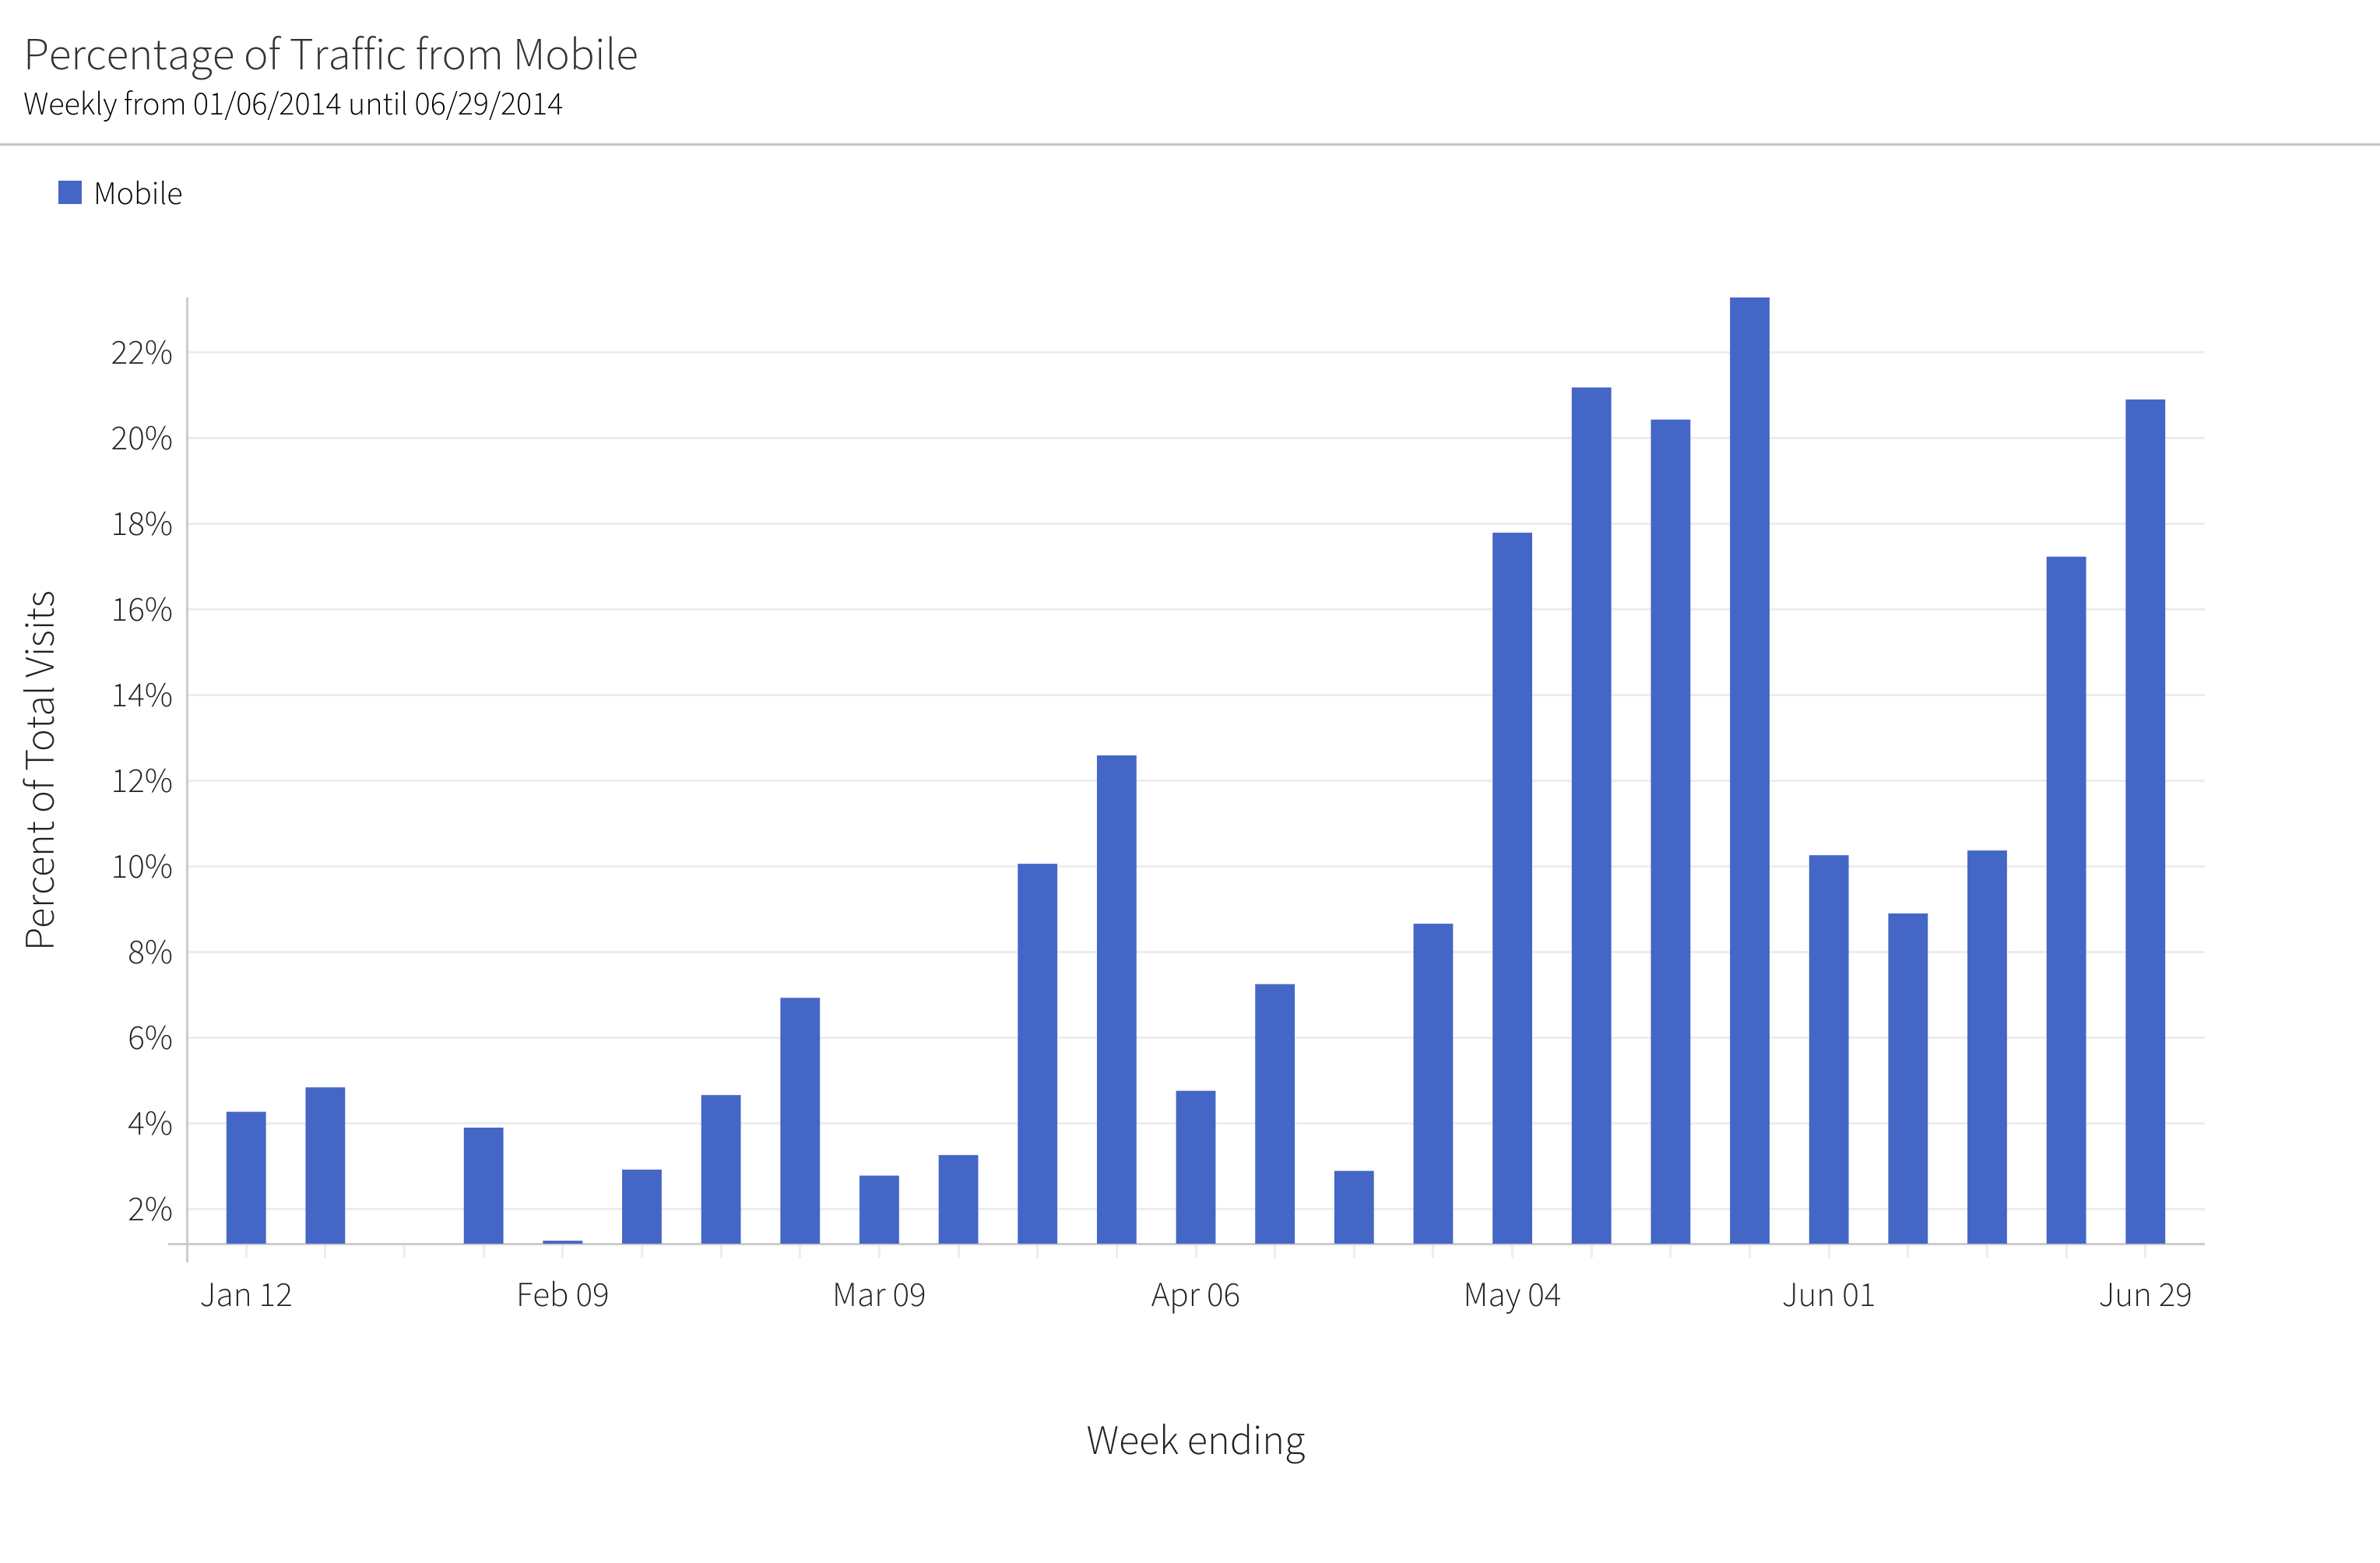
Megalytic provides capabilities to fine tune charts in ways that are not available directly in Google Analytics. For example, the Megalytic chart below shows how mobile traffic has changed over time, as a percentage of the total traffic. You can see that at the start of the year, mobile represented less than 5% of the traffic. By mid-year, it has grown to nearly 20%.
To create a chart like this in Megalytic, first register for a trial account . Here are some instructions for setting up an account .
Next, create a blank report and add the widget named “Traffic by Platform/Device”.
You can edit this widget to display only the mobile traffic, and configure it to show data in percentage format by selecting the “Show as Percent” box.
Please contact support if you have questions or need help getting started.