
May 21, 2024
An Example Instagram Report Template for Agencies
By Megalytic Staff - December 21, 2018
2018 was the year that Instagram became a major internet marketing platform, with nearly one billion users. If you didn’t already have a brand presence on the social media platform, you probably started one, or wanted to. Both organic posts and paid advertising on Instagram can bring great value to your brand’s marketing program.
Once you get your Instagram campaigns up and running, you are probably wondering how best to determine their performance. You want to demonstrate the value of these campaigns, know where you’re doing well, and where you can improve for the future. You’re probably going to start doing a monthly report on Instagram performance. Luckily, this is not a difficult process. It’s very similar in many ways to other reports you may already be producing. In this post, we’ll present a template to help you jump start your Instagram reporting.
Report Templates Are Important for Agencies
Your agency probably manages many Instagram pages for clients. It takes time and manpower to create content for all those pages, not to mention promoting posts, creating ad campaigns, designing landing pages, and all the other strategies you’re implementing. You need to optimize the performance of your efforts. You want to ensure that you are getting a good return on the investment you’re making in Instagram, for yourself and for your clients.
Your clients also want to know that they’re getting returns on their marketing investments. They likely want an easily understandable monthly report that shows the success or improvements of the Instagram accounts you’re managing. How do you determine which metrics to use to measure Instagram success? And how will you find the time to create such reports? Creating a report from scratch for each client is too time-consuming and will not scale as you add more clients.
Fortunately, with Megalytic you can easily create an Instagram report template to jump-start the process. Building an Instagram report template creates a foundation that can then be adapted to each of your clients.
To get started, consider the data you need to include for the majority of clients and what metrics you find valuable from
Instagram Insights
and
Instagram Ads on Facebook Ads Manager
. If there’s other data you find valuable across the majority of clients, make sure to include it in your template as well. Whether or not you use Megalytic for reporting, you can use this post as an example of the structure and key data points to include.
Key Performance Indicators (KPIs)
Your report should generally begin with key performance indicators (KPIs) that summarize Instagram performance for the week. Megalytic's Multi-KPI Widget lets you display up to 4 metrics, along with comparisons to previous periods. Comparing with the previous week (week-over-week) and the same week last month (month-over-month) indicates whether the KPIs have improved or worsened.
Four of the KPIs you’ll want to look at (for an Instagram account-- we’ll look at advertising later) are Impressions, Reach, Profile Views and New Followers:
-
Reach is the number of unique users that saw your post or story on any given day. It’s unlikely that every single one of your followers will see your content, so trying to maximize reach is important.
-
Impressions is the total number of times your content could have been seen (e.g., because it appeared in your followers’ feeds). A high impressions-to-reach ratio is a good indicator that content is performing well. Higher impressions can be a sign that your content is being viewed multiple times.
-
Profile Views is the number of unique views of your profile. It can help you determine how many people are checking you out to see if they want to follow you.
-
New Followers is the total number of new followers you’ve accumulated during a particular period of time. This helps you determine if your follower base is growing fast enough to meet your growth targets.
Your KPI chart should show the current metric value alongside comparisons to previous periods. Displaying your data side by side, compared with the previous week and 4 weeks ago, shows how you’ve improved as well as problem areas. Here, we use a Sparkline chart to show the trend in the data, along with the metric values themselves.
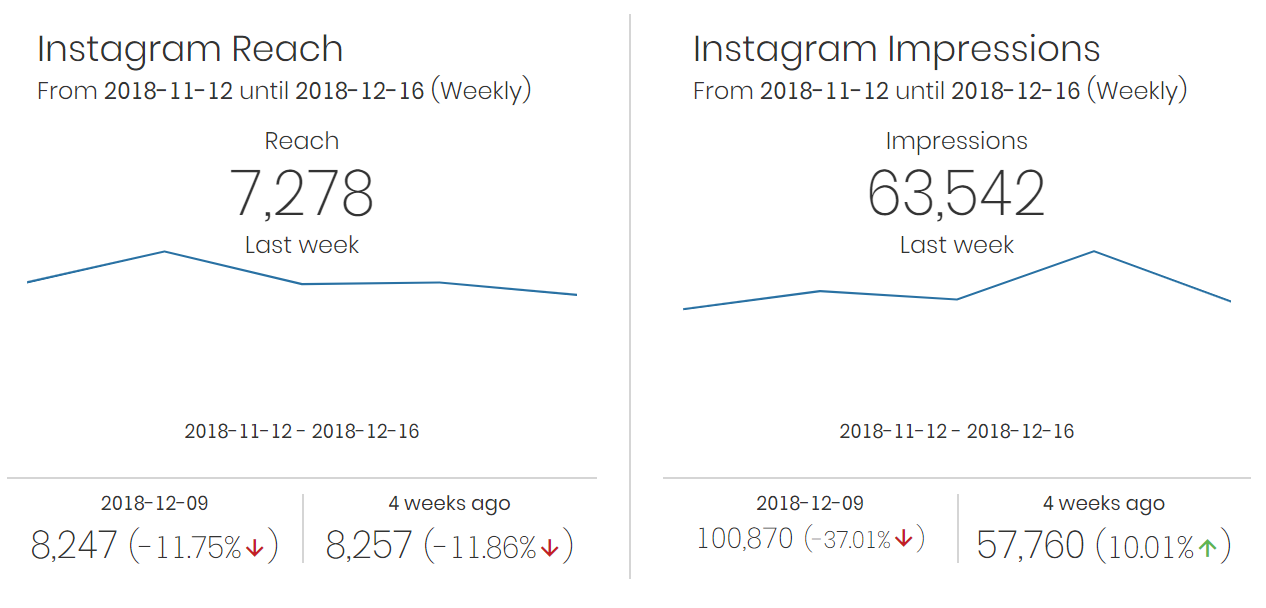
As you can see, impressions are higher than 4 weeks ago, but reach has declined. That could be for several reasons - you’ll want to look at your other data to determine why (such as trying new content topics that aren’t connecting with your readers). If the Sparkline makes the data display seem cluttered, you don’t always need it. You can simply show current numerical data compared to one or two previous periods.
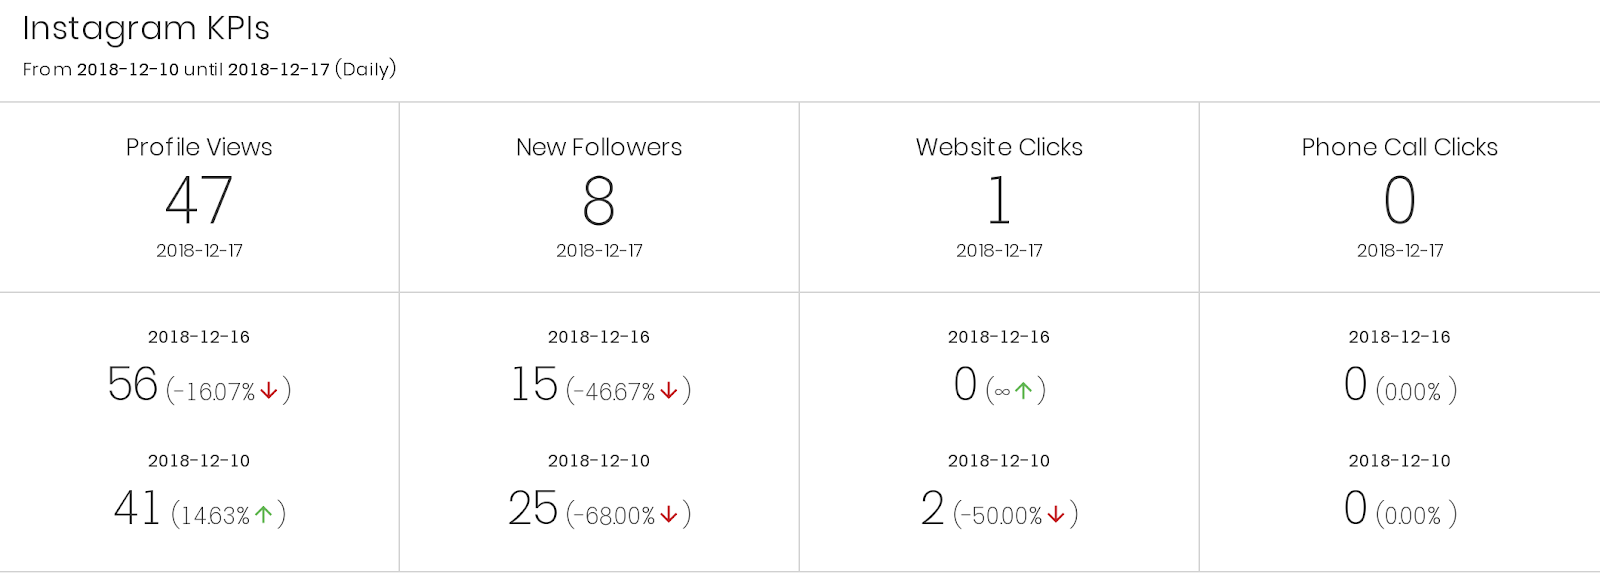
Here we see the core metrics of Profile Views and New Followers, along with some additional data for Website Clicks and Phone Call Clicks.
-
Website Clicks shows the number of times any links you've included in your business profile have been clicked. This can be an important engagement metric showing that people are interested enough in your brand to check out your profile and click through to your website.
-
Phone Call Clicks shows the number of times your Instagram feed has generated phone calls. Like website clicks, this is an important engagement metric, showing how many people are checking out your profile and initiating a call to your business.
In the example above, you can see that his client has some data for Website Clicks, but nothing for Phone Call Clicks. They may not be trying to generate phone calls from their Instagram feed, so that metric might not be useful. Make sure that your metric selections depend to some extent on what the client wants to achieve with Instagram.
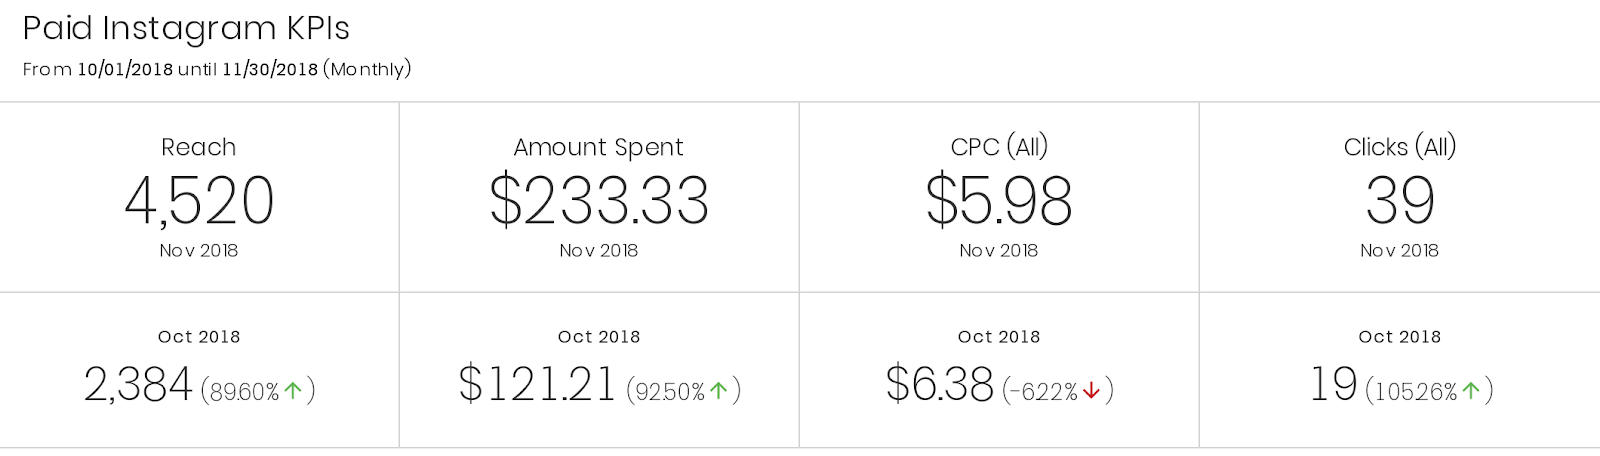
KPIs for Paid Instagram Ads
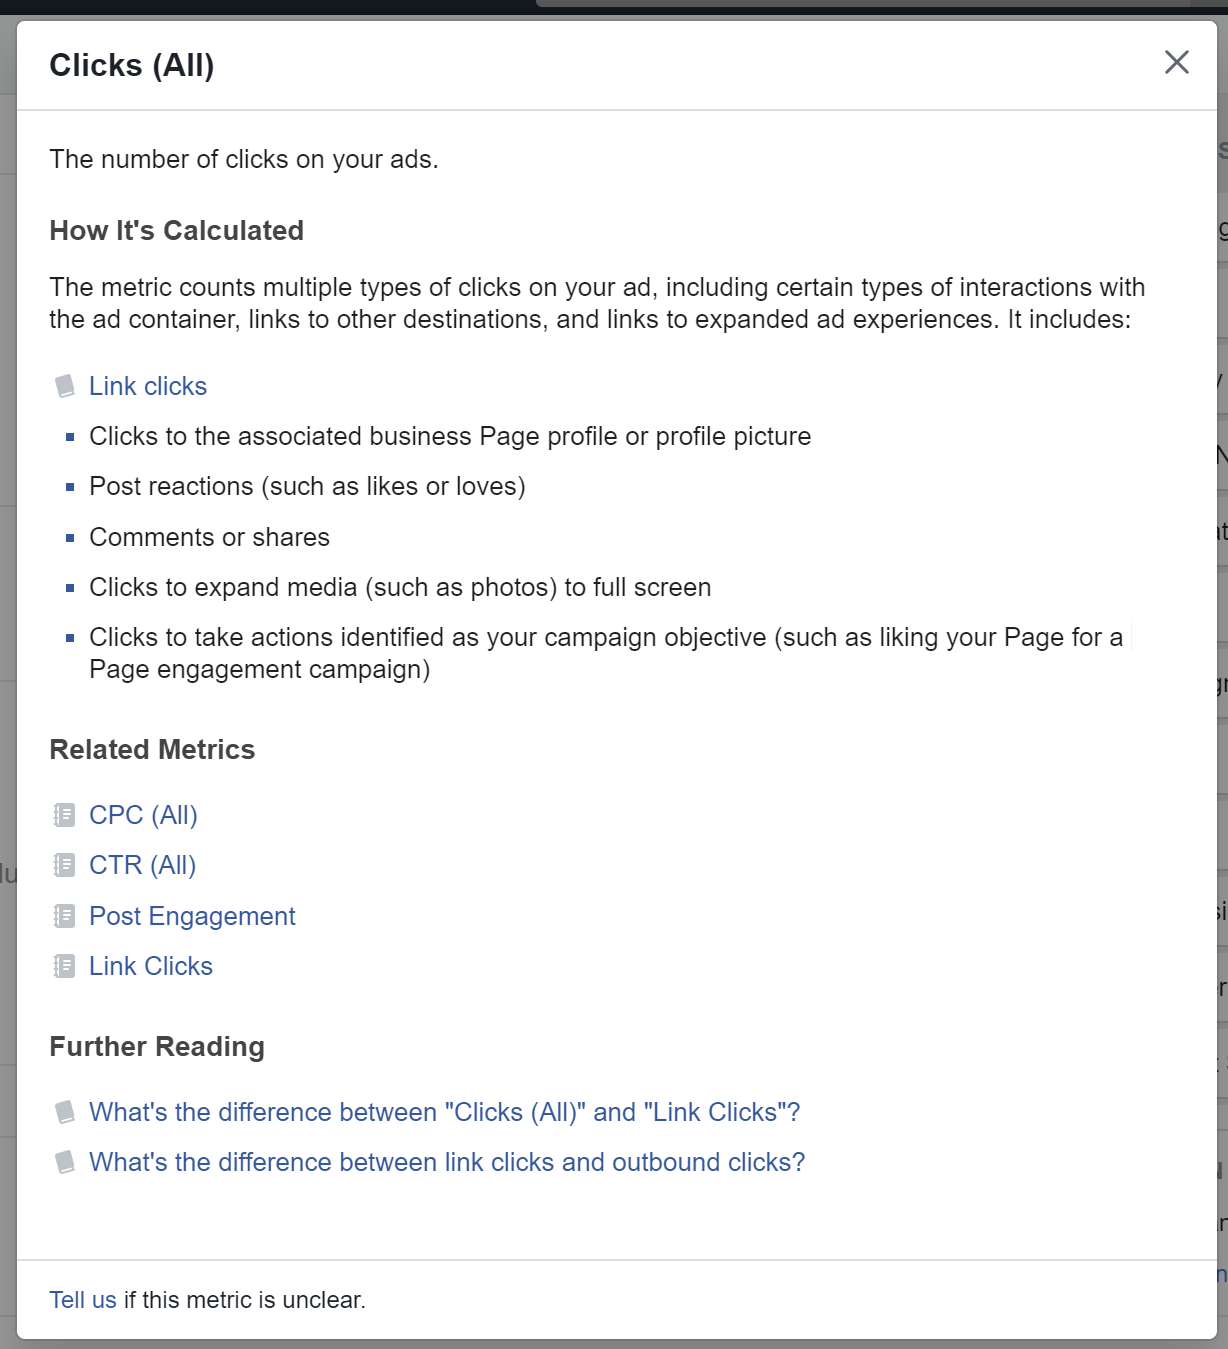
If you do paid advertising on Instagram, you should also include performance data for the ads you’re running. Metrics for paid and organic are different, but the names can be similar so it can be confusing. You might want to explain the difference to your audience when you present the report. For example, in regards to paid traffic, Reach is the number of people who saw your Instagram ads whereas in the organic case, Reach means the number of people who saw your posts. In addition to Reach, some of the paid Instagram KPIs you might include are Amount Spent, Cost Per Click (CPC), and Clicks (All).
You can find more precise definitions of these metrics inside your Facebook Business Manager account (Instagram advertising is done through Facebook using the
Facebook Ads Manager
). Below, you can see the definition that Facebook provides for Clicks (All).
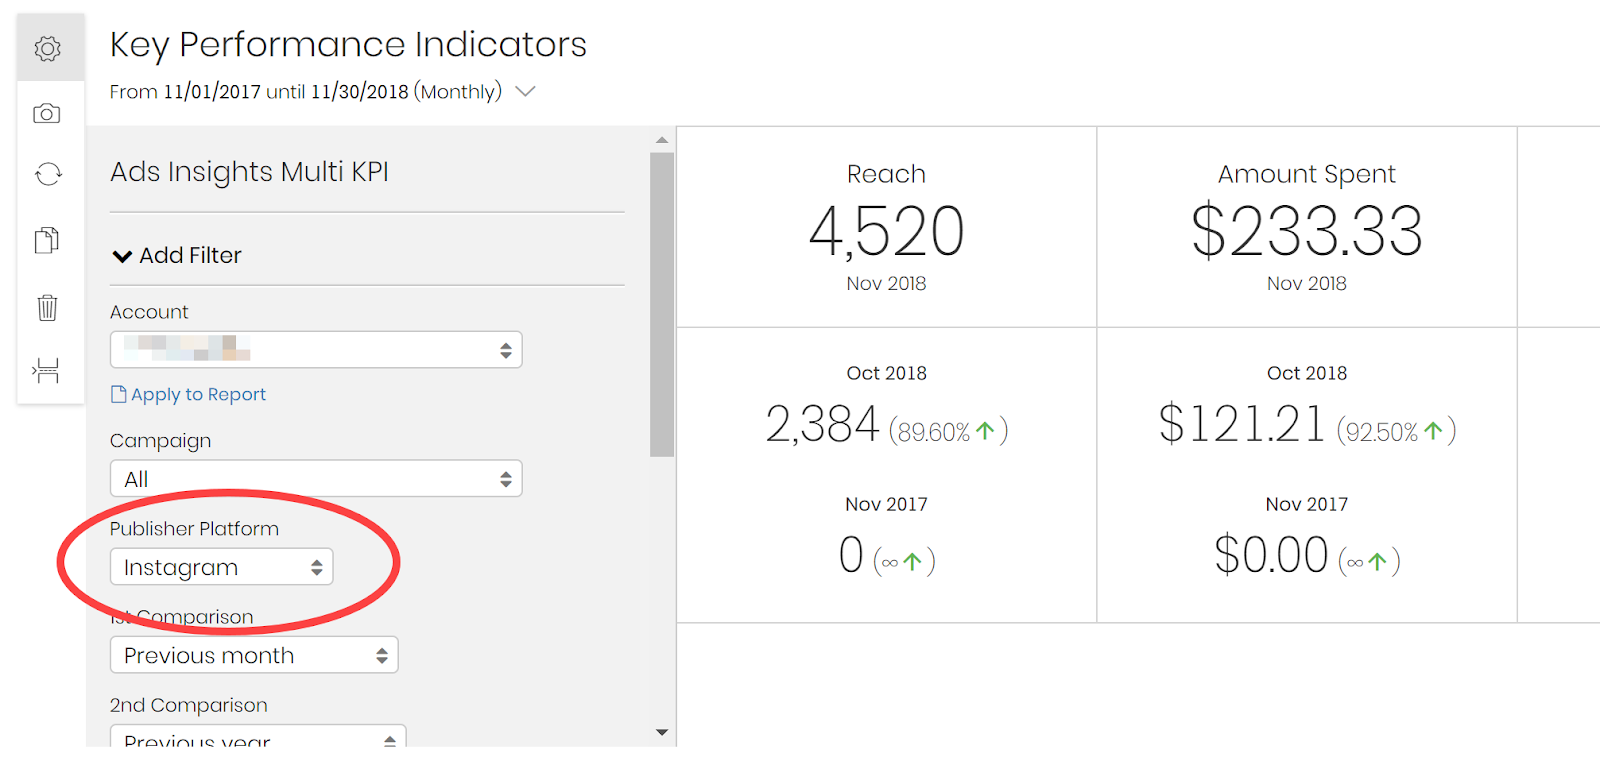
In the Megalytic reporting tool, to report on Instagram ads use the Facebook Ads widgets and filter Publisher Platform to Instagram as shown below. If you have questions about using Megalytic for Instagram reporting, feel free to contact
Megalytic support
- even if you aren’t a customer - and submit a help request.
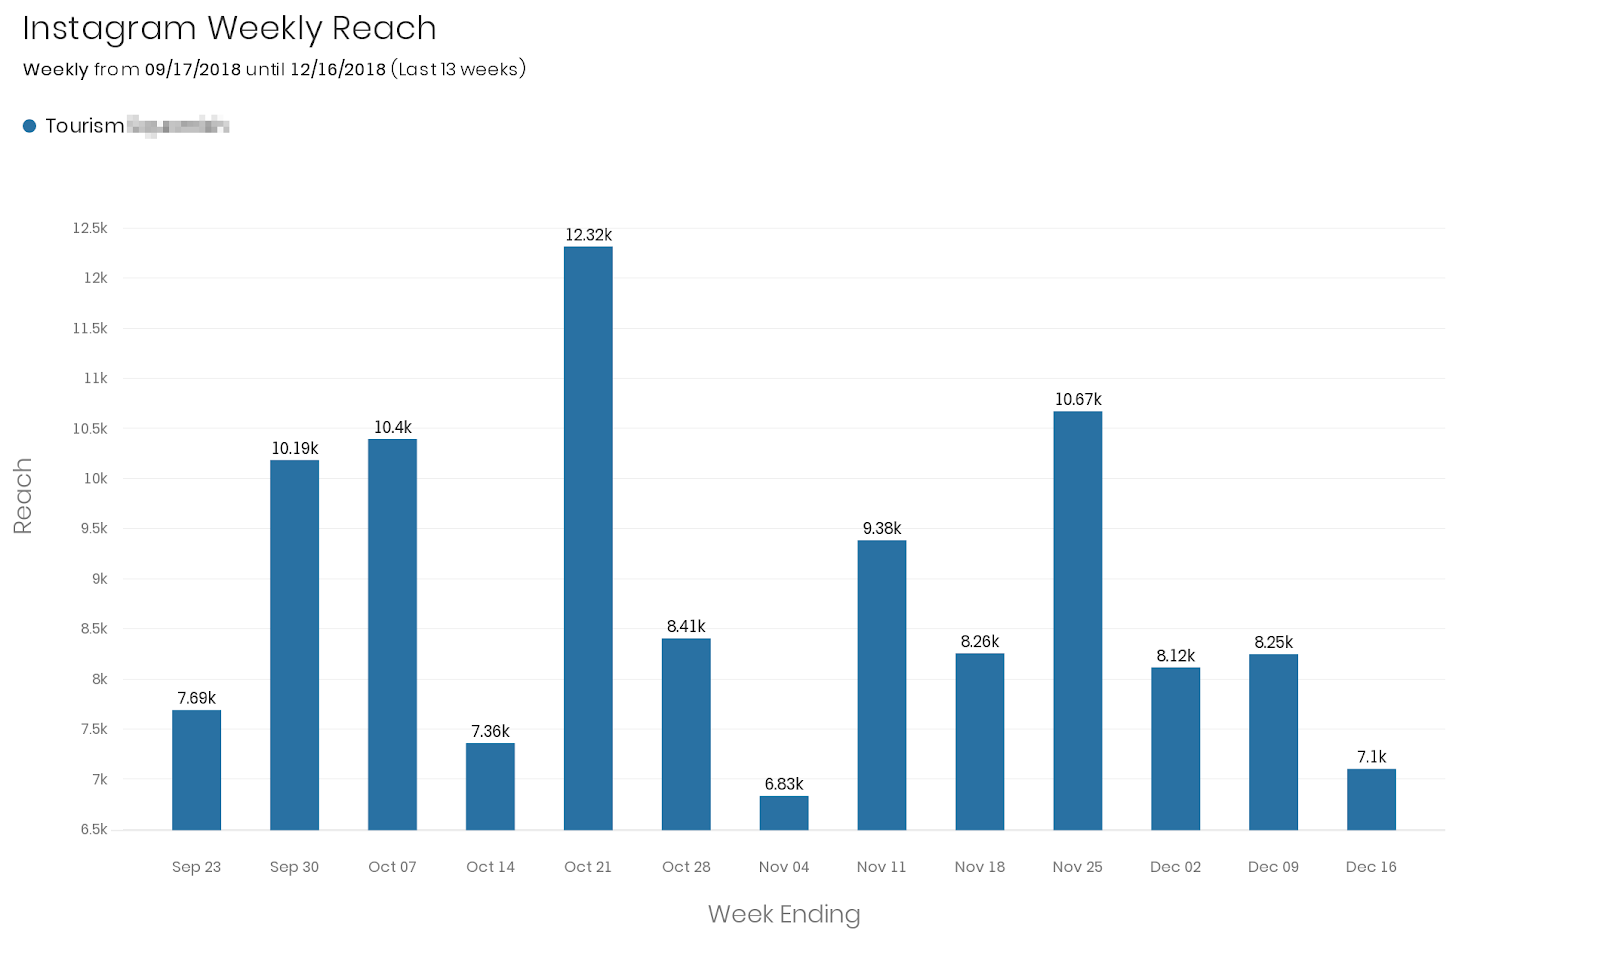
Instagram Weekly Reach
In addition to KPIs, a great place to start an Instagram report is by showing weekly reach. Comparing reach across the whole week can help display overall trends and whether certain strategies were successful. In the report notes, you can explain the ups and downs to your client.
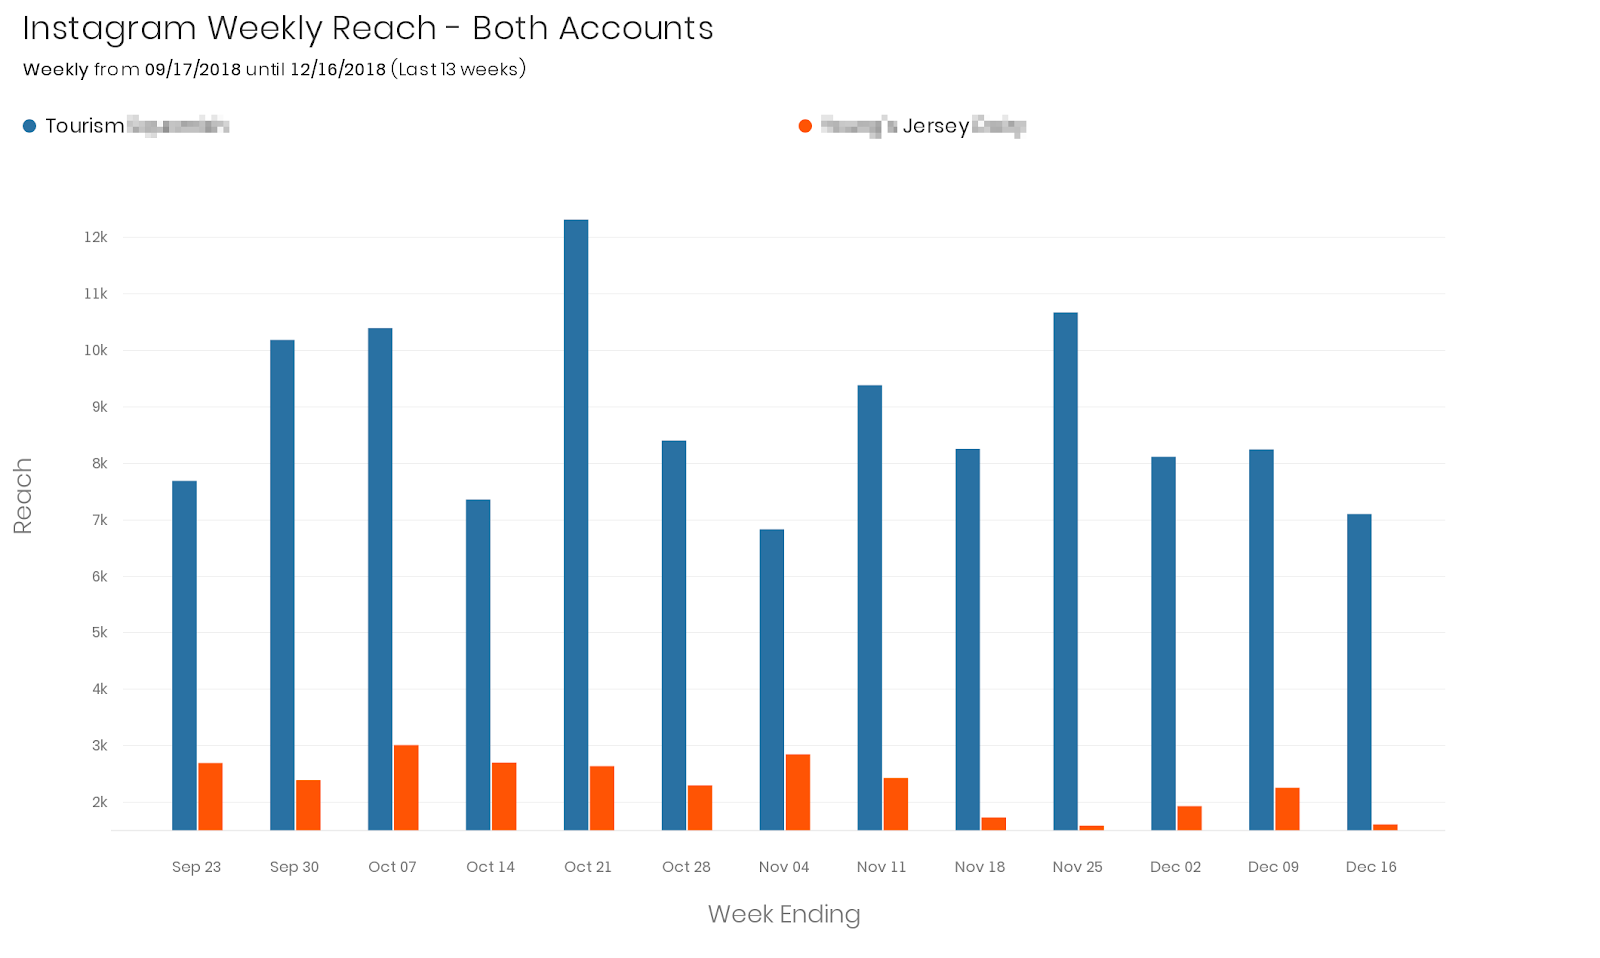
If your client has multiple Instagram accounts, you can compare them in the same chart, like the one below. Comparing accounts in the same chart can help show overall growth as well as demonstrating the reach of specific accounts if you are doing a related campaign.
Data Comparison
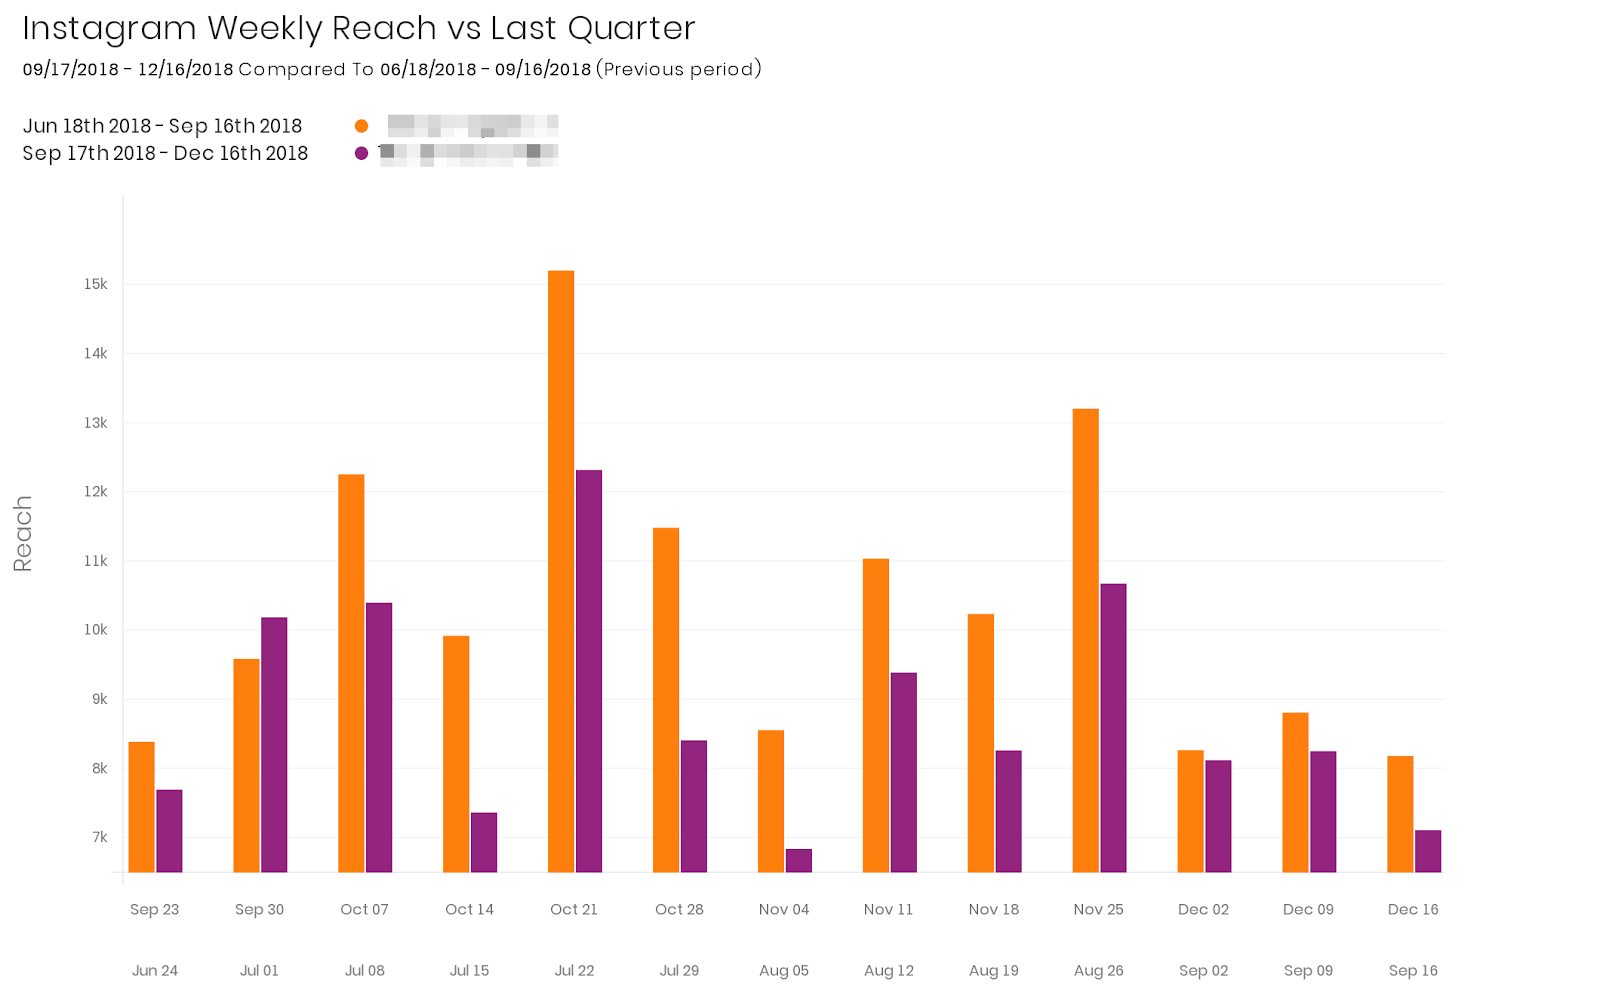
The reach of your Instagram posts is an important metric. Your report should also compare your reach with previous periods like last month, last quarter, or last year. Comparing performance can give you a better overall picture of how your Instagram account is performing, the relative success of campaigns, and a sense of growth from period to period.
The chart below shows the same weekly reach as the chart above (in purple) compared with the results last quarter (in orange). The orange bars are almost all higher, indicating that reach is overall lower this quarter vs. last quarter. This could indicate fatigue with a running campaign, a lack of diversity in new posts, a focus on other platforms, or a variety of other underlying causes - good and bad. Use comments (text) in your report to explain to the reader what a chart like this conveying.
Instagram Posts
After presenting the KPIs, it makes sense for your report to move on and talk about the social media posts that have been made recently on the client's Instagram page. Using Megalytic's Posts Published widget, you can provide a chronological listing of the recent posts with thumbnail images and some important metrics.
Here, we have decided to display the metrics Reach, Likes, and Comments.
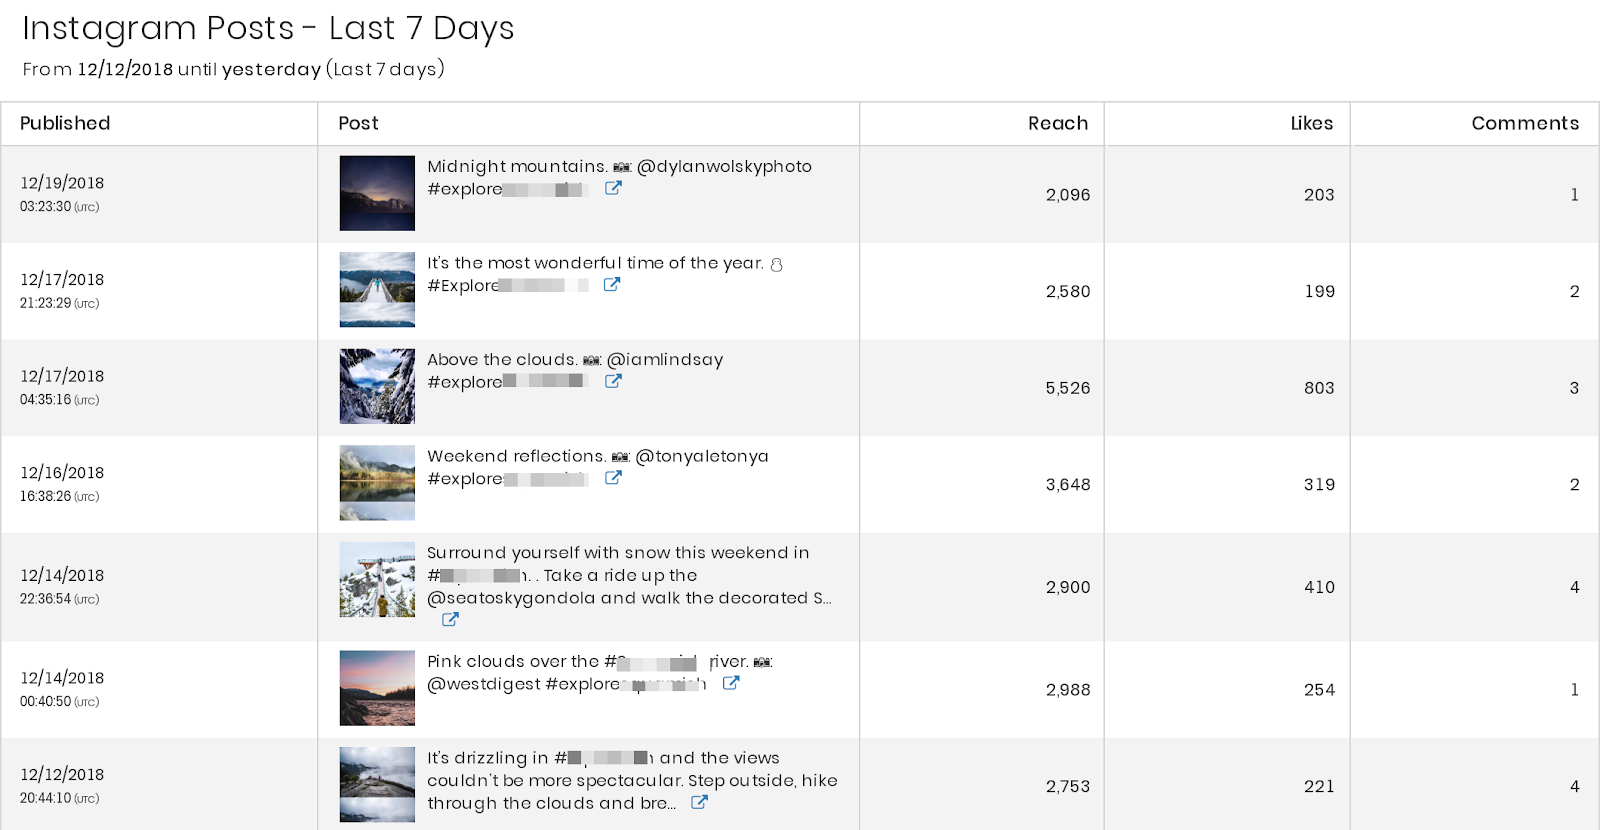
The Reach of each post is the times that post was displayed to unique users, while Likes and Comments are the total number of each interaction on each individual Instagram post. While Likes is often a larger number, Comments means more - it takes longer to leave a comment than to click a button! A large number of comments is a sign that people are really engaging with your content. Looking at the ratio of Reach to Likes to Comments can help you determine which types of posts are more successful - a post might have a lower Reach, but if it has a higher ratio of Likes and Comments, it’s clearly providing engaging content to the people it does reach.
Instagram Audience Segmentation
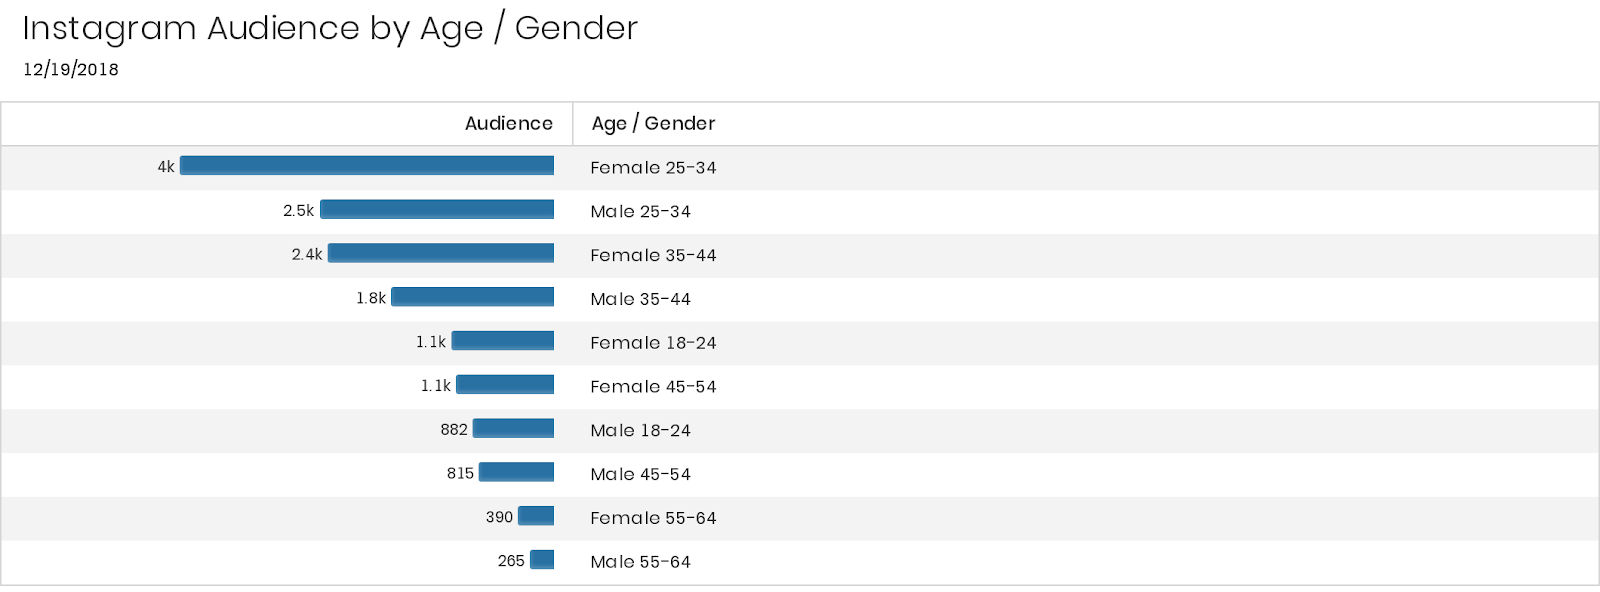
In addition to tracking aggregate metrics like reach, it can also be useful to include demographic information such as age and gender in your report. If your marketing is targeting a specific demographic, you’ll want to know how your posts and ads are doing in those categories. It can also be useful to know if your work is excelling in a demographic you didn't anticipate so that you can properly address that group.
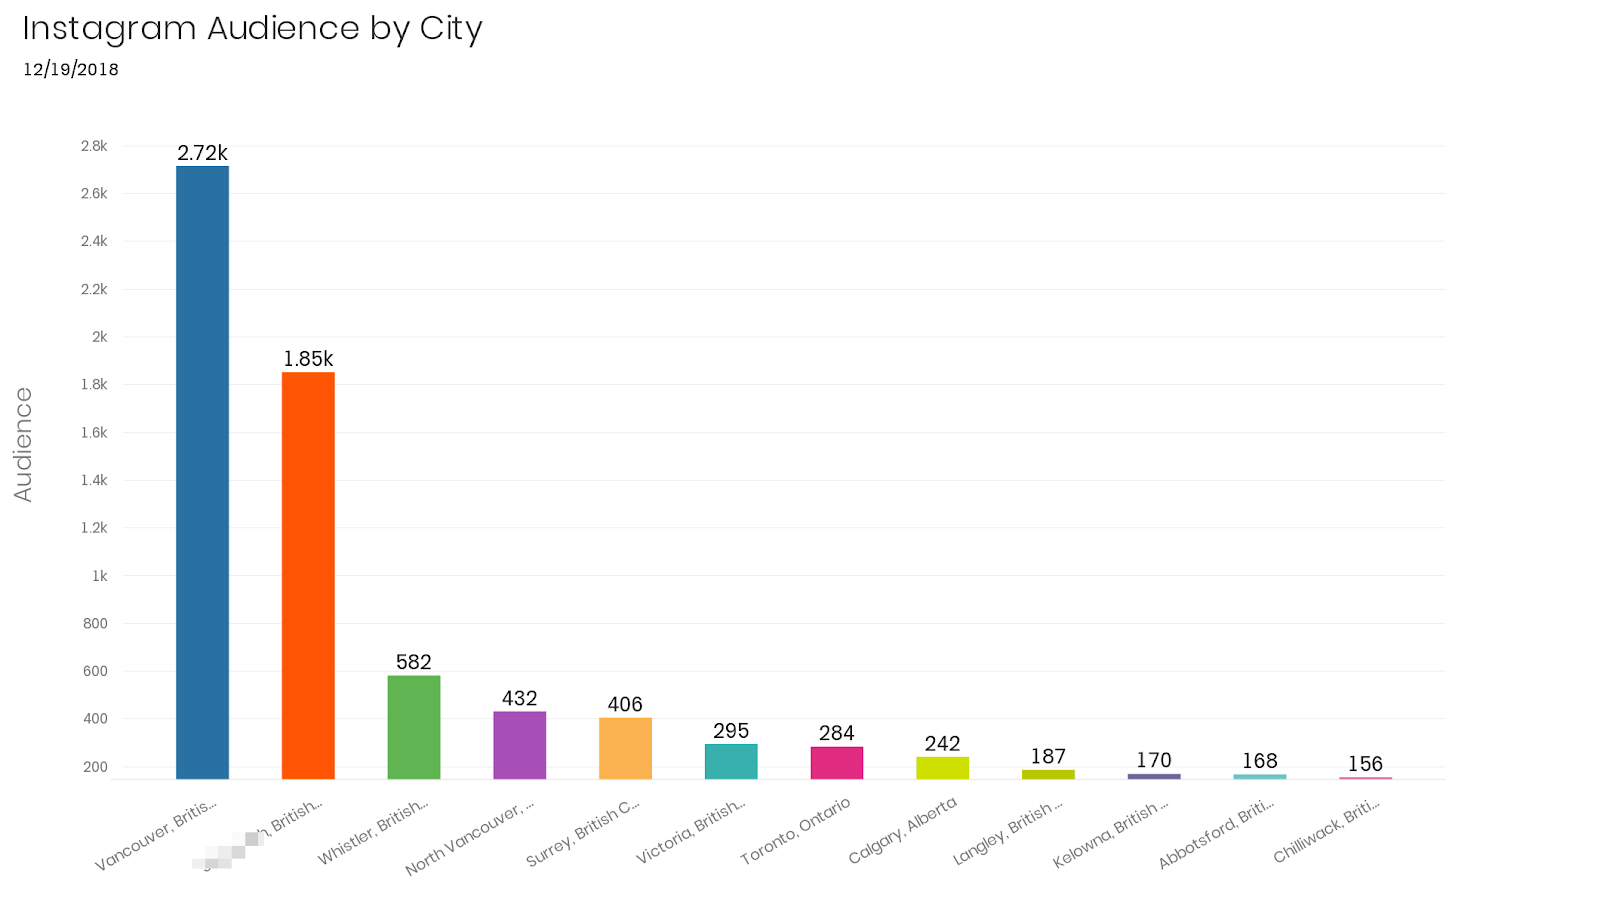
Age and gender shouldn’t be the only breakdown you showcase. Depending on your objectives, you may want to focus on city, country, and locale, for which Instagram also provides segmentation. A breakdown by city is useful if one objective of your report is to track how well your brand is doing in particular local markets.
In the graph below, the audience is mostly from cities in British Columbia, Canada. However, it also shows significant engagement from Alberta and Ontario, with Ontario slightly higher. If this brand is looking to expand into those regions, this chart could help them demonstrate opportunity.
When Are Your Instagram Followers Online?
The timing of your Instagram posts is an essential component of proper social media marketing. You’ll want to know when your followers are online and likely to see the post before it gets pushed down the feed by newer content.
In your report, you can include a chart such as the one below for an advertising agency, demonstrating when followers are online by hour:
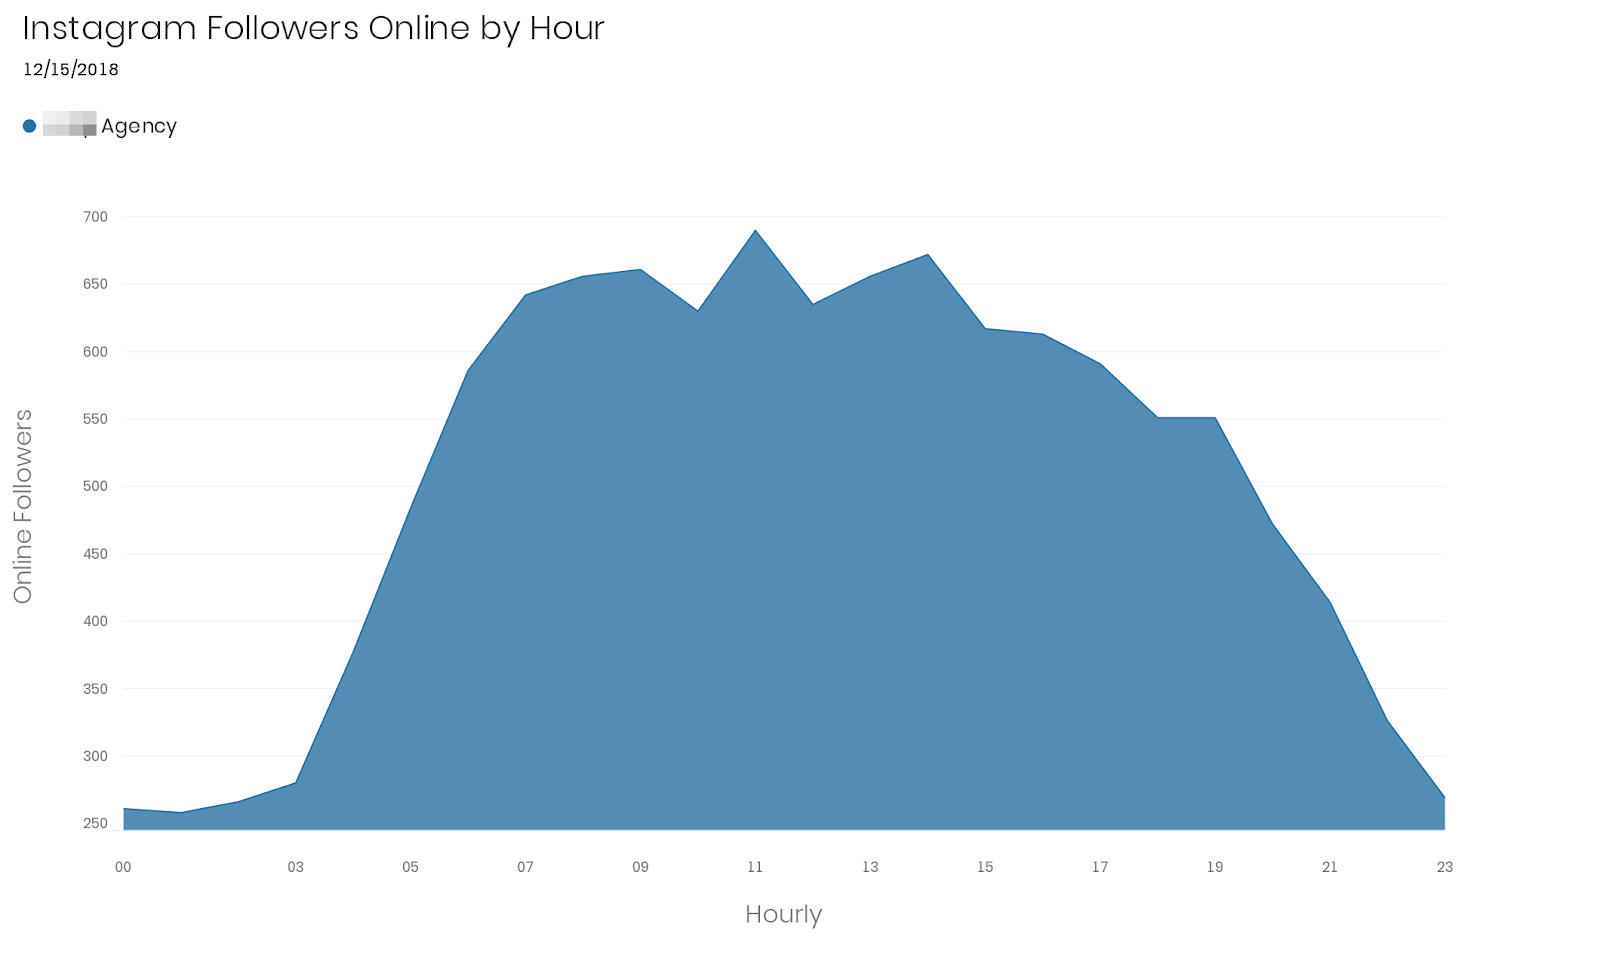
You can see that the busiest hours are 7AM - 4PM and that the audience drops off steeply after 7PM. That makes sense for a business, but for another type of account, such as a celebrity Instagram account, you might see more followers online in the evening. An account with parenting tips might see more traffic earlier in the day rather than later.
Conclusion
Regular Instagram reporting is an important part of communicating with your clients and colleagues. The data visualizations presented here can be assembled into a template for Instagram reporting in your business, which will help to make regular reporting easier. Instead of designing a new report each time, you can reuse a template that contains 90% of what you need, and tweak it as necessary with new data and conclusions. Templates can help with onboarding new accounts as well as managing a large number of Instagram accounts without taking too much time from your staff.
Megalytic offers a
14-day free trial
with which you can create templates for Instagram reporting and more. Even if you don’t use Megalytic, this blog post can serve as an outline for your Instagram reporting efforts. The KPIs presented here can help you provide a well-rounded dataset and digestible conclusions on a weekly or monthly basis.