
May 21, 2024
An Example Facebook Marketing Report for Agencies
By Megalytic Staff - September 08, 2016

Facebook Ads Widgets
Marketers are increasingly finding value in Facebook Ads because of the relatively low costs and powerful targeting options. In addition, the platform offers an immense array of metrics to track success.
There’s a lot to look at there, so first, let’s quickly review the three widgets available in Megalytic for Facebook Ads. You’ll find them under a section labeled accordingly in the widget selector.
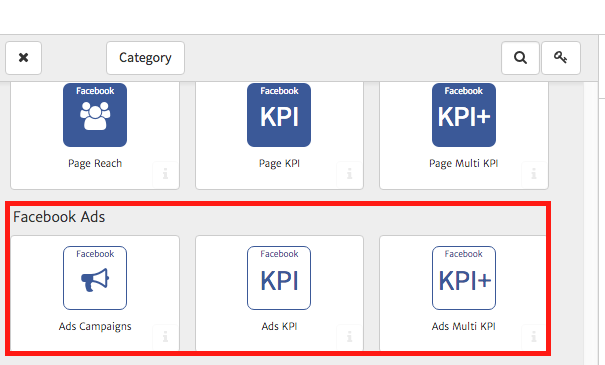
The Ads Campaigns widget offers flexibility to break down metrics on the level of campaign, ad set, ad or account. You can use the default table, bar graph, line chart, pie chart or other chart formats.
The Ads KPI lets you pick one metric to compare with a previous month and previous year. Finally, the Ads Multi KPI lets you pick up to four metrics to compare with past periods.
Now that we have that out of the way, let’s get started showing elements to include in a Facebook marketing report.
Building an Example Report
At the top of the report, use a Notes widget to summarize the findings you’re about to present. Highlight key numbers that are up or down, call out successes and offer explanations or forward-thinking solutions for negatives. Next, you can launch into showing the actual numbers.
Showing KPIs
Generally, you’ll want to highlight KPIs (key performance indicators) at the top of your report, placing brief, important metrics where executives are most likely to see them. Stakeholders may not take the time to look at detailed breakdowns of performance by ad sets but will want to see overall performance trends. We recommend starting with the Multi KPI widget to show multiple metrics along with comparisons to past periods of time. You can look at data on a daily, weekly, monthly, quarterly or yearly level with the KPI widgets.
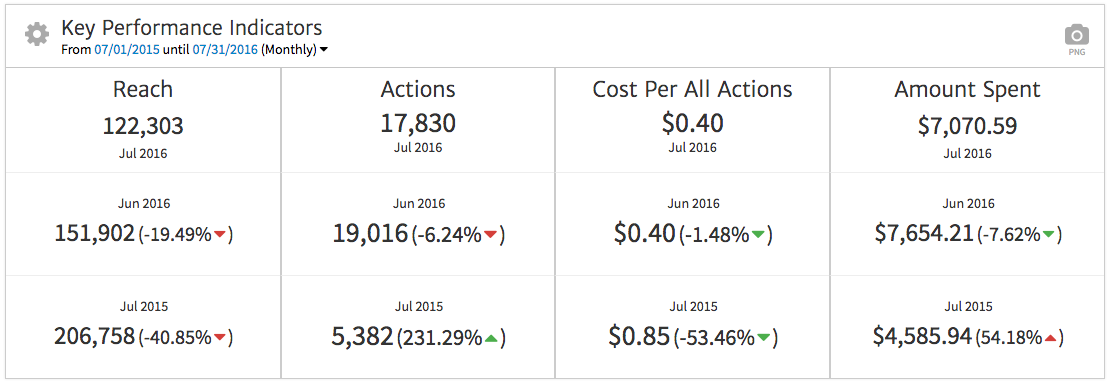
Here, we’ve highlighted reach (total number of individuals exposed to ads) and actions (total number of clicks, likes, comments, shares, or other activities taken by people exposed to ads). Next, cost per action points to efficiency of ad budget in driving activity, while total spend shows how a budget has increased or decreased vs. previous periods.
You can add as many KPI widgets as you want in order to show a different timeframe or to highlight more than the four metrics that fit into one widget. For instance, in addition to highlighting actions, you may want to focus on metrics related to unique clicks.
Click the gear in the upper left of the widget to access options for editing. Next, scroll down to the Metric dropdown to select the metrics you’d like to include. Here, we’re selecting multiple metrics related to Unique Clicks.
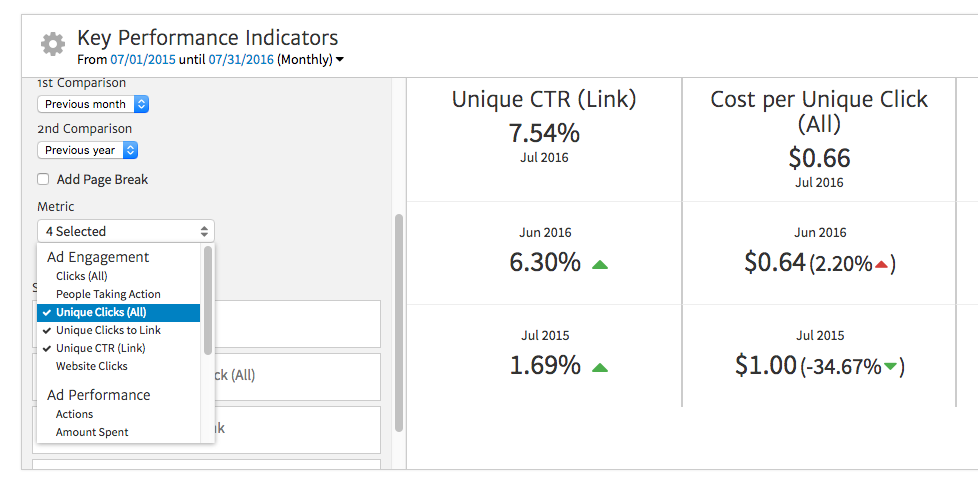
Once you’ve chosen your metrics, click “Apply Selection” right below the dropdown to update the widget. You can also click and drag the current metrics listed beneath the dropdown to change their display order within the widget.
Perhaps you also want to call attention to a single metric; for instance, a boost in campaign spend may have driven up website clicks in the last week of a reporting period. In this case, you can use the Ads KPI widget to highlight a single metric. A Notes widget above the KPI widget can provide further explanation about which specific actions helped to drive the increases.
Summarizing Campaigns
Next, use the Ads Campaigns widget to show performance by campaign. In the default view, you’ll see a table listing campaigns, along with key metrics for each.
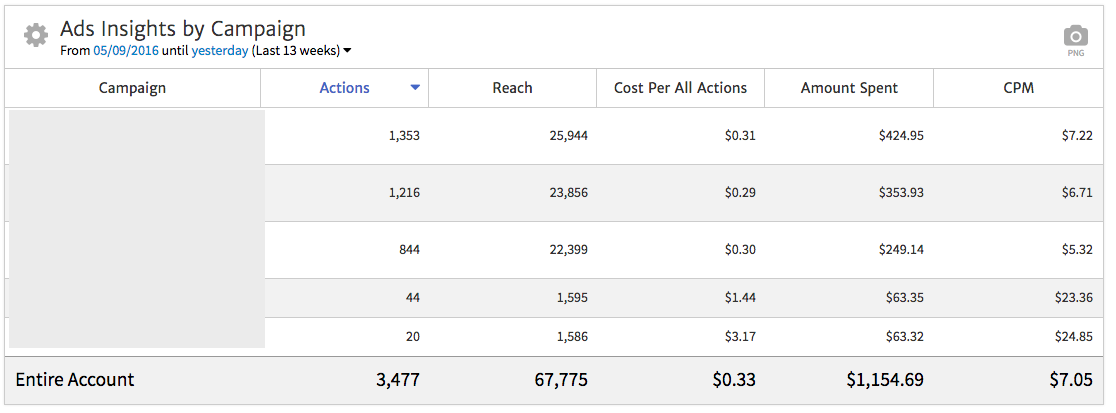
In this example, we’ve sorted campaigns by those driving the most Actions, in addition to showing Reach, Cost Per All Actions, Amount Spent, and CPM (cost per thousand impressions). If we want to show other metrics, we can go to the widget options and select the ones we want to include. This customization of this widget is similar to that of the Multi KPI widget.
You can also change which dimensions you show in your report, showing data by Account, Campaign, Ad Set, or Ad. For instance, if you’ve broken up ad sets by targeting, you may want to show performance that way so your client can see how well each audience performed.
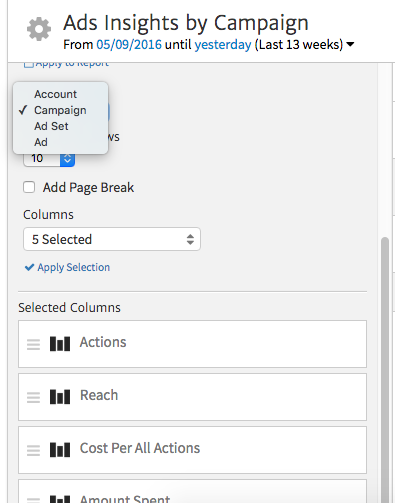
You can also change the number of rows if you want to show a larger quantity of campaigns or other items here.
Graphing Long-Term Data
In addition to breaking down metrics in tables, you can also use graphs to show longer term patterns. For instance, you may want to show how clicks have trended over time. In the example below, we’ve switched the chart type to an Area Chart, choosing Clicks (All) and Unique Clicks to Link as the series. This way, we can show total clicks along with a narrower view of how many link clicks came from distinct individuals.
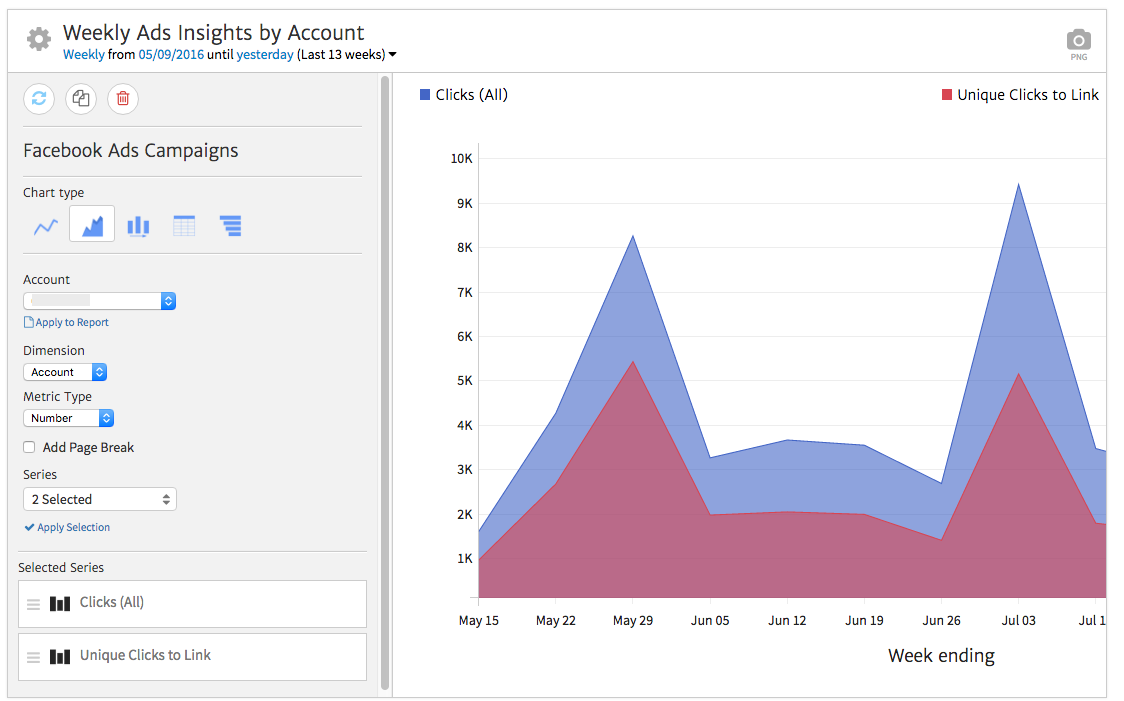
Once again, a Notes widget can help to highlight further details. Any strategies that may have resulted in traffic spikes deserve more details. In this instance, we can correlate these metrics with heavy promotion times for blog posts.
Comparing Ad Sets with a Bar Chart
A bar chart will allow you to quickly show performance of multiple ad sets, comparing how effective each set was in generating a response from its intended audience. For instance, in this example, we show CTR (clickthrough rate) by ad set.
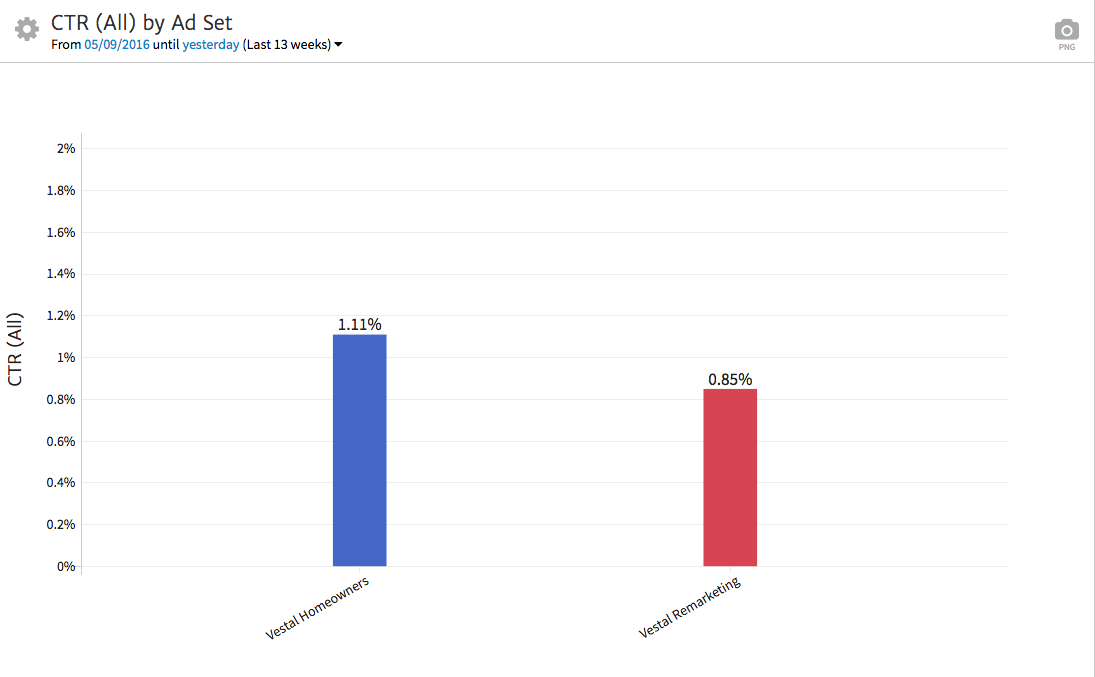
For this campaign, targeting ads for an HVAC campaign, we set up one ad set to reach homeowners within the desired income ranges in the region. The second ad set targeted past website visitors via remarketing. Interestingly, this data shows a better response from a fine-tuned ad set utilizing Facebook’s audience criteria than the other specifically reaching the client’s website visitors.
Any data that you include in the report should tie into observations and recommendations you make to your client. For instance, this CTR observation could lead into a conversation about the value of Facebook’s built-in targeting criteria, as well as an optimization goal or new ad content ideas to better refine remarketing audiences.
Conclusion
Facebook Ads integration has taken reporting with Megalytic to a new level, and we’re excited to give you a guide to get started. If you run Facebook Ads for your clients, take some time to test the new widgets in your reports. You’ll find opportunities to save time and to point out key metrics in order to improve your reporting process and your relationship with your client.
Also, tell us in the comments how you’re using Megalytic’s Facebook Ad reporting widgets, we want to learn from you, too!