
May 21, 2024
4 Uses for Spreadsheet Integration in Megalytic Reports
By Megalytic Staff - August 11, 2016
Using the CSV Widget
To incorporate spreadsheet data into your reports, use the CSV widget. You’ll find this under the “External Data” section in the list of widgets, although you can also use the search bar.
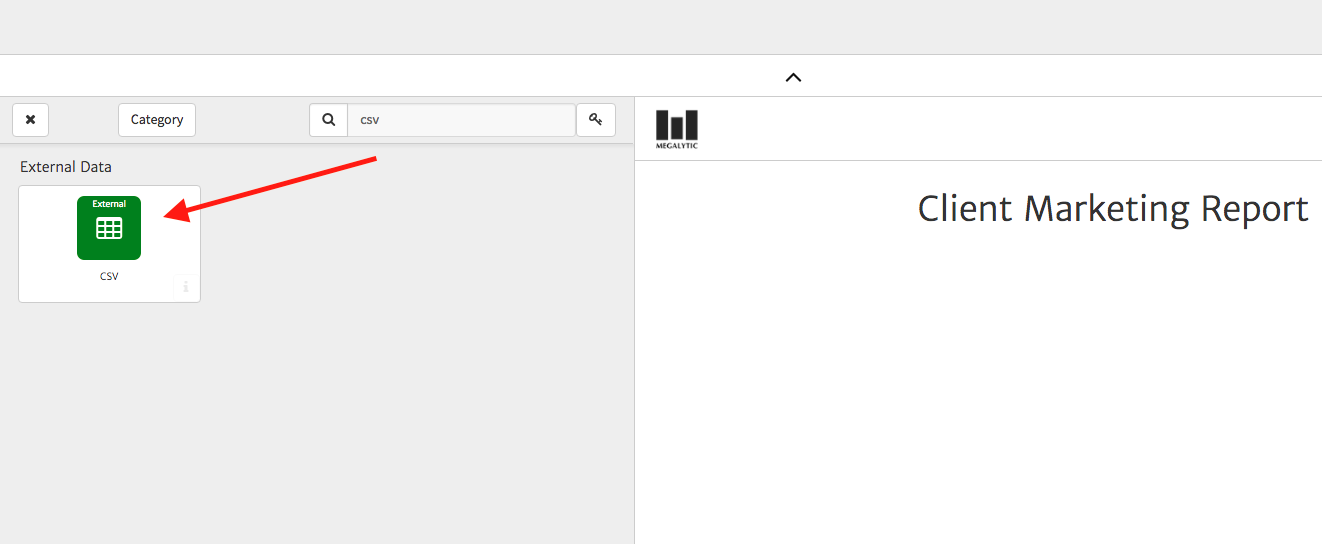
When adding the widget, you’ll see a prompt to upload a file. Before uploading, note if you have column headings in your document or not. For instance, you may have a header row with columns titled Leads, Cost Per Lead, etc. Check the box if your document has headings that you’d like to include in the widget.
For more details on using the CSV widget, including how to link to a file in Google Drive, see our article on How to Show Spreadsheet Data & Images in Megalytic . In this article, we’ll delve into four possible uses for spreadsheets in your reports.
Showing Lead Performance
While you can show conversion data directly from Google Analytics and AdWords in your reports, sometimes that’s not enough for a complete picture of lead performance. In a lead generation model, a conversion doesn’t necessarily mean a close. You may have additional data on which web conversions led to sales.
Aside from that, there are numerous other reasons you may have additional information pertaining to web lead success. You may filter through leads to exclude duplicates or those that were unqualified. In addition, you may track lead revenue from offline interactions. Compile the data into a spreadsheet and export as a CSV, which you can then include in your reports. You may also be able to export this data directly from your CRM, depending on the system you’re using and what level of tracking you’ve included there.
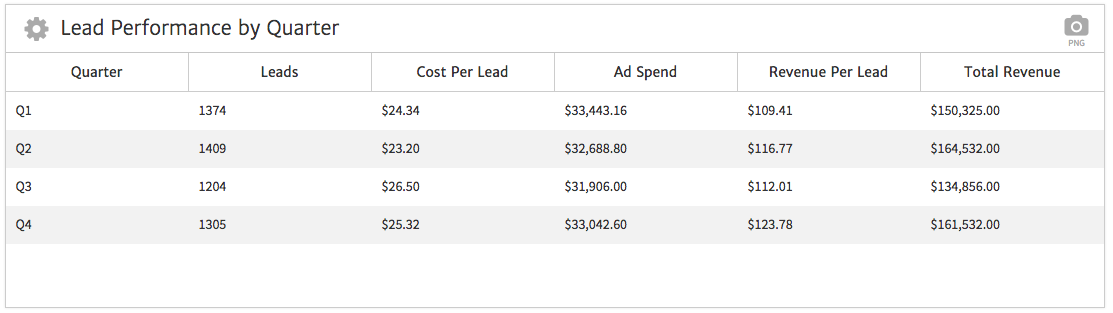
In this example, we’ve compiled data for lead acquisition costs and revenue over the course of a year. We can compare total ad spend and see return on investment all in the same table.
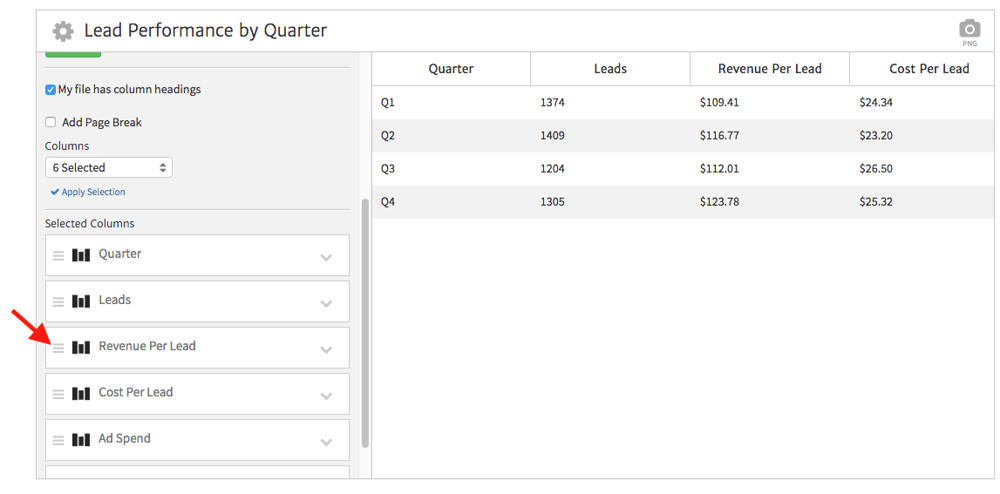
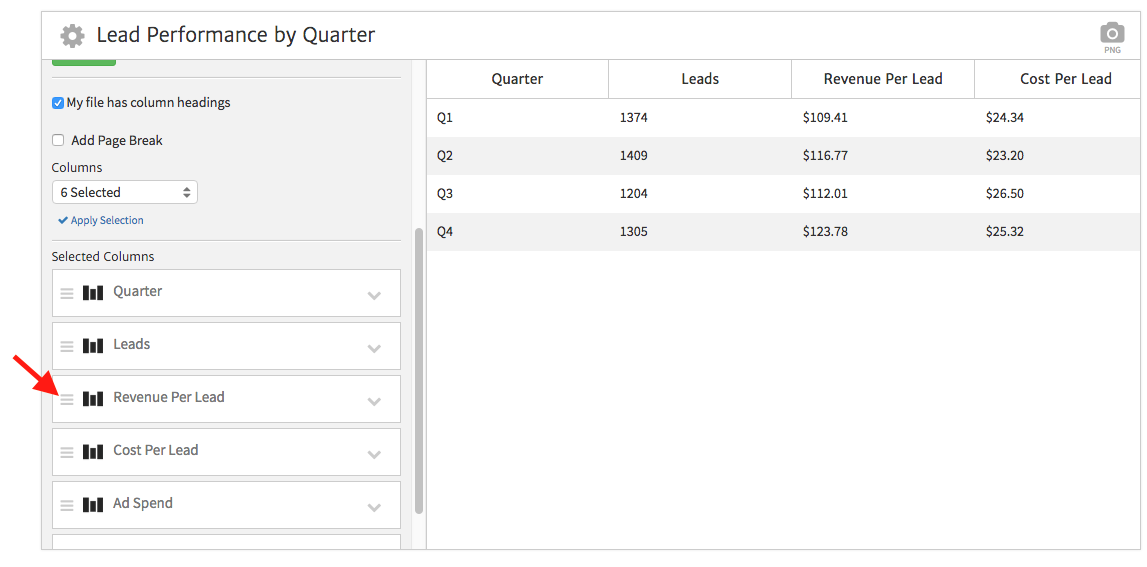
Now, say that we want to put “Revenue by Lead” right next to “Cost Per Lead” to more effectively contrast these metrics. That way, the client will notice right away that the level of return per lead was significantly higher than what they paid to acquire a lead.
Click the gear in the upper left to see the widget options and scroll down to the list of columns. Now, click on the set of lines at the left of each column to drag it up or down. You can also adjust column width just by dragging the column lines left or right within the widget.
Showing Organic Keywords
While you can show query data from Search Console in your reports, including rankings, average position, clicks, and impressions reported by Google, at times you may want to manually assemble keyword data for reports. For instance, you may want to select certain representative keywords for a particular service or region or pull rankings from a source other than Search Console.
In this example, we’ve customized a spreadsheet comparing organic ranking data from the beginning of the quarter to the end of the quarter, showing change over time. We picked specific regional keywords related to pest control services offered by this client.

Once the widget is in place you won’t be able to change the order of the spreadsheet, so you’ll want to sort your spreadsheet to show your desired display order before uploading it to the report. For instance, in this example, we wanted to highlight keywords related to Fort Myers at the top of the widget, and so we placed these on top in Excel before saving the file.
Showing Data from Other Ad Platforms
While Megalytic currently supports direct integration with Google AdWords and Facebook Ads, some digital marketers may be working with other online ad platforms. For instance, say that we’ve been using Twitter Ads to promote a client’s content. We can export data into a spreadsheet, pare it down in Excel to what we want to show in a report, and then upload it to a CSV widget.
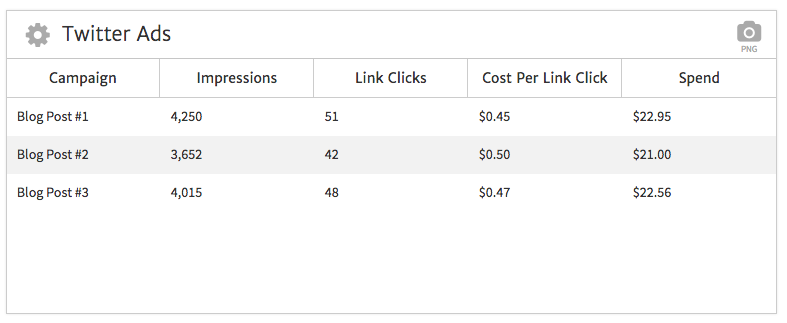
Now, we have a neat table showing data from Twitter Ads campaigns. Thanks to the spreadsheet capability, we’re able to include custom metrics, such as the “link clicks” that Twitter counts only when a click occurs to website link (as opposed to clicking through to a Twitter account).
Showing Call Tracking Performance
Many digital marketers use call tracking platforms such as CallRail, IfByPhone, or Marchex to attribute phone calls to web-based sources. Especially for service-based businesses, many leads arrive via phone by people who want to speak with a “real” representative right away as opposed to filling out a form and waiting for an email.
These systems allow websites to utilize custom phone numbers to track the source via which a person came to the site (e.g., organic search vs. paid search). These programs also allow for the creation of unique numbers to monitor the success of offline marketing pieces like direct mail. You can view call performance, including the number of unique callers for each source in a timeframe, as well as marking which ones were valid leads.
To show call tracking data in reports, you can download a spreadsheet from the call tracking system you use and format that for your report. For instance, you may want to filter the spreadsheet to only include first time callers who were marked as valid leads, if the system you use allows for that capability.
![]()
Now, you can show the calls in your report, broken down by source. In this example, we’ve even included a comparison to a past date range for perspective on what numbers have gone up or down. This data will help to provide a fuller picture of lead attribution beyond simply showing website form conversions in Google Analytics.
Conclusion
We’ve given you four specific possibilities for using spreadsheets to show extra data in your reports, but there are many more opportunities to utilize spreadsheets to account for the performance of other aspects of a marketing campaign. This widget can be used to provide data on link acquisition, PR placements, media buys and any other circumstances where non-analytic metrics may deserve to be highlighted outside of a notes field. When you need to include custom data beyond what’s in Google Analytics or other platforms that directly integrate with Megalytic, the CSV widget is here for you.
We’d love to hear from you on how you’ve incorporated spreadsheets into your client reporting. What data sources have you been able to work in to show more details about metrics to your clients? Leave a comment to discuss!