
May 21, 2024
Translating Business Goals to Analytics Goals
By Megalytic Staff - June 27, 2014

List Your Business Objectives
The first step to creating meaningful analytics goals is to really identify the core objectives of your business.
Start by creating a list of your organization’s high-level action items or desired outcomes. Don’t worry too much about how you are going to measure them right now. Just make a list and get everything down on paper. It’s not a bad idea to talk to your boss or other people on your management team to get their input, as well. Ask them to identify what they believe are the three most important objectives for the business over the next 6-12 months.
If you work for an agency, and are creating measurement goals for a client, hold an internal meeting with your team members who are familiar with the account and ask them the same question - “What are this client’s three most important business objectives for the next 6-12 months?”
Once you’re confident you’re on the same page internally, bring the client into the discussion and talk directly with them. Let them know you are working to better align web analytics with their specific business objectives and get their input on what they believe they are. This is a great opportunity to learn more about your client, in their own words, and to also make sure both parties are approaching the campaign with the same objectives. You also insert your company as your client’s partner in business.
What are some of the business objectives you might end up with after this exercise?
- Increase shareholder value
- Grow our online community
- Increase revenue from online sales
- Grow business from repeat customers
- Better leverage social media
The next step is to break these down into measurable business goals.
Break Down Your Business Objectives into Measurable Goals
Business objectives are often qualitative , like “Better leverage social media”. Measurable goals are quantifiable , like “Increase the Twitter retweets and Facebook likes for our blog content”. That’s quantifiable because we can measure the number of retweets each month and report if it is increasing or decreasing.
To create analytics goals, we must first break down qualitative business objectives into measurable goals. Start by looking over each business objective and, if necessary, rephrase it using terms that are quantifiable.
Once you have a list of measurable goals, review it and think about which of the items on the list can be measured using web analytics. For example, “Increase revenue from online sales” is a good candidate for translating into an analytics goal. Online sales can be measured with Google Analytics Ecommerce Tracking.
On the other hand, “Increase shareholder value” is not a great candidate. We cannot measure shareholder value with web analytics. In this situation, we can break down this goal by listing some drivers of “shareholder value” that can be measured using web analytics.
- Increase revenue per online customer
- Reduce the cost of acquiring new online customers
- Increase growth of weekly online subscription signups
Once you have broken down the objectives into measurable goals, you should produce a final list.
In our case, the list looks like this:
- Increase revenue per online customer
- Reduce the cost of acquiring new online customers
- Increase growth of weekly online subscription signups
- Grow the number of weekly users interacting with our blog content (online community)
- Increase revenue from online sales
- Increase revenue (grow business) coming from repeat customers
- Increase traffic (better leverage) from social media

Create Analytics Goals from your Business Goals
In order to create analytics goals, we need to look at each of the business goals and identify what part of it is measurable using web analytics.
If you look at each goal, you will notice that there is usually something to measure, and an action specific to the measurement that defines the goal. To produce the analytics goal, we focus first on what is being measured.
For example, consider #3, “Increase growth of weekly online subscription signups.” Here, we want to measure “online subscription signups.” We will worry about the “increase growth” part of this business goal, when we look at actionable insights.
To create the analytics goal for “online subscription signups,” have a look at your website and go through the subscription signup process. Most likely, there will be a “Thank You” page that you can use for defining your goal.
Creating a goal from a Thank You page
For example, when you fill out the subscription page for the ClickZ newsletter and click submit, you see this:

At the top, I have circled the URL of this Thank You page. If you were creating the analytics goal for measuring subscriptions to the ClickZ newsletter, that would be the URL that you used to define your goal.
Once you know the URL, go into Google Analytics, under Admin > Goals and click “+ NEW GOAL”. The screen will look like this:
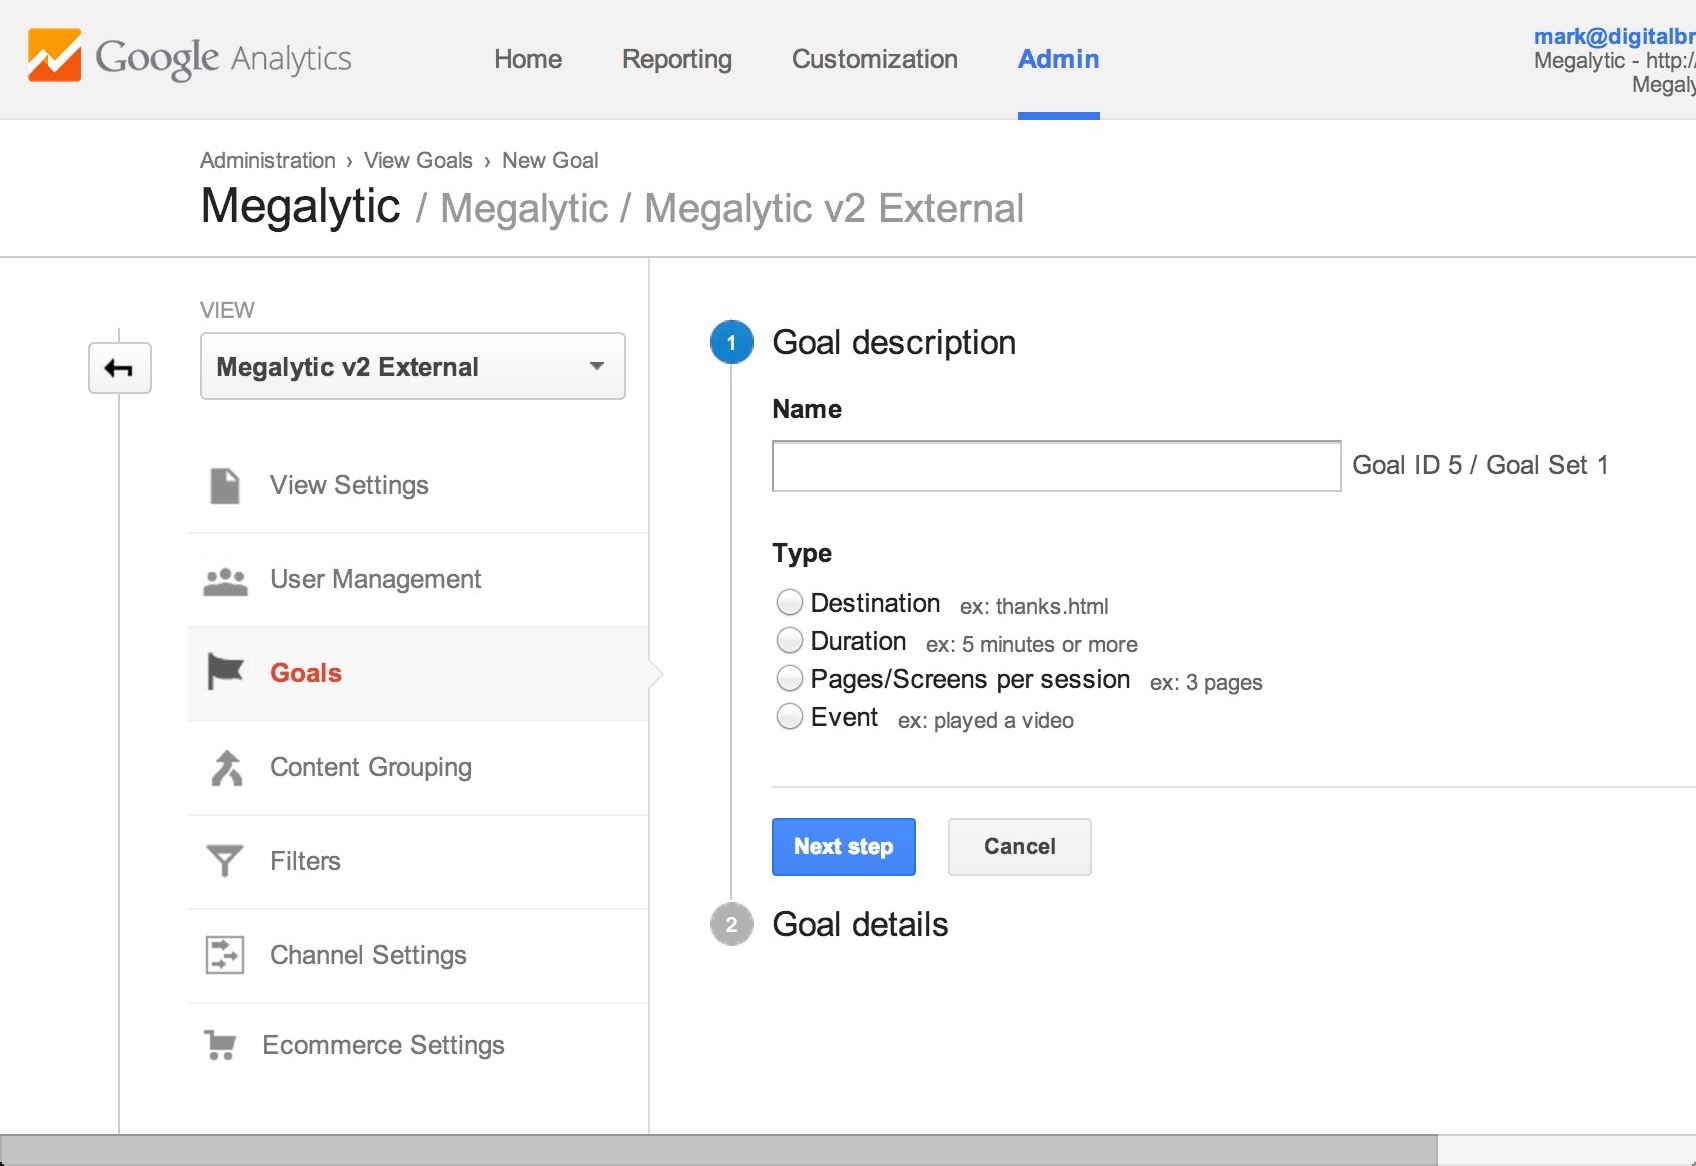
Enter a name for the goal – like “New Subscription” and click the option labeled “Destination.” That’s the type of goal used for a “Thank You” page. Then click “Next step”.
On this page, enter the page path of the URL of the Thank You page, as shown below.
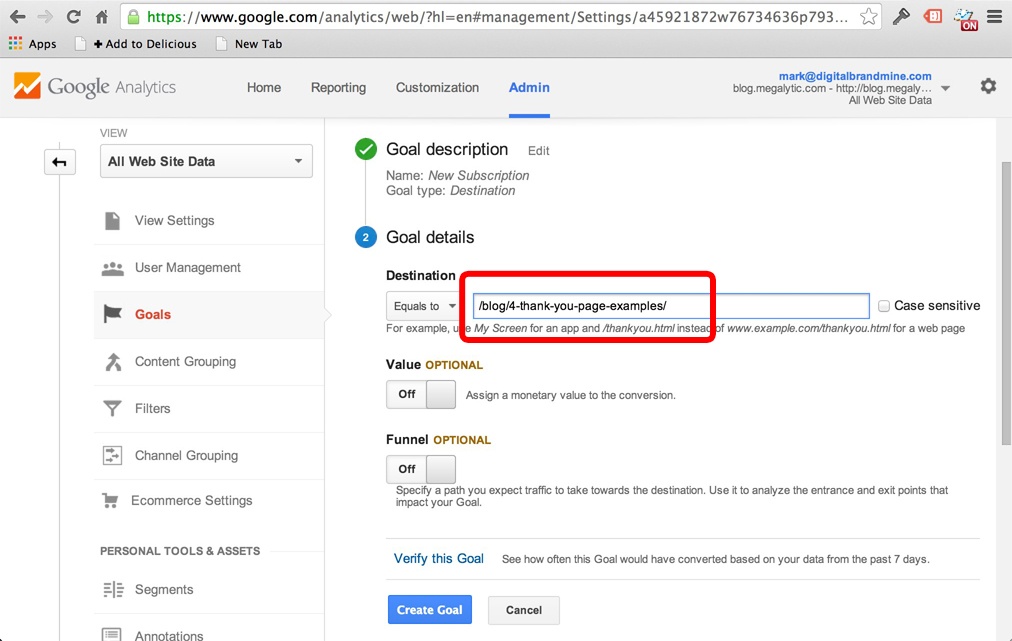
As you can see on this page, there are some additional options you can take advantage of when defining a goal. You can assign a value; and you can create a funnel. We are not going to use these options in this discussion, but if you are interested in learning more about them, see Google’s documentation for Set up, edit, and share Goals .
What if there is no Thank You page?
More and more, the traditional Thank You page is being replaced by a window overlay, which does not have a dedicated URL. Below is an example of the confirmation that appears when you sign up for the Megalytic newsletter.
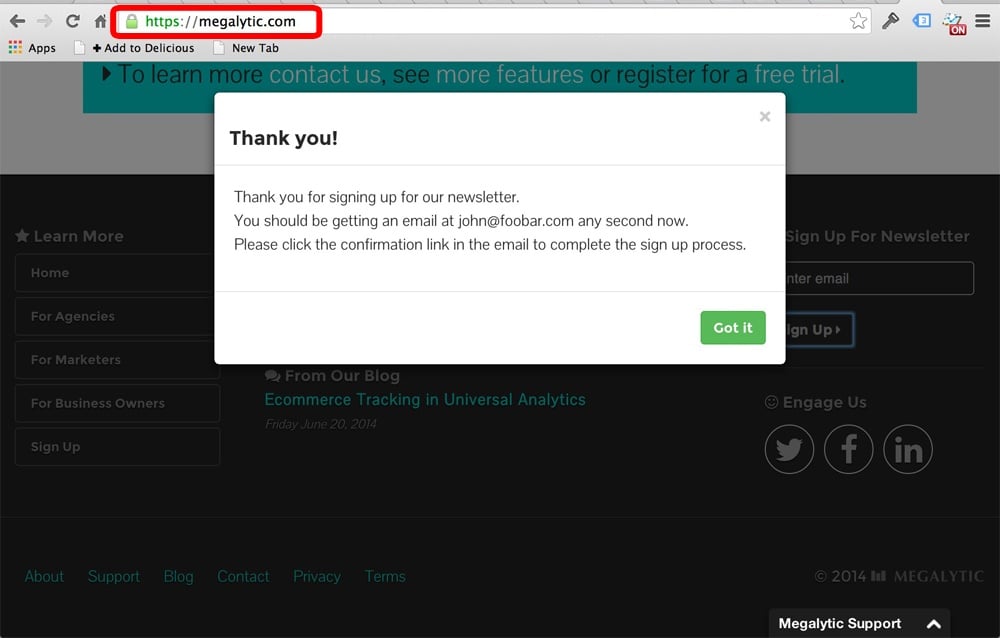
You will notice the URL, circled in red, is just the Megalytic home page. We cannot use this for our signup goal, because then every visit to the home page would register as a signup.
In this situation, you need to use either a virtual page view , or an event to track the sign-up. In either case, you need to add special tracking code to your web site.
Events are usually a better bet because they do not artificially inflate your pageview count in Google Analytics. However, if you want to create a goal funnel, then you will need to use a virtual pageview.
Here is the JavaScript code that we inserted into the Megalytic website to fire an event that tracks the signup.
ga('send', 'event', ‘newsletter’, ‘subscription’);
The category for this event is ‘newsletter’ and the action for this event is ‘subscription’. We use these when setting up the goal from this event in Google Analytics.
To do that, go to Admin > Goals, as shown above, only instead of selecting a “Destination” type goal, make it an “Event” type goal. You will then see a page like this, where you can enter the category and action that define the goal.

The Label and Value fields are optional, and we are not using them in the definition of this event, so we just left them blank.
Goal Reports
Once you have a goal set up in Google Analytics, you can view the standard report for the goal by opening Conversions > Goals > Overview. When you first open the report, it looks like this.
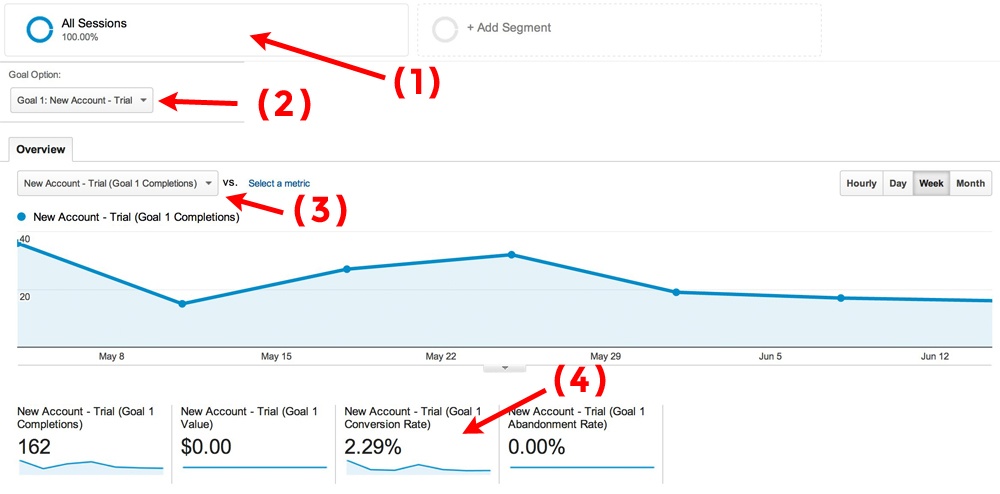
The labeled items point out some important aspects of this report to notice.
- Here, you can select the segment (group of sessions) to apply to the goal report. We are looking at all the sessions.
- Here, you can select which Goal you want to look at in the report.
- Here, you can select which metric to view. Usually, you want to look at either Completions (the total number of goal hits); or the Conversion Rate (the percentage of visitors who completed the goal).
- Here, you can see the overall Conversion Rate during the time period.
At this point, we have created an analytics goal and seen how to access a report. Let’s take a step back and remember the original business goal for which we created this analytics goal.
“Increase growth of weekly online subscription signups”
The report shows us the total number of goals completions each week, but it does not really provide any insight into the business goal, which is how to increase them. To achieve that, we need to think about actionable insights.
Actionable Insights
Earlier, we noted that for a measurable business goal, there is usually something to measure and a desired action. For the goal we are considering in this example, the desired action is to increase weekly online subscriptions .
What we want to discover, using analytics, is some action that the business can take to cause weekly online subscriptions to increase. We don’t want to just guess at it, but to back it up with data. That’s what we mean by an actionable insight.
A tried and true approach to discovering actionable insights with goals is to use segments. The idea is to look for traffic segments that produce a higher conversion rate than average, and focus on creating more traffic from that segment.
To select a segment, click on the “+ Add Segment” button at the top of the report, and select one of the options. We are going to look at the built-in segments for “Paid Traffic” and “Non-Paid” traffic. The modified report below shows the results of comparing these two segments.
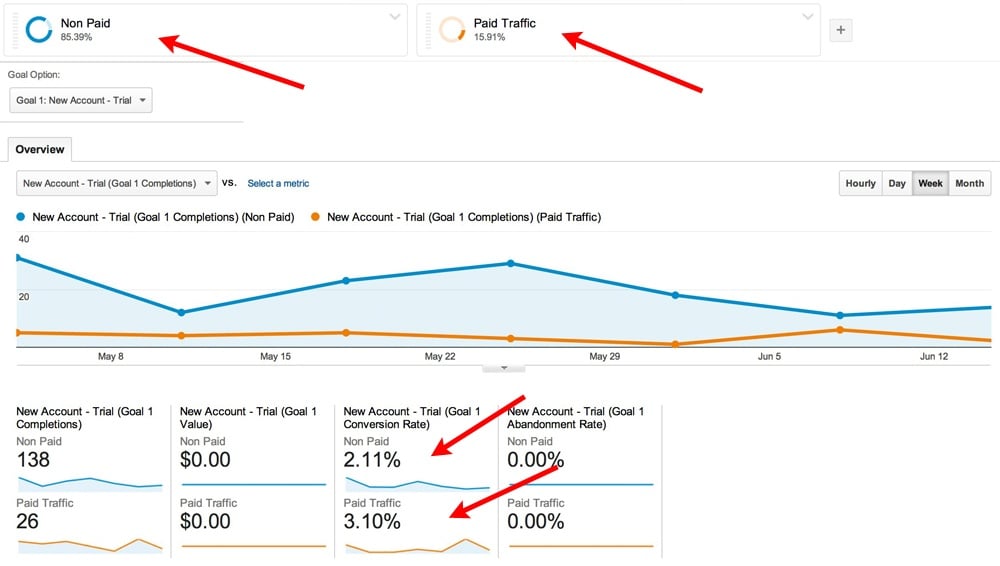
You can see that Paid Traffic has a conversion rate of 3.10%, whereas Non-Paid has a conversion rate of 2.11%.
Now, we are starting to get an actionable insight. To increase weekly subscriptions, we can recommend increasing the amount of paid traffic.
But, we can do even better using segments. We can focus on the various types of paid traffic and see which is best. To do that, you will need to create advanced segments to isolate your specific sources of paid traffic.
We’ve created advanced segments for Paid Google Search, Paid Facebook, and Paid Twitter. Applying these segments to the Goal Report gives us the results shown below.
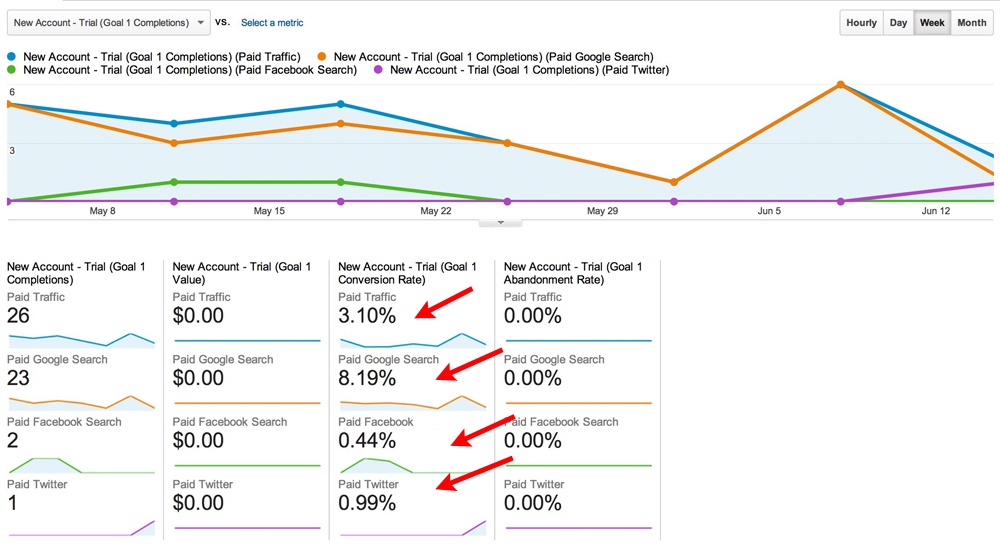
Here, we can see that the conversion rate for Paid Google Search is much higher than the average and also higher than either Facebook or Twitter.
Now, that’s an actionable insight! We can formulate this insight as a business recommendation.
To increase weekly online subscriptions, increase traffic from paid Google search, and consider decreasing traffic from paid Facebook and Twitter advertising.
Conclusions
Translating business goals into analytics goals means first constructing a list of business objectives, tying them to measurable goals, and identifying the aspects that can be measured using web analytics. Once you have a list of measurable goals, construct analytics goals by identifying the component of the goal that is related to measurement. Lastly, take your analysis a step further by identifying the component of the business goal that relates to action, and apply segments to come up with an actionable insight.