![]()
The Basics: Google Analytics Social Reports
There are two key reports in Google Analytics where you can get the basic data relating to social traffic. The first is Network Referrals (Acquisition > Social > Network Referrals). Here, you can see all the referral traffic stats organized by social network.
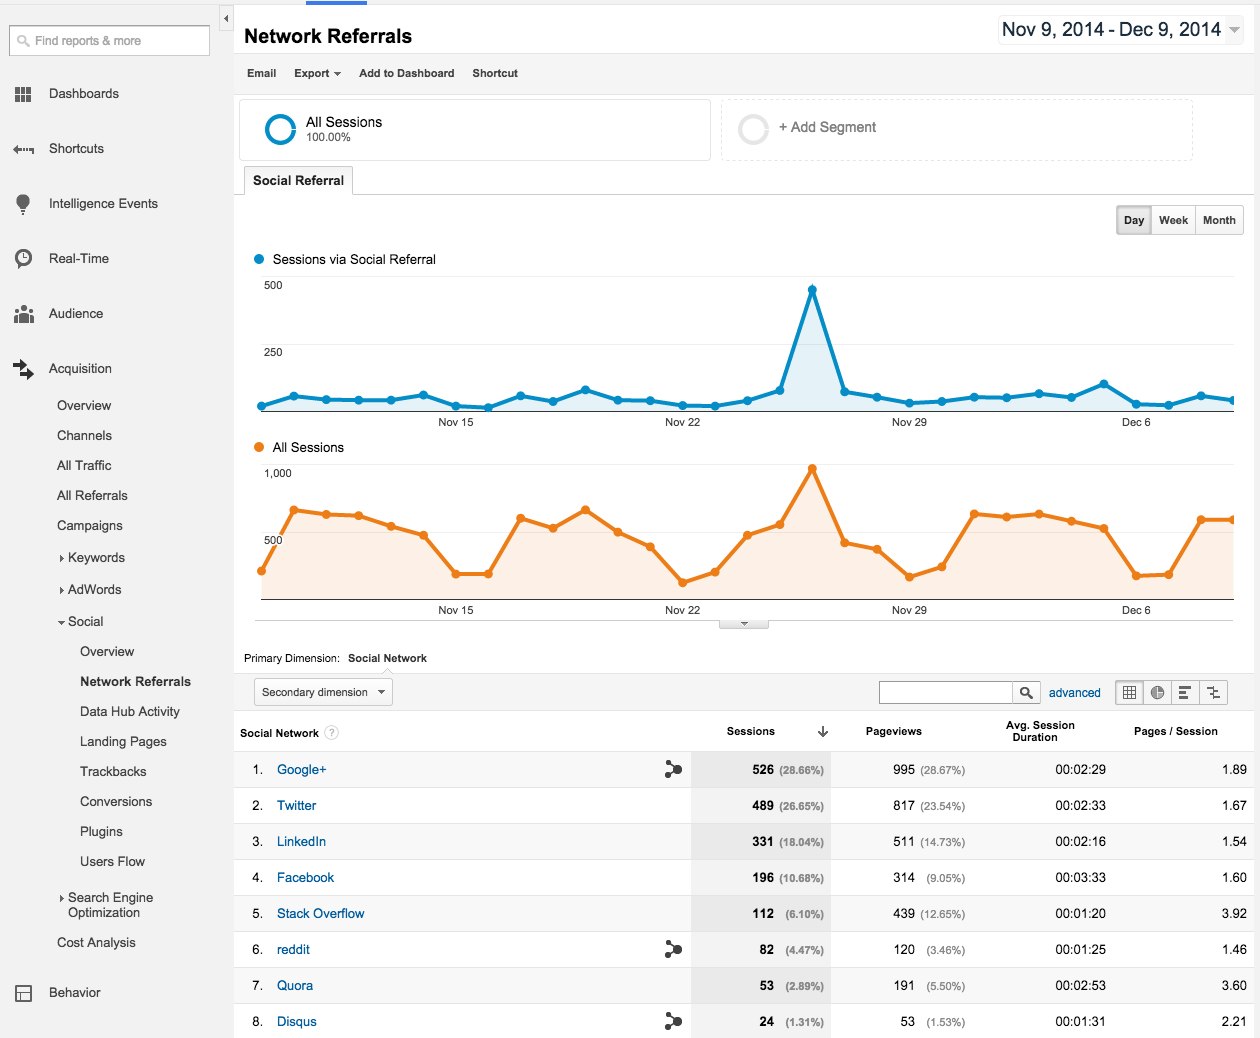
At the top are two line charts. The first shows all social traffic over time. You can compare that with the second, which shows all traffic. In the charts shown here, you can see that social is typically a relatively small share of the traffic to this website, except on November 26, when there was a big spike.
Below the line charts is a table that shows the breakdown, by social network, of the key. You can see Google+ drove the most traffic during this time period, followed by Twitter and LinkedIn. In addition to Sessions and Pageviews, look at the engagement metrics – Avg. Sessions Duration and Pages / Session. These help us understand where the most engaged traffic is coming from. For example, in this table, we can see Stack Overflow and Quora send traffic with the most curiosity about the website – viewing 3.92 and 3.60 pages per visit respectively. Based on this, it is probably worth investing in addition to content sharing on those social networks.
You can drill down on this report to get more information about a particular social network. For example, when we drill down on Google+, we get the result below.

The line charts now show Google+ vs Total traffic. Here, we can see the spike on November 26 is even more pronounced – indicating that Google+ was a major component of the surge in social traffic on that day.
The chart portion of this report shows stats broken down by “Shared URL” – the link that was shared on Google+ that the visitor clicked on. This is the page that the visitor clicking-in landed on (also known as the landing page). The big contributing link here is: megalytic.com/blog/use-google-analytics-and-webmaster-tools-to-manage-b2c-holiday-campaigns.
The second key report in this section is the Conversions report (Acquisition > Social > Conversions). This report provides data relating to Goal conversions and Ecommerce conversions by visitors from social networks. Note that this report will only be useful if your site has either Goals or Ecommerce set up. For some tips on setting up goals, see: Translating Business Goals to Analytics Goals. For information on Ecommerce configuration, see: Ecommerce Tracking in Universal Analytics.
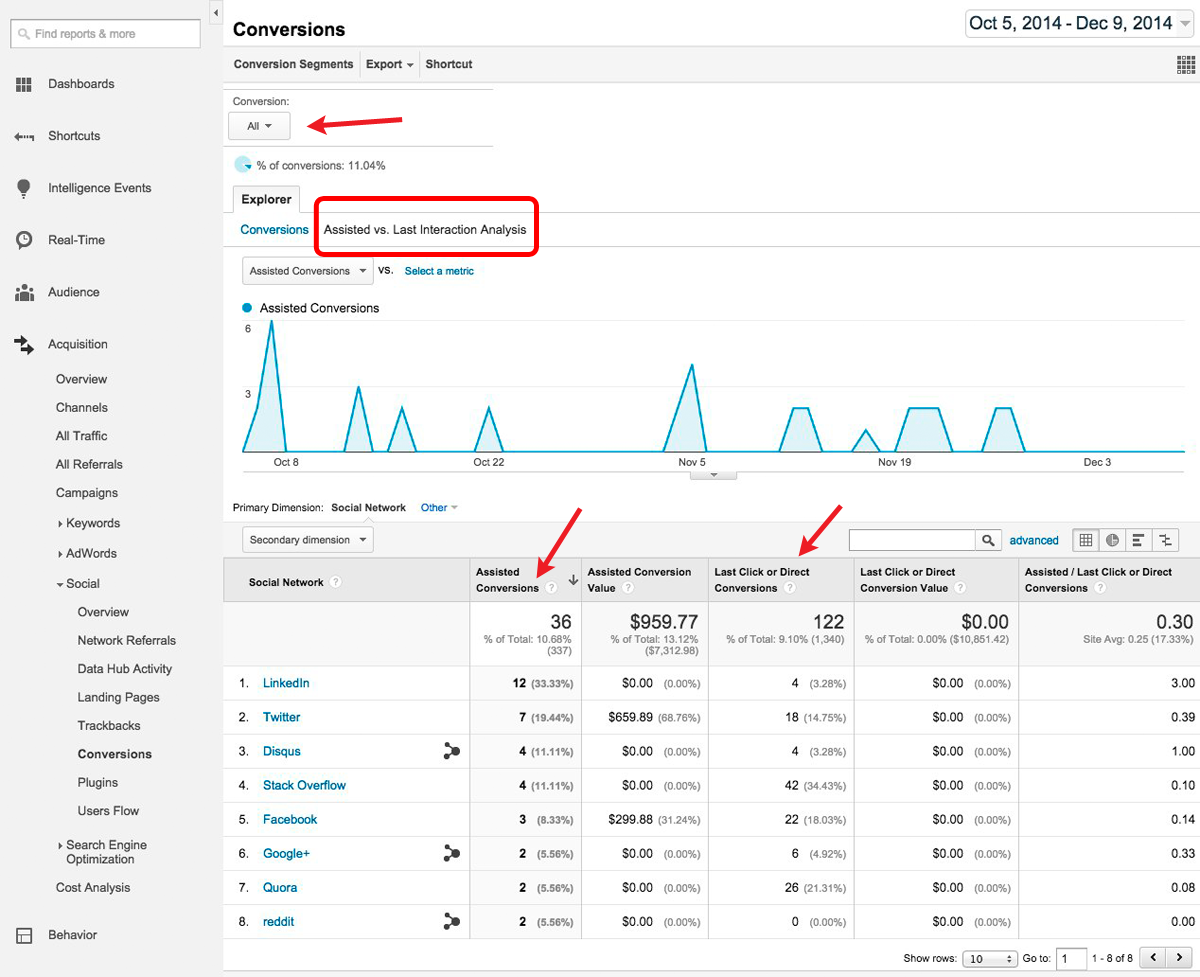
This report shows a breakdown of conversions by Social Network. However, it goes one step further. It shows both the Assisted Conversions and the Last Click or Direct Conversions. An Assisted Conversion is when a visitor came to the website from a Social Network and eventually converted (on a later visit). A Last Click or Direct Conversion is when a visitor came to the website from a Social Network and converted immediately, or came directly back (by typing in your URL or using a bookmark) and converted.
To get to this view of the report, you need to select the tab marked “Assisted vs. Last Interaction Analysis” on the Explorer Bar (circled in red).
Why two types of conversion? Because, for many websites, social networks are big influencers and not big converters. People may learn about your brand and click through to your website from a social network, but may not necessarily be looking to purchase at that time. They may come back later, after seeing a PPC advertisement for a sale on your website, and then make the purchase. It is important to know, not only that PPC drove the conversion, but that a social network influenced the conversion.
Assisted Conversions provide insight into which Social Networks are influencing people to eventually convert on the website. In this report, we see LinkedIn is the top influencer (with 12 Assisted Conversions), but it ranks near the bottom for Last Click or Direct Conversions. People are learning about this website on LinkedIn, but converting on subsequent visits from other sources. One takeaway from this observation is that LinkedIn is probably a better place to post brand-building content like blog posts or industry insights, as opposed to promotional content.
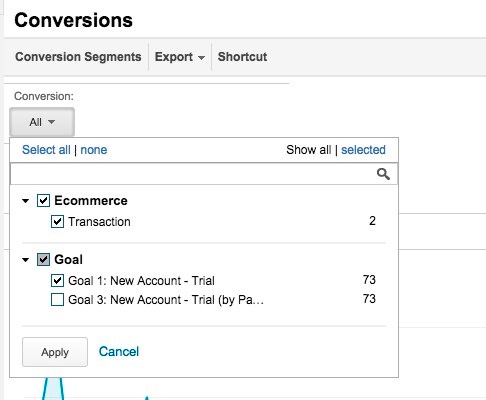
It is important to note that, by default, the Social Conversions report shows data on all Goal conversions and Ecommerce conversions. If you want to focus in on a particular Goal, or on Ecommerce transactions only, then you can select the desired conversion type from the drop-down labeled “Conversion” at the top of the report.
Under-Reporting in the Google Analytics Social Reports
The Social reports discussed so far can be incredibly useful – if the data is accurate. Unfortunately, it often is not. The reason is under-reporting of social referrals in Google Analytics. A good chunk of traffic from social media ends up being classified as Direct and never shows up in the Social reports.
In Google Analytics, Direct is the traffic for which a referrer wasn’t specified. Google Analytics figures out the source of the visit from the referrer data in the HTTP header. However, if the HTTP header does not include a referrer field, then GA cannot figure out where the request is coming from.
For a variety of reasons, traffic coming from social media sources often has the referrer stripped out and so Google Analytics classifies it as Direct. Clicks inside of the mobile apps commonly used to interact with social media, for example, often do not have referrer data. Even clicks from inside a browser often get passed through spam protection filters (e.g., Facebook’s Link Shim) that sometimes lose the referrer data.
You can often see this happening in Google Analytics by looking at a spike in traffic from Facebook. In a news website that I work with, for example, whenever traffic from Facebook spikes, there is a correlated spike in direct traffic.
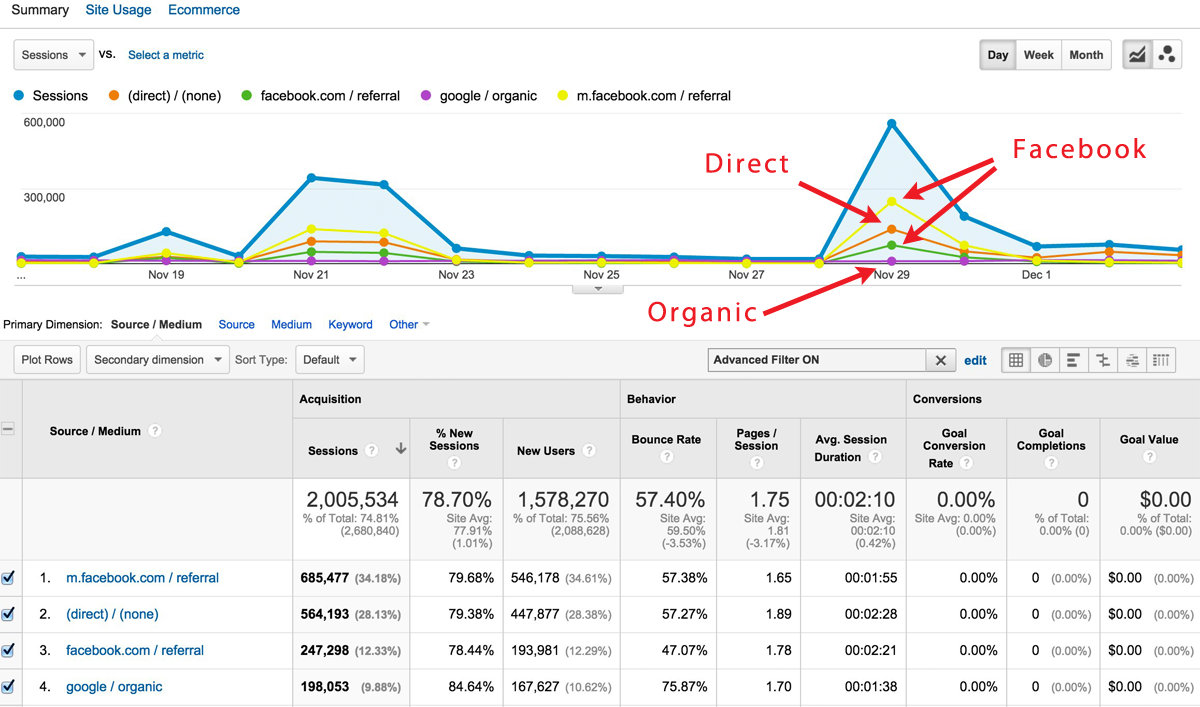
The yellow line is traffic from Facebook on mobile. The green is desktop traffic from Facebook. Each time they spike, we see direct traffic spiking up as well. For comparison, notice that there is no spike in organic traffic (purple line).
The spike in Direct traffic is not just a coincidence. It is actually traffic from Facebook. We know this because it is landing on the same page and happening at the exact same time as that page was shared by a Facebook user with 8 million fans.
- A lot of social media traffic, particularly from mobile devices, get misclassified as direct traffic.
To combat this problem, you should always tag the content that you share on social media. When the URLs that you share are tagged, the clicks will be classified correctly, even if the referrer data gets stripped out on the way to your website.
For some tips on how to do tagging properly, see: Consistent Tagging for Better Campaign Tracking.
Of course, when other people share links to your website content, they will not take the time to tag those links. So, tagging will not solve the entire problem. But, it at least helps track the content that you share – and when people retweet or share your social posts with tagged links, it will help with those as well.

Conclusions
The Google Analytics reports on Social Network Referrals and Social Conversions provide great insight into the quality of the traffic your website receives from social media. To get the most out of these reports, make sure that you are properly tagging your URLs whenever you share content on social networks.

