
Decide What Data to Report
Before you can identify how to access the data you need, you need to identify what that data is to your business or your client. What is it you/they are looking for and to what purpose? While favored metrics will vary based on the type of business, you want to identify metrics that point to ROI. In addition to reporting general performance like sessions, users, bounce rate, and time on site, you’ll also want to report on conversion data by region. This will allow you to easily present how each area contributes to leads and revenue. You will be able to see which regions or markets are most profitable and where new opportunities live (or, conversely, areas or regions you should abandon).
If you’re part of an agency, talk with your client to determine what metrics matter most to them and what signals success for their business. Determine pages on the site that are important to the customer acquisition process. Our earlier post on translating business goals to analytics goals can help you identify what is most important to track.
Once you’ve determined the key data, start finding ways to report that data by region.
Use the Geo Location Report
For basic geographic information, start in the Location report in Analytics (Audience > Geo > Location). Once in this report, you can click on the map, or the list of countries, to look at data on more granular levels like state, city, etc. You’ll then see data for sessions, engagement, goal completions and other metrics for each location.
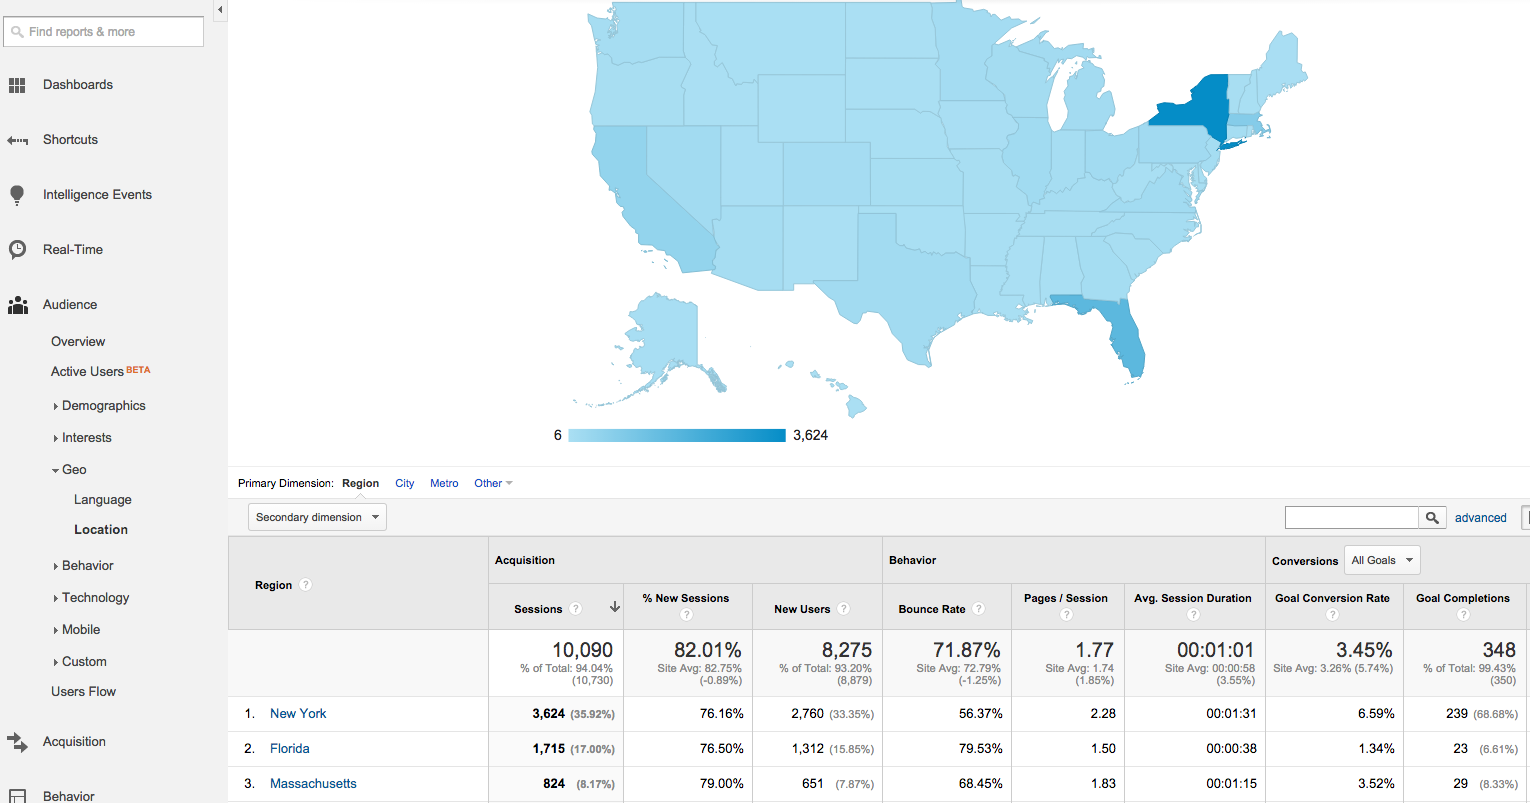
One practical use for this report is helping a client see where, specifically, within a target region people are coming from. When reporting data for a specific state, showing a list of top cities can help a client know where people are taking the most interest in the site and brand. Click on a specific state to break the data down by cities in that state. You can now sort by various metrics like sessions, users, and goal completions.
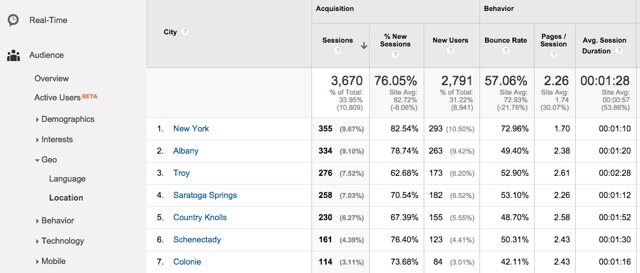
In this screenshot, you can see New York City (outside this business’s main market area) drives a lot of sessions, but Albany (in their market area) shows better quality traffic and has a much lower bounce rate. The client can also see areas with lower volume, like Colonie, still drive quality users who may be potential customers. This insight may lead to future microtargeting campaigns to specific towns.
While the Location report provides a wealth of data about the value of each geographic area, Custom Segments allow you to go even further by looking closer at how visitors from specific regions use your site.
Make Custom Segments Your Friend
Custom Segments allow you to customize the data you see in most reports available in Analytics. In this case, you should segment data by the main geographic markets for your company or client so you can easily see audience and conversion stats by region.
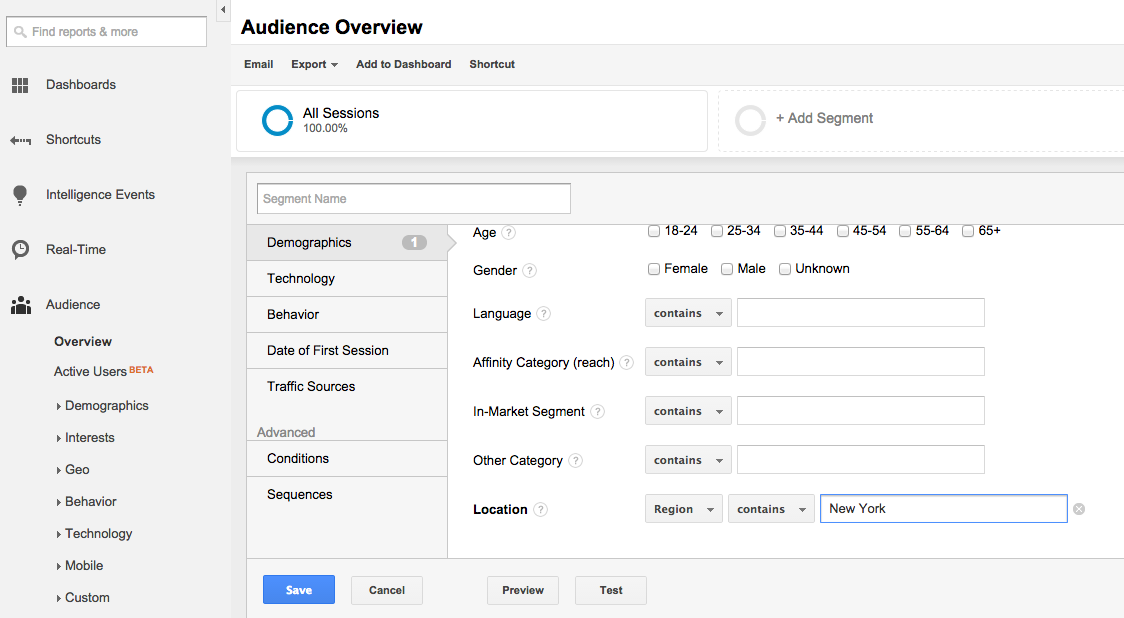
First, if you’re not already familiar with Custom Segments, learn how to create them and what geographic dimensions are available. Learn more about Custom Segments with this article. To create a segment from the Reporting screen, click “Add Segment” near the top of the screen.
Within the Demographics section, scroll down until you see a “Location” dropdown. In this dropdown, you’ll see Continent, Sub Continent Region, Country/Territory, Region, and City available. In this case, we’ll build segments to look at statistics by state, so we select Region and enter New York as the region (state) name.
Once you’ve named the segment and saved it, you can apply it throughout Analytics to see the data you need to report. If you want to see how many conversions came specifically from New York, simply apply the New York segment while viewing the Conversions > Goal Completions report. You can then add this data to your report when presenting to your boss or client.
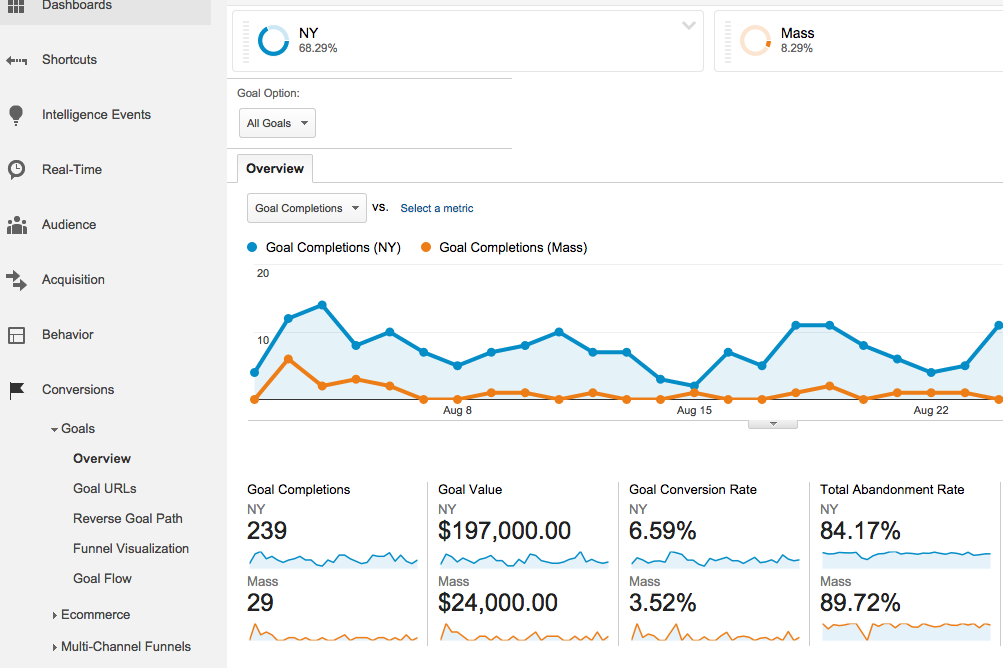
Repeat the steps for setting up a Custom Segment to add more states and pull data for each market served. In this screenshot, we are able to see conversion data for both New York and Massachusetts all at once. Specifically, we can note that in addition to receiving a much higher volume of conversions, users from New York convert at a much higher rate.
Segment by Source & Region
Looking at how much traffic and how many conversions you’re getting by state offers a good start in looking at data for specific metro areas. However, to deliver more precise data on how people are finding your site in each region, you want to look at where those people are coming from: whether they find your site through organic search, paid advertising, or social media. As analyzing organic traffic is crucial to any business, start by creating an organic segment for each region.
Create a segment as before, except this time select “Conditions” within the segmentation categories. Filter so Region contains “New York” and Medium contains “organic.” Save the segment, and now you can see data specific to New York organic search traffic throughout Analytics.
If you’re running paid search campaigns and want to compare sessions for paid vs. organic, create a similar segment and enter “cpc” as the medium. You can then look at data throughout Analytics, from sessions to conversions, for New York paid and organic.
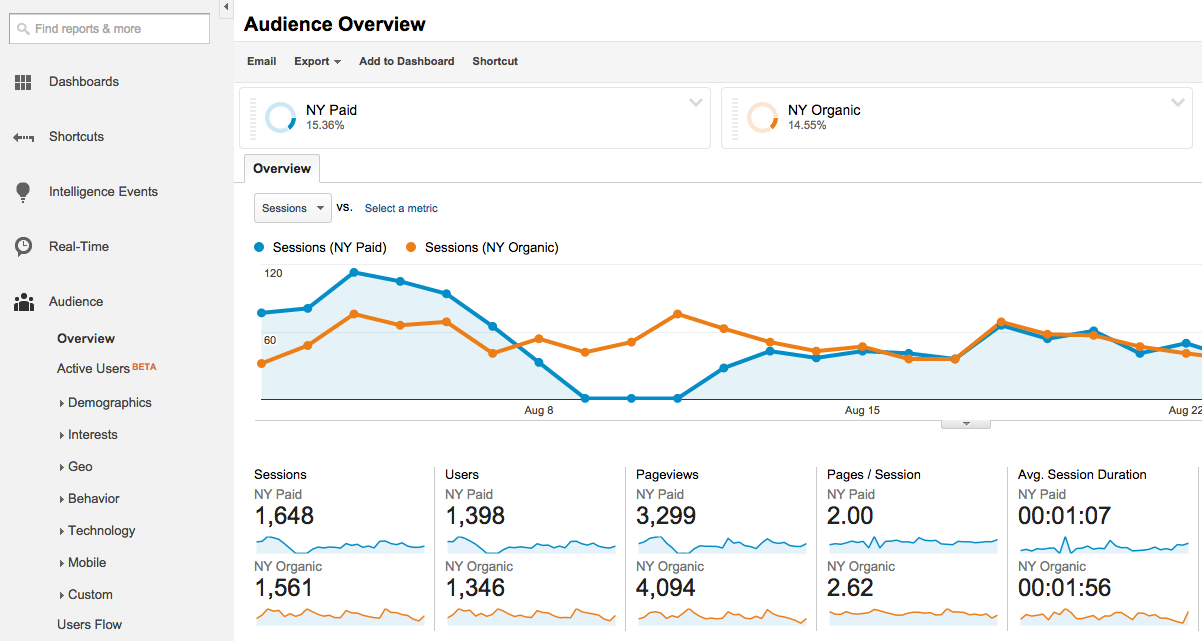
In this screenshot, you can see that paid advertising has driven slightly more sessions than organic search in New York, but the organic users are spending more time on site and viewing more pages per session, on average. Seeing how much engagement varies by source, this data shows the importance of segmenting beyond just all traffic in a region to show organic, paid, social, and other sources.
Once you’ve mastered Custom Segments, note that you can even use them within a reporting tool like Megalytic to easily show stats by region and further dimensions you’ve defined like source.
Showing Audience Demographics by Region
With the data available to website marketers about their audiences, reporting should go beyond just sessions and conversions to provide insight into demographics of users. The Demographics report in Google Analytics (Audience > Demographics > Overview) provides a good general overview of age and gender breakdown. As demographics of a company’s audience can vary widely based on state, Custom Segments allow you to see this data by region to better market to each audience.
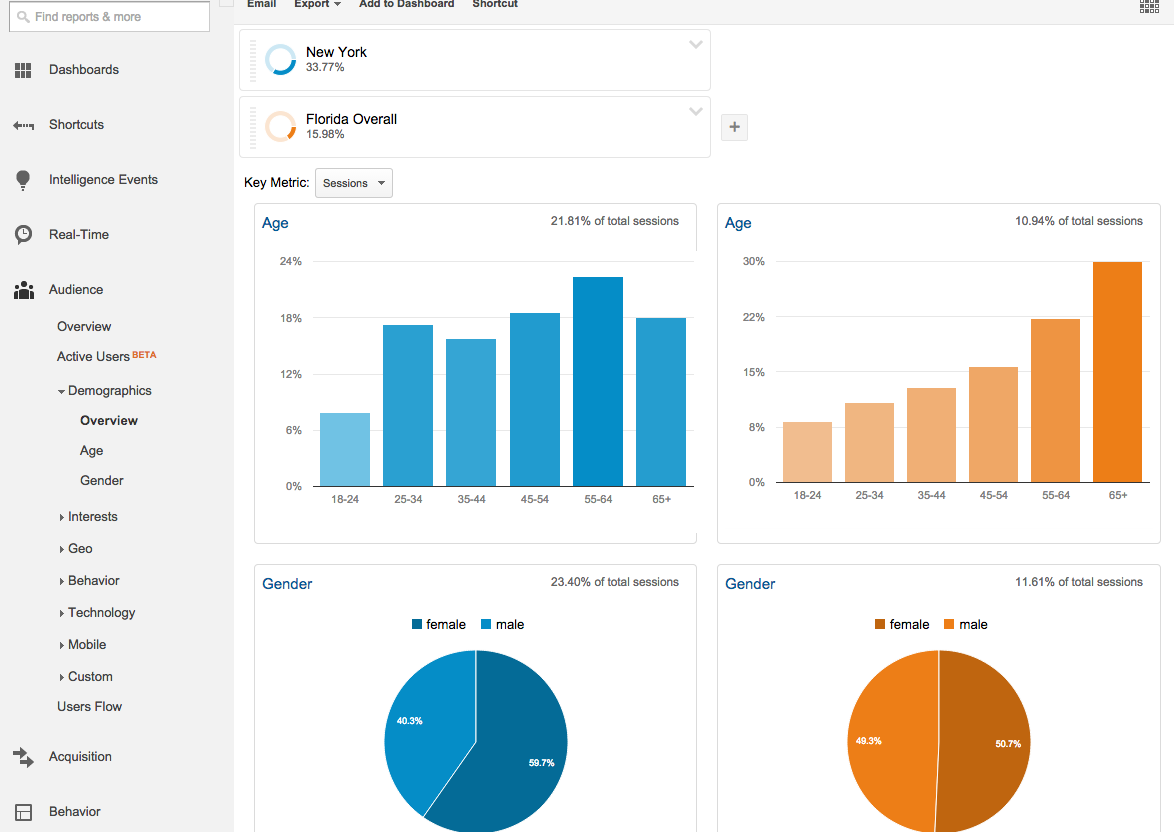
In this example, we’ve applied segments for New York and Florida traffic to the Demographics report. As expected, audiences in these two states vary quite extensively. Most obviously, the Florida users skew heavily toward the older end, with 65+ being the highest bracket. In addition, the split between male/female is more even in Florida. From this data, this company can see that their Florida marketing should focus much more heavily on reaching retirees, while New York marketing should contain messaging intended for a younger audience.
Conclusion
For businesses servicing multiple local markets, segmenting website data to align with the business’ geographic target areas provides invaluable data when building reports. Take the time to determine who is visiting the site, where users find the site, and how they engage with the site in each region. Learn to use Custom Segments throughout Analytics to get geographic data that will help you make informed marketing decisions.

