
Why are you testing?
Before you initiate an A/B test, consider why it is you’re testing in the first place. Did you read an article where a “web optimization expert” argued everybody should do A/B tests? Or do you have specific concerns about conversion and usability on your site indicating room for improvement? Or maybe you’re hoping to gain insight about a particular call to action or messaging element. Be sure to have a purpose in mind for A/B testing in order to derive genuine value from the analysis.
You should also identify your goals. Do you want to increase purchases for specific products? Do you want more people to download ebooks? Do you want people to spend more time reading articles on your site? Define the on-site behavior you want to encourage.
What are you testing?
Next, determine which elements on your site you plan to test, thinking about how your goals relate to those elements. Examining data from Google Analytics can help identify problematic elements that can benefit from A/B testing.
Specifically, the Exit Pages report (Behavior > Site Content > Exit Pages) shows you the pages on your site where people dropped off. From here, you can identify the pages where you can test improvements that will keep people on your site, whether completing a path to purchase or simply reading more of your content.

The example above comes from an ecommerce site selling outdoor/survival goods. Here we can see the pages where the most exits took place. The far right column also shows the percentage of pageviews that resulted in exits.
For this ecommerce site, we realize that exits from product pages mean potential customers are not purchasing. Therefore, reviewing the pages with the most exits and the highest exit rates will allow us to zero in on key pages to test. In this list, we see the All American Sun Oven page has received both a large quantity of exits and a high exit rate (66%, almost twice the 31% average of the site as a whole). A good AB test for this page would focus on experiments with content and call to action with a goal of reducing the exit rate and increasing conversion.
In addition to analytics data, business priorities should be used to help guide what product pages to include in tests. In this case, you should ensure the sun oven is indeed a product the business cares about promoting and selling, although the volume of pageviews alone indicates popularity or active promotion. We can conclude the data shows opportunity to capitalize on the people coming to the sun oven page and encourage more of them to purchase.
How are you testing?
Once you’ve picked a page to test, move to planning the test in more detail. Continuing with the example of an ecommerce product page, analyze the page to identify elements you could easily test. For example, you could change an “Add to Cart” button color from blue to red to make it more visible or move the button from the bottom of the page to the top. Or, avoiding layout and design changes, you could simply edit content on the page, such as mentioning “Free Shipping” if that is an option but was not prominent on the page previously. You want to brainstorm potential large and small edits to the page that will relate to conversion.
As a caveat, be careful about making too many changes all at once. If you change a button color and wording at the same time, and an A/B test shows improvement, you won’t know whether to attribute higher conversion rate to the new color or the new wording (or both). For this reason, it is important to only make one change at a time.
Once you’ve identified the page edits you’d like to test, you need to choose a platform to run the test. A number of services allow you to test page variations and analyze the resulting data, including the free Content Experiments within Google Analytics, as well as paid services like Optimizely. We’ll focus on Google Analytics Content Experiments in this article.
Setting up the Experiment
To begin the experiment you’ll need to create a variant page. Your variant (or “test”) page is the alternate page that includes the changes you are testing. This page should exist on a separate URL from your original “control” page. Once you have a “test” page created on your site, you’re ready to set up the experiment.
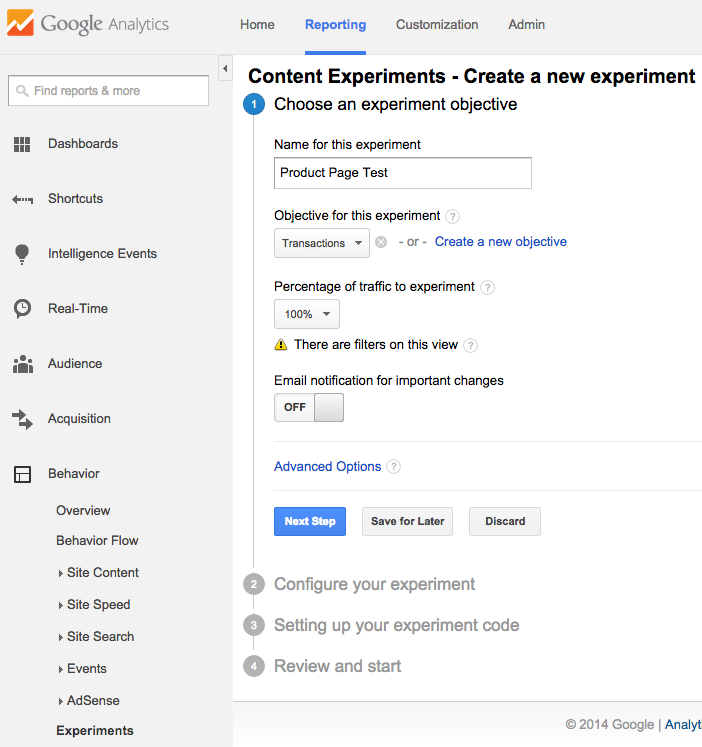
From the Google Analytics Reporting screen, navigate to Behavior > Experiments and select “Create Experiment.” Enter a name for your experiment. Then, choose an objective via the dropdown. In this case we’ve chosen Transactions, since the goal is to increase purchases through the site, but you can also select specific goal completions or other metrics. Finally, you can control the percentage of traffic included in the experiment. If your site receives a high volume of sessions, you may consider including a lower percentage.
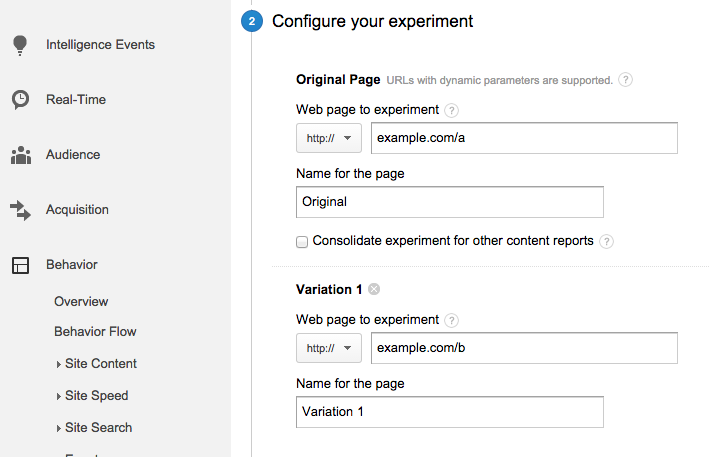
In the next step, enter the URLs for your test. You’ll see fields to add the original page as well as variations (note that you can include multiple variations).
In the third step, you’ll find a code snippet to add to the original page variation. If you edit your own site, you can add this yourself, or you can send the code straight to a developer who manages your site. The final step tests proper implementation of the code before launching the test.
Once you’ve launched the test, you’ll want to wait for statistically significant results to accumulate. Generally, data will begin to show up within a day, but for most sites, you’ll want to run a test for at least two weeks, or until you receive a few thousand impressions, to collect a large enough sample. Monitor the results periodically throughout the test period by navigating to Experiments and selecting your test.
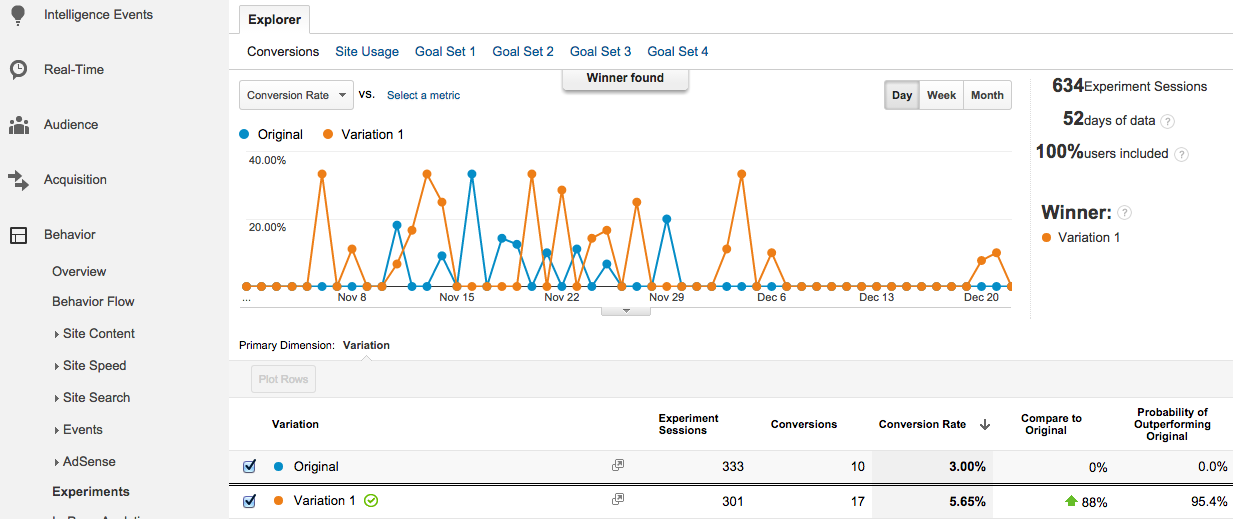
In this example, we see results from a test in which the variation page proved to be the clear winner, both in number of conversions and overall conversion rate. From this data, we made the decision to replace the original page with the variation.
Conclusion
Planning an effective A/B test requires careful attention throughout the entire process, from identifying pages to test, to editing those pages, to actually running the test. In addition, no single A/B test provides an end in itself but should exist as part of a broader marketing strategy. Be sure to plan any test keeping in mind how it contributes to your marketing efforts and how any changes you implement will help to improve your website’s ROI. Done properly, A/B testing can lead to better engagement on your site, more interaction with your brand, and ultimately more revenue.

