
Mobile and Apps
We all know mobile matters for everyone. But in this space, mobile traffic is of particular interest. Whether it’s booking a hotel on a train to the city or checking the status of a flight from the taxi, users expect a positive, streamlined experience on mobile devices.
Granted, app analytics can provide intelligence for companies in any industry, but they are particularly relevant to travel and tourism. Consider these statistics:
60% of smartphone users regularly use travel apps while planning trips.
Travel related apps are the 7th most downloaded app category.
Mobile bookings in travel grew by 1700% between 2011 and 2015, going from 1% to 18% of online revenues.
It’s clear that in this industry, marketers need to make mobile a priority and should seriously consider an app. Mobile website data is available in a standard analytics account, but if you have a mobile application that data has to be tracked as a separate property with its own Tracking ID.
If you haven’t set up a separate Google Analytics account for an app, navigate to the Admin section of your website analytics. From the “Property” dropdown, select “Create New Property” and choose “Mobile App” as what you would like to track.
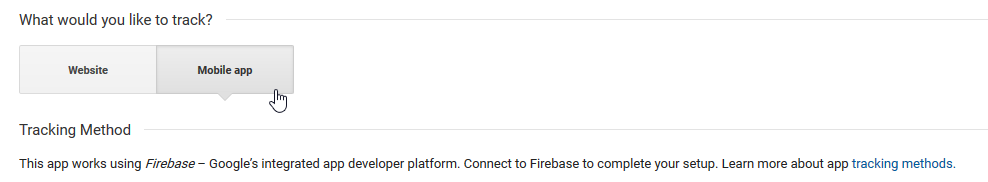
You’ll need a Firebase Account to complete the process, so it may be wise to set one up before you begin. Once the process is finished, your mobile app analytics will have their own view allowing you to track in-app behavioral events, audiences, conversions, attribution and lifetime value (LTV), funnels, and cohorts.
Measuring and reporting on app metrics separately from mobile website metrics is important. App behaviors can vary from website behaviors and app interaction can create a closer connection with users. Apps can also facilitate push notifications and provide functionalities like geo-fencing and beacons that can impact user behaviors and should be tracked separately, but included in a comprehensive digital marketing report. Measuring app performance in terms of acquisition, engagement and outcomes is informative on its own. But insights gained through app analytics analysis can help illuminate opportunities to improve a mobile website and vice versa. Whether it’s a particularly effective offer in an app or discovering that call-to-action (CTA) copy on the website performs better, these observations can help inform new ideas across channels.
Referrals and Reviews
Travel related websites aren’t just those who work directly in transportation, accommodations or hospitality. Consider these insights:
TripAdvisor is among the most popular mobile apps in the travel industry with more than 230 million downloads and 150 million monthly active users .
Yelp has average monthly users of 84 million on desktop, 73 million on mobile web, and 26 million on their app.
Every site should be looking at referrals. But in travel, if you’re not monitoring your referrals and reviews, you might miss something important. Referrals from sites like Trip Advisor and Yelp may be a result of high listings or positive reviews. A drop in referrals from those sites might indicate a problem with the profile or a sudden influx of negative reviews. In those cases, marketers would want to follow the thread to look for a problem or to help a brand create a strategy to deal with comments from unsatisfied customers.
It’s also fair to look at the performance of referral links from smaller, more localized sources. An official city or town site, a “things to do in the region” site, or even complimentary service sites like a referral to a restaurant from a local hotel website. Showing referrals from these websites can help validate the cost of a paid listing or, conversely, indicate a low ROI. It can also show opportunities to pursue new listings on similar sites if there is a particular type of referrer that consistently drives traffic, or even better, conversions.
International Presence
U.S. citizens engage in more international travel than any other nation and are the 2nd leading destination for worldwide travelers. So whether you are a U.S. based travel business looking to attract visitors from other nations or a foreign vacation spot looking to attract tourists from the U.S., international analytics metrics earn themselves a place in your report.
This may include a few different ways of representing an international perspective:
Search Rankings in Other Countries – Evaluating ranking positions in other countries’ versions of Google, Russia’s Yandex or China’s Baidu can help gather intelligence on a brand’s organic search visibility in other nations.
Traffic from Other Countries – Along the same lines, overall traffic, whether it’s paid or organic, from other nations can help illuminate locations where interest is either growing or diminishing.
Conversions from Other Countries – When you cross reference general rankings and traffic data with conversion data you can help determine where spends or efforts should be increased.
When international data is also used in conjunction with referral data, review evaluation and app analytics, you can begin to get a picture of user interest, spend effectiveness, engagement and other behaviors as they vary from nation to nation. These insights can be used to help guide PPC campaigns, translation efforts and content development as it applies to the user trends from each specific nation. Whether you’re looking to increase market share or set targeting priorities, this data can be pivotal to guiding strategic decisions.
Social Media
Finally, you can’t talk about digital reporting for travel without mentioning social media. While it may once have been cutting edge, a social presence and engagement has essentially become mandatory for travel related businesses. While it’s true that reporting on social media metrics makes sense for a multitude of verticals, the travel industry has seen a substantial benefit from the rise of social media as a marketing platform.
For example, these Facebook related statistics show the important role it now plays in travel:
On Facebook the travel segment has seen the highest click-through rate (CTR) at 2.63%.
76% of respondents (CTR) in an Adweek survey stated they post vacation photos to Facebook.
87% of millennials look to Facebook for travel inspiration.
The data indicates that a travel related company’s social media presence has the potential to influence tourist decisions. These choices can range from the destination of the trip to micro-moments like where to eat or which attractions visit. Social media content from travel sites even has the power inspire a user’s decision to take a vacation.

Whether social campaigns are paid or organic, on Facebook, Instagram or other platforms, marketers should highlight social media referrals to gauge how effectively social media users are engaging with posts and with the brand as a whole. Each social media platform provides their own internal analytics on likes, follows, fans, comments and click-through data. These insights provide necessary granular details on user responses to varying kinds of content.
Brands can also take advantage of the frequency with which travelers post updates and images of their own travel experiences by watching for (and encouraging) user tagging. When a brand is tagged, their response to that interaction has the potential to deepen the customer relationship and improve loyalty.
Evaluating and reporting on the metrics associated with interactions, engagement and messaging allow a brand to locate, dissect and replicate the campaigns. Repeatable initiatives often evolve by studying the tactics that have proven the most successful in driving social media users to a brand webpage and ultimately to a completion. The manner of completion may vary from a booking to an app download or even a brochure request but any goal achieved, can lead to a valuable connection.
Conclusion
Brands in the travel sector require many of the same metrics as other industries. But additional insights from mobile app analytics, referrals and reviews, international visibility and social media are especially salient for brands that specialize in tourism and hospitality vertical. While anyone can benefit from evaluating these data sets, at least periodically – for travel related brands they may be the map that leads to an exciting adventure in digital strategy.

