
Compare Overall Traffic to Last Year
Since interest in researching colleges will vary heavily by season, comparing to the same date range of the previous year will provide the best picture as to whether traffic and engagement have improved. Megalytic’s Period Comparison Table provides an easy way to show performance from one year to the next.
After adding this widget, she’ll customize it to compare December 2014 to December 2013.
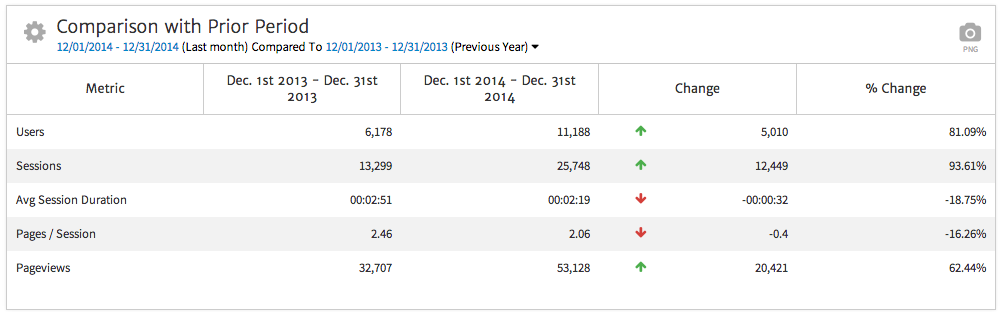
From this data, note that Users, Sessions and Pageviews increased significantly from the previous year. However, Average Session Duration and Pages/Session decreased slightly.
To provide further insight, this college had launched a new website toward the end of 2013. The old website had a dated architecture, with the new site providing more direct navigation options to get to inner pages of the site immediately. With this knowledge, she concludes the decrease in session duration and number of pages viewed in a session actually indicate improvement in user engagement, as users are finding the information they want more quickly. An Avg Session Duration of more than two minutes still indicates a reasonable amount of time spent on the site absorbing content.
Show Top Traffic Sources
Every online marketing report should show how people are finding a website, whether through organic search, pay-per-click advertising, social media, email campaigns or referrals from other sites. To show this data, our in-house marketer will include a Traffic by Source/Medium widget and, for the sake of this report, set the date range to December.
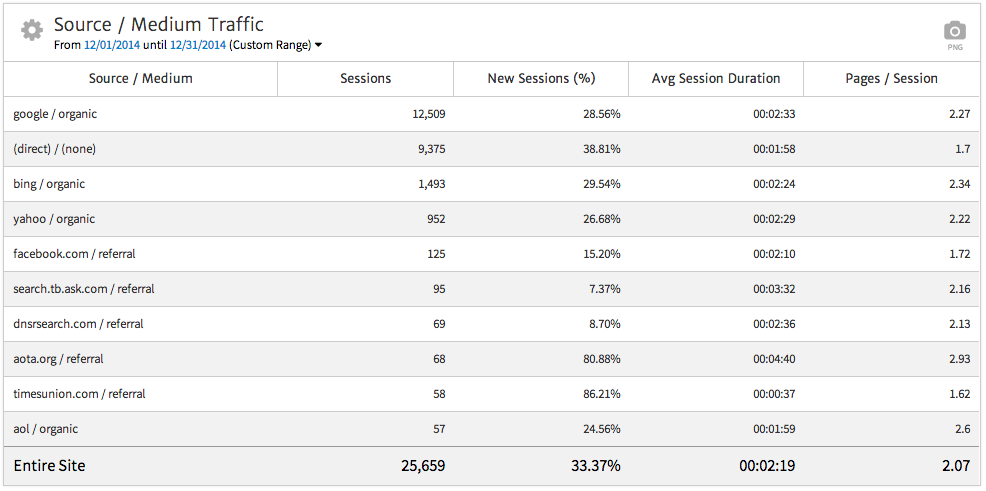
From this widget, she can see that organic traffic via Google, Bing and Yahoo makes up the largest source by far. Next, a high amount of direct traffic arrives on the site. She knows this is likely reflecting heavy use of direct mail campaigns, as well as frequent access from students and faculty already familiar with the site’s URL. Finally, referral traffic from a couple of sites ranks among the top ten sources.
For the executives reviewing the report, she can point out:
- What source drove the most traffic: Google organic search
- What source drove the highest engaged traffic, based on Avg. Session Duration: aota.org, referrals from the American Occupational Therapy Association
- What source from the top ten drove the lowest engaged traffic: timesunion.com, a local newspaper site
Based on this data, she can conclude that any work to keep the college’s site positioned in organic search will be crucial to continue, as that source drives the most traffic. In addition, she may recommend doing some paid online advertising to boost traffic toward key pages.
Show Pages of Key Concern
As mentioned, the college executives are especially concerned with seeing interest in their bachelor’s degree programs. To show this information, she can add a Page Traffic widget and filter it to show only pages relevant to the bachelor’s degree programs.
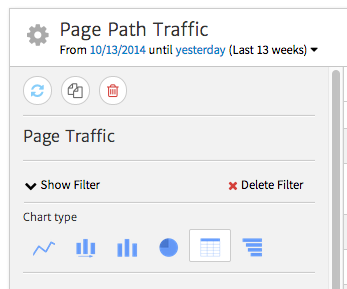
To add a filter, select the gear symbol in the top left of a widget. In the sidebar that appears, click “Show Filter.”
You can now add criteria for your filter. In this case, we’ll set it to include only URLs with bachelor.
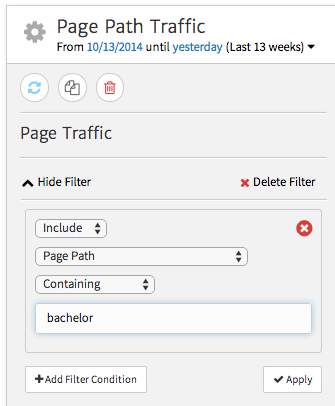
Click “Apply” to save. Now, the final widget shows the desired pages.
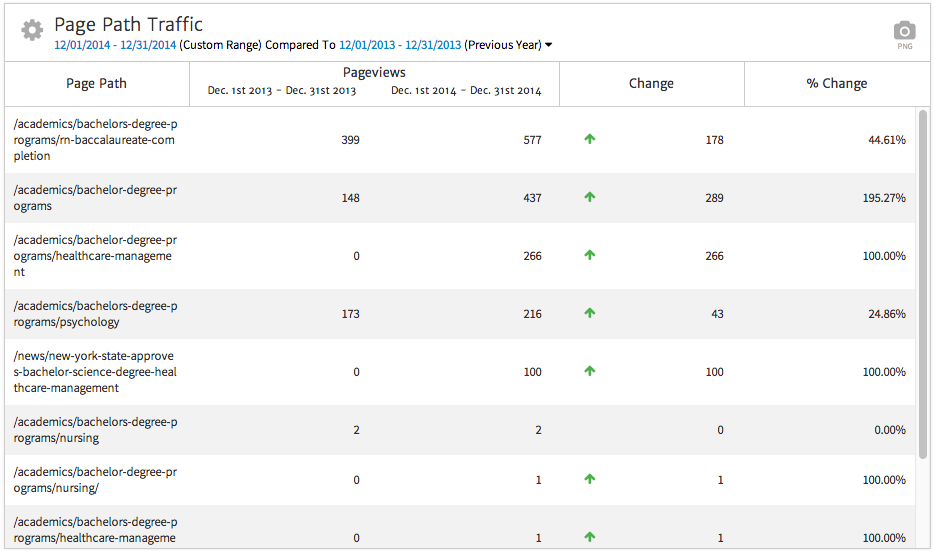
Across the board, interest in the pages relevant to the bachelor’s programs has increased, based on Pageviews, even allowing for the fact that some of these pages were added after December 2013. The RN Baccalaureate Completion program appears to be the most popular and has seen around a 45% increase in Pageviews. Based on this data, our marketing friend can report to her colleagues that interest in the bachelor’s degree programs information on the website is clearly increasing.
In addition to seeing where people go on the site, she also needs to show how well the site is encouraging prospective students to contact the school.
Show Goal Completions
In this report, she’ll highlight the most important Goal tracked on the site, a registration page where prospective students can sign up to visit the campus. The college hosts informational events throughout the year, as well as scheduling one-on-one visits with people who express interest.
The college executives want to know how many people are registering for campus visits via the website, as well as where these people are coming from. In addition, our marketing friend should show whether registrations are increasing or decreasing.
First, she’ll add a Conversions by Channel widget. As the registration Goal was set up more recently, she doesn’t have data from last year to compare. In this case she’ll compare stats to the previous month using the date range selector. Next, she’ll select the gear symbol to customize the widget.
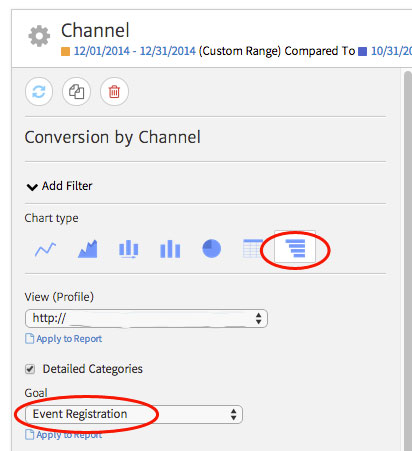
She’ll choose the far right bar graph option and then use the “Goal” dropdown to filter by a specific Goal. In this case, the “event registration” Goal includes the data she wants to display. After applying changes, the final widget breaks down Goals by channel.
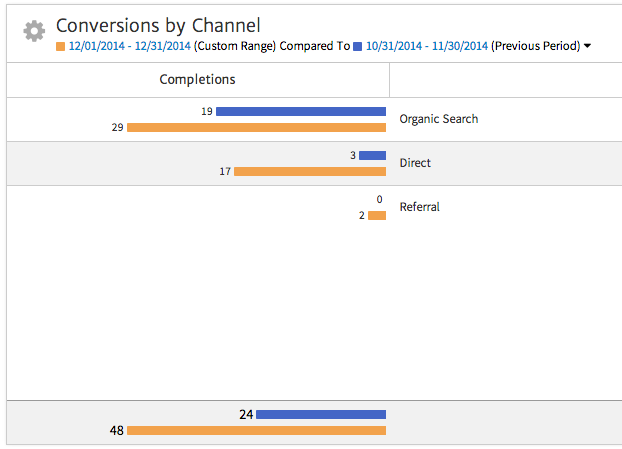
From this data, she can show that the majority of conversions come through Organic Search. In addition, a number came in as Direct traffic over the past month, possibly reflecting direct mail efforts. From that information, she may want to work with her team on better setting up offline efforts to track properly through Google Analytics.
Overall, she can show that conversions have doubled from the past month, demonstrating a rise in interest to the school. She knows that January events offering on-the-spot admission have likely helped drive this increase.
Tying It Together
Throughout this article, we’ve noted several areas where our marketer should provide further explanation for the data shown in her widgets. She may need to define some metrics for those unfamiliar with analytics, while also explaining key takeaways, such as the high percentage of organic traffic. To include these explanations in the report, she can add comments with Megalytic’s Notes widget. In addition, to make her report look professional for the college executives, she can add a cover page complete with the college’s logo.
Once the report is complete, she can then save it as a template for future use. To do this, she’ll just need to select “Save as Template” from the options directly above the report. After naming it, she can then choose this template whenever creating a new report.

Conclusion
Our college marketer has provided one example of building an in-house marketing report template. She adapts her report to the concerns of the team she works with, showing specific content and goals that they care about. While in-house reporting may need to address different concerns from agency reporting, ultimately the best online marketing reports find value in showing the right data and only the most relevant data to the people receiving the reports.

