A common question in content marketing is "What content should we promote?". If your site or blog has a lot of content, and you are looking to put some advertising behind it - or promote it in some other way - its important to choose pages that stand out. Google Analytics can help with that analysis.
Your most compelling content may not be the pages that get the most views. In Google Analytics, you can use the Avg. Time on Page metric to see which content your visitors are taking time to actually read.
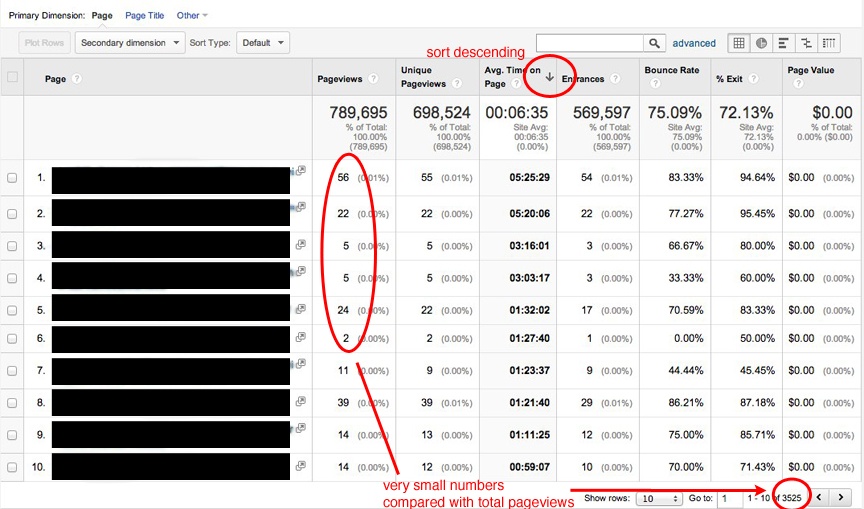
Start with the Pages report under Behavior >> Site Content >> All Pages. Click on the Avg. Time on Page column to sort it in descending order. This will show you the top pages in terms of Avg. Time on Site. But, there is typically a problem. Most of these pages don't have a lot of pageviews. In the example below, the top 3 pages have 56, 22, and 5 pageviews each. This is for a site with over 35,000 pages and over 780,000 pageviews in the past week. So, these high ranking pages aren't really representative. By statistical chance, a few visitors may have lingered on these pages, but that doesn't mean that they are appealing to a wider audience.
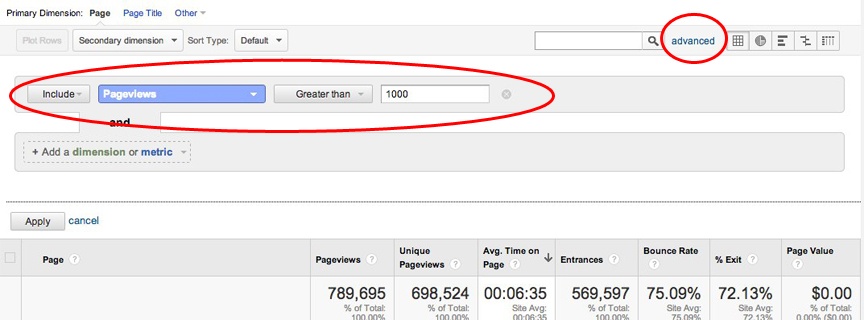
To correct for this problem, we can use Google Analytics' Advanced Filters. Click on the "advanced" link and create a filter for Pageviews > 1000. That will throw out the statistical outliers and focus on pages that have been viewed at least 1,000 times.
Now, the report shows those pages that get a reasonable amount of traffic and that visitors find compelling. Chances are that these pages contain content worth promoting.
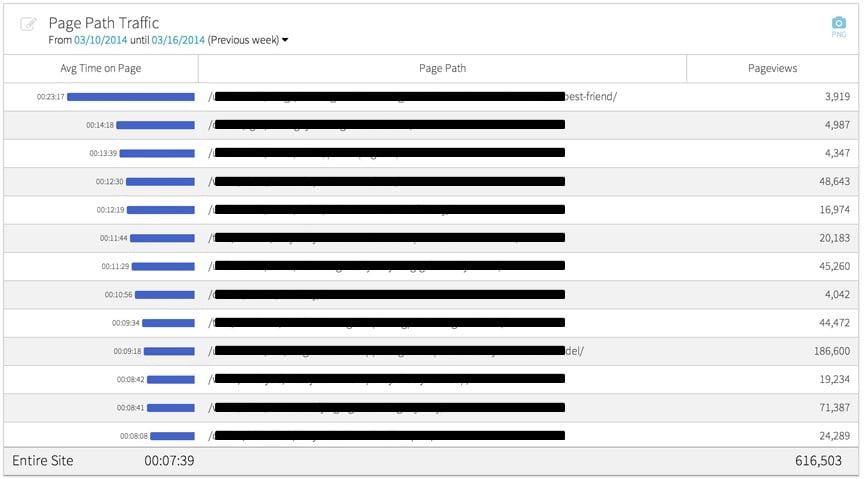
The Megalytic Page Traffic widget also lets you filter out low traffic pages, so that you can include a "top content" table in your reports. Use the the "Exclude Traffic" selector to specify how much traffic to filter out. Here, we are excluding pages that get less than 0.5% of the site traffic.
The result, with filtering turned on, is shown below. The left column provides a graphical representation of the Avg Time on Page and the right column shows the total Pageviews.