To train your team on analytics, you must first make them care about analytics. You’ll need to break out their money metrics and show each person on your team how analytics directly relates to their work.
This includes your CEO. You need to make sure the owner of your agency gets the value of analytics. To do this, show him or her how analytics lies at the heart of proving value to clients – clients whom you want to continue doing business with you and to increase the size of their retainers. Without web analytics, you can’t tell the whole story of how a website build, blog content or ad campaigns are contributing to business. Show him or her examples of reports you can build for clients breaking down specific successes. Help the CEO see how being able to report on success is equally as important as the success itself.
Next, you need to show individual team members how analytics relates directly to their jobs. This may involve one-on-one conversations with each department to get buy-in. For account managers, this may mean talking about how analytics helps to reinforce the agency’s value by measuring the impact of every marketing channel. For production teams, show how data on engagement, pages viewed and devices can help to inform the website build process. For content writers, show how analytics data can help them measure the marketing performance of content, ultimately helping to inform future content strategy.
Once you’ve reinforced the value of analytics through a cursory overview, schedule additional trainings to help your agency further their analytics knowledge. The goal of your training is to work analytics into every step of the agency’s process.
Set aside time for in-person sessions to provide an overview of analytics features to your team. Gather a group in a conference room for an hour, walking through top level reports on a screen and explaining metrics. A training session can help walk people past the initial barrier of intimidation they may encounter upon logging into Google Analytics and seeing all the options available.
After sessions, you can point people to learn more from online resources such as Google’s Analytics Academy. In addition, provide access to client analytics accounts so team members can view metrics for themselves and learn the interface.
If your agency has a blog presence, write regularly about analytics. You can then share articles with your team to learn further about understanding metrics, reading analytics reports and interpreting data for themselves. If you don’t have a blog, use an internal collaboration tool or send the information via email.
Once your team has a basic understanding of analytics, work in analytics throughout your processes for client work. This can include any projects from website development to content strategy.
If analytics data is available from an existing version of a website, design and development teams should consider that data when planning a new website. Analytics can help to answer questions about the audience coming to the current site. Work with development and design teams to show them specific reports that can help with their planning process.
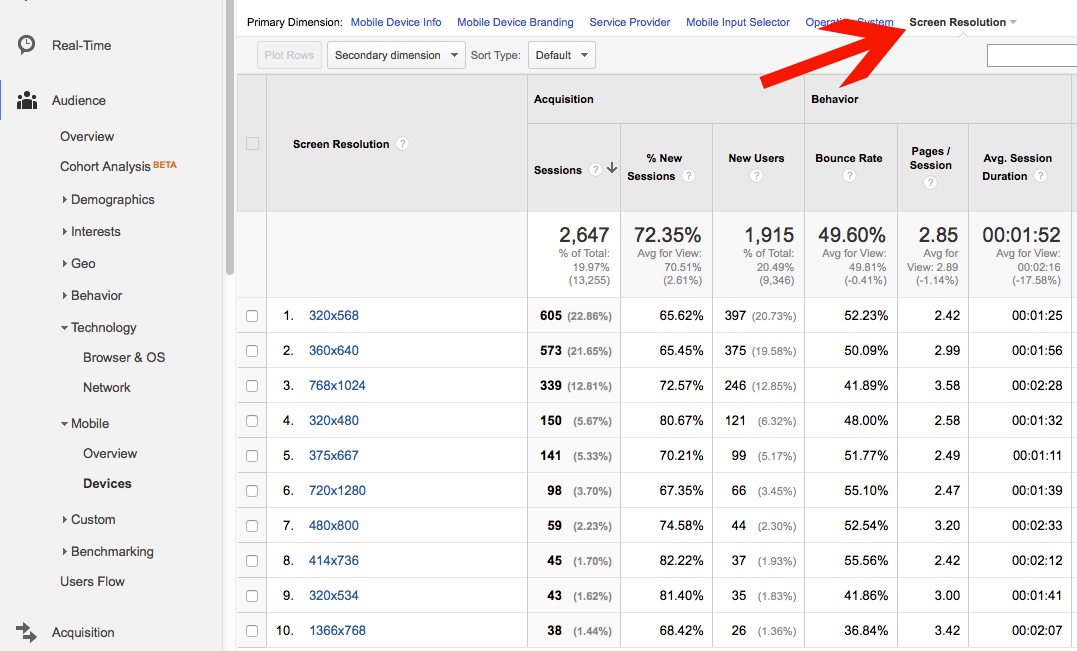
For example, say that a team just launched a new responsive site. They want to know if people are having trouble viewing the site properly at any particular screen sizes. To find out, show your development team how to view data by screen resolution in Google Analytics, navigating to the Audience > Mobile > Devices report.
Above the table of metrics, open the “Other” dropdown in the Primary Dimension line, and then select Screen Resolution. Here you’ll see a list of top screen resolutions used to view the site, along with Sessions, New Users and engagement statistics for each.
From this data, you can flag any screen resolutions that show concerning stats. For example, 375x667 shows the lowest average session duration at 1:11, compared to a site average of 1:52. This data may indicate that people are having trouble finding what they want on the site at this resolution and are leaving sooner.
From further research, this screen resolution is linked to the iPhone 6, and so designers and developers need to test the site on an iPhone 6 screen to see if any fixes need to be made. Regular review of this report can help to ensure that people are not encountering additional problems with the site as devices and web browsers change.
Analytics should help to inform content strategy. For example, say a content team regularly writes blog articles for a particular site. They should be reviewing analytics to help track performance of past articles, as well as to plan for future content.
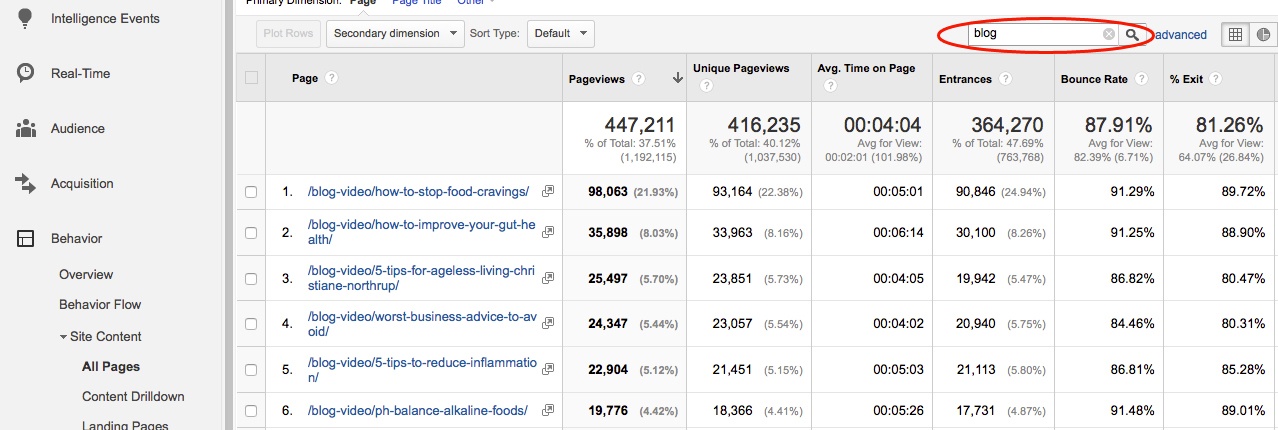
Your content team may consult analytics to learn what blog posts have been the most popular in the past. To see this information and to use it to guide future content, show them how to access the All Pages report. If URL structure allows, you can type “blog” into the search bar above the table of pages. Here, we can show our content team how to see the top blog posts viewed recently on this site.
In this example, your content team can see that an article on stopping food cravings has received by far the most pageviews over this period of time. However, we also see a higher Exit Rate than other sites, meaning people were more likely to leave the site after reading this article than others. From this data, we can conclude the topic was effective, but content elements could focus more heavily on keeping people on the site.
These are just a couple of examples in which you can train your staff to work analytics into the agency process. Data should help to inform projects from the initial build of a website to the writing of content to the launching of an ad campaign for promotion. Take the time to teach team members how to access analytics and how to apply it to their own fields.
Every member of a digital agency should develop at least a basic understanding of web analytics and how that knowledge can improve your work for clients, whether writing code or designing graphic ads. Analytics professionals within agencies should work to actively train their colleagues, first, to get the value of analytics, and second, to learn about accessing and understanding metrics relevant to their work.