Darker, crisper fonts and sharper borders make reports even more attractive and easy to read. Here’s an example of the Rolling Average chart showing how well all the elements “pop” off the screen and printed page.
The latest upgrade is packed with enhancements such as:
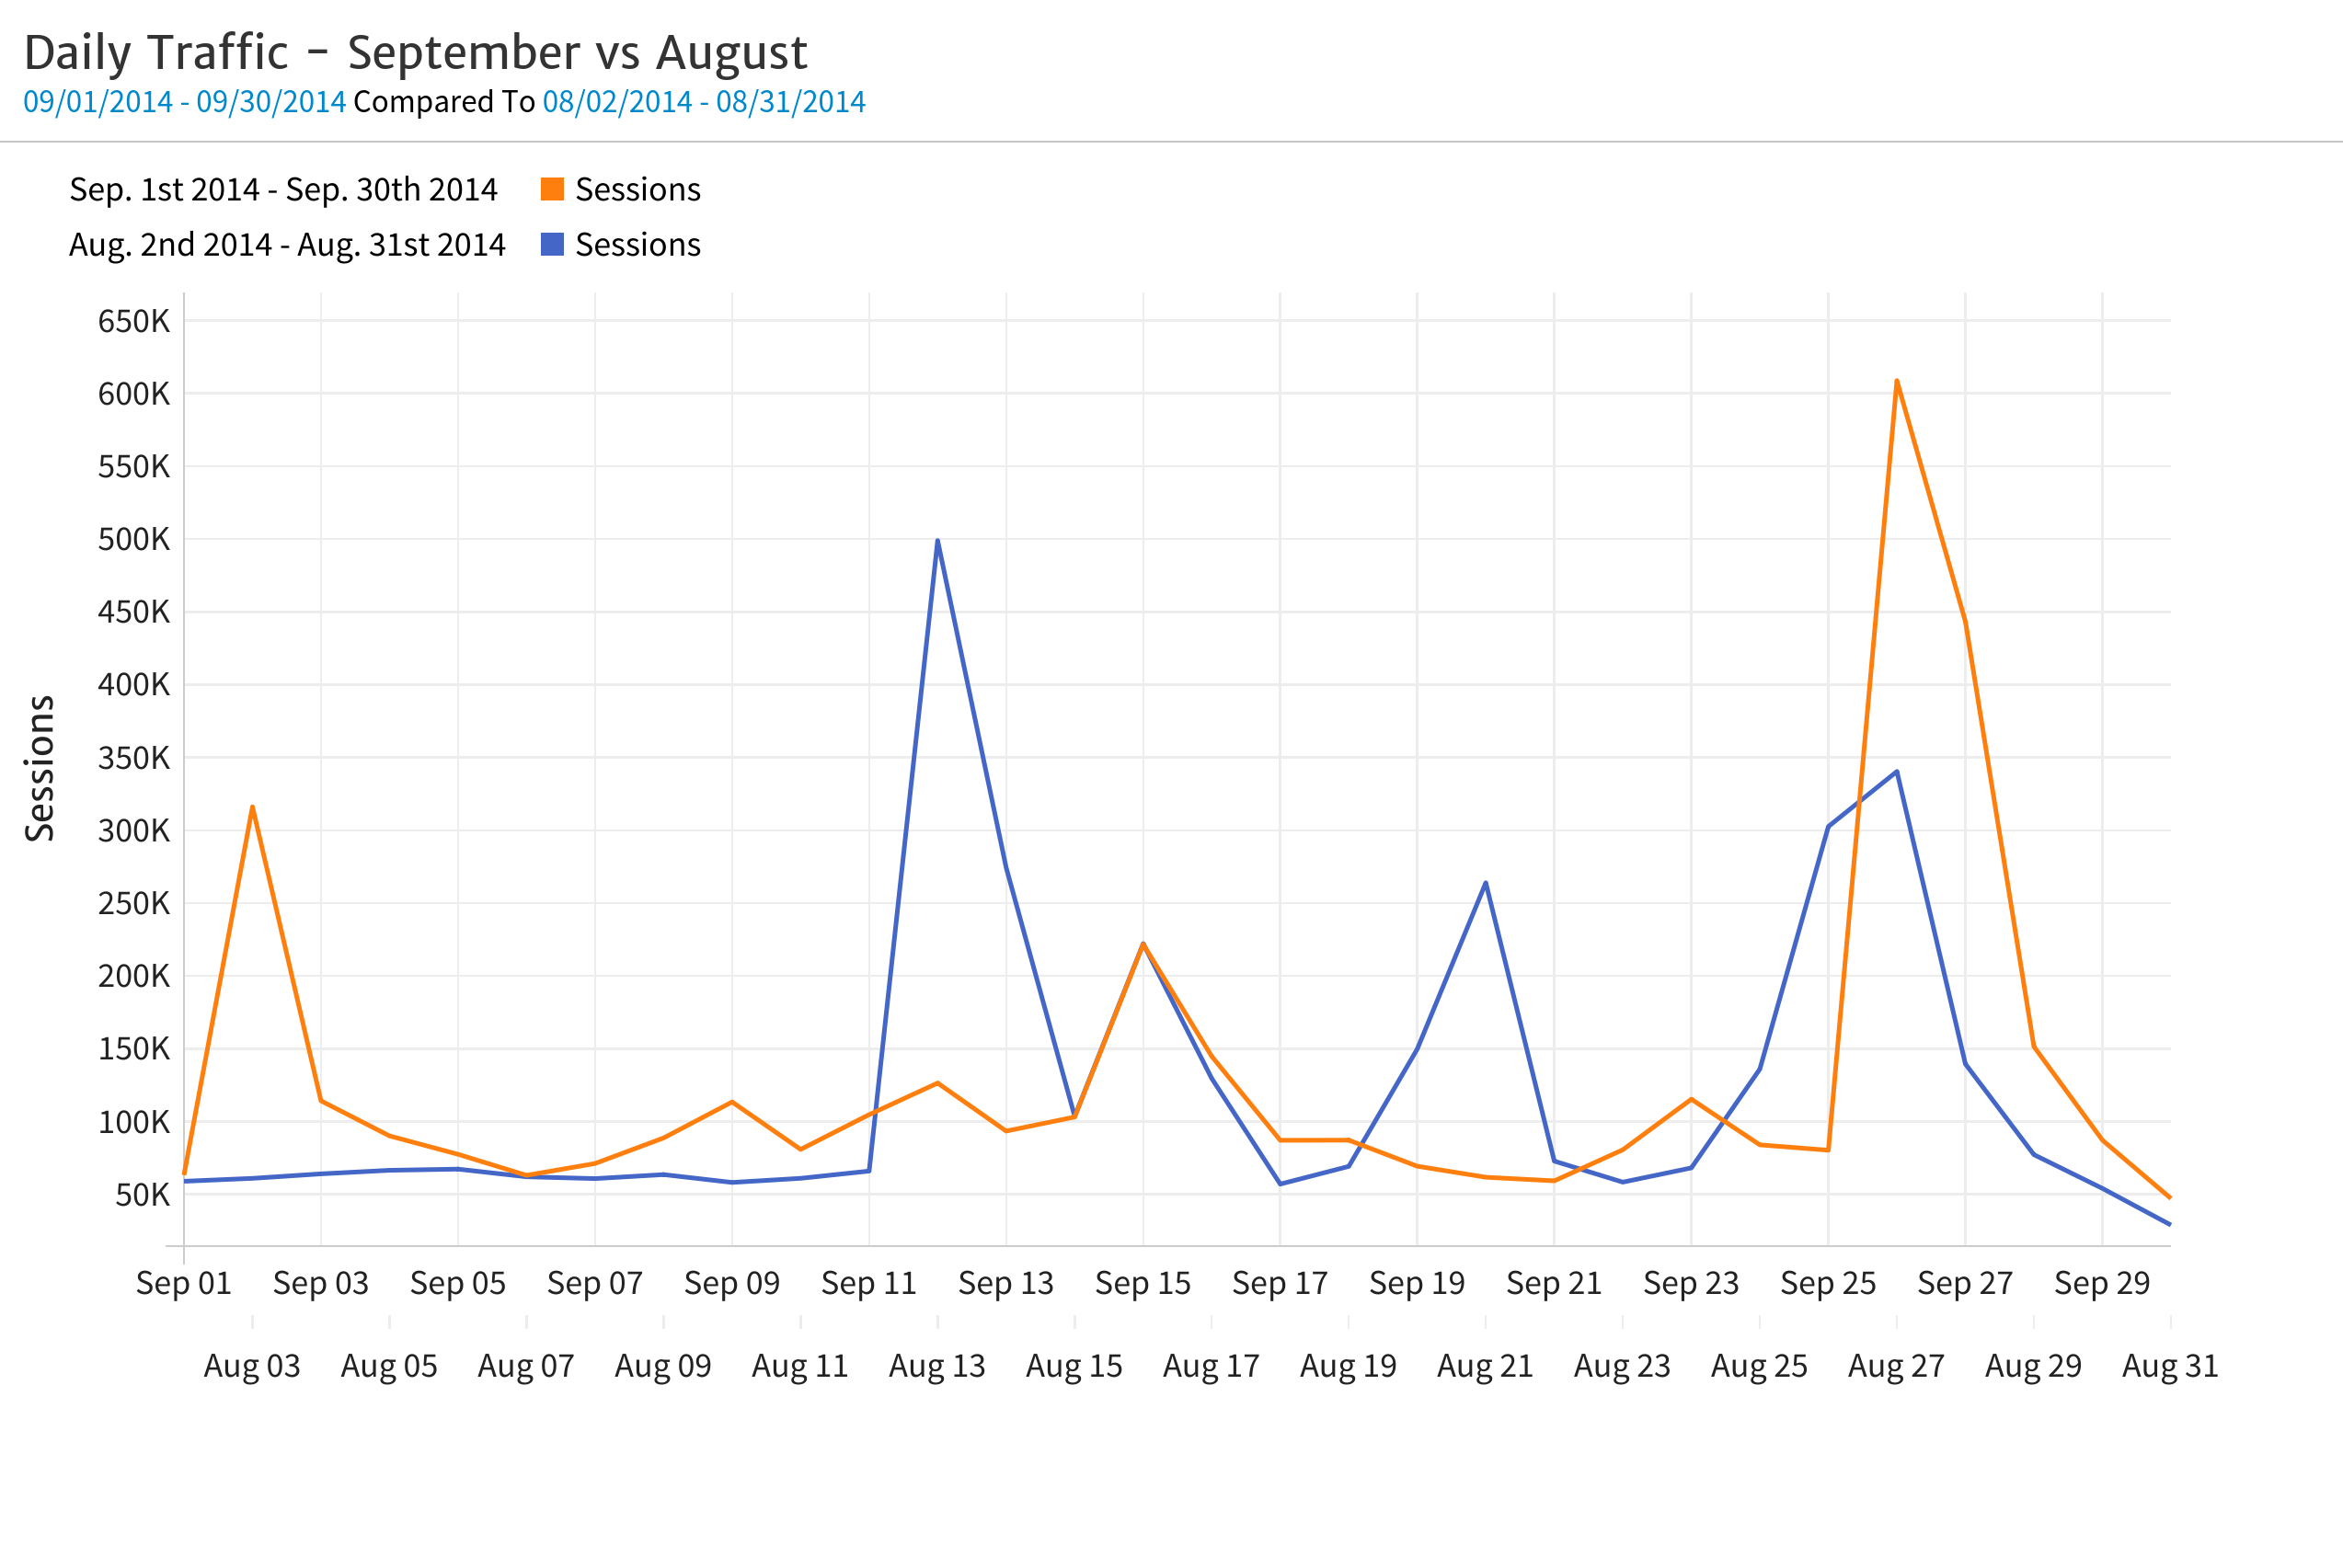
Megalytic has always supported date range comparisons in tables. Now, we support date range comparisons using line or bar style time series charts. For example, the chart below shows the daily traffic for September vs August. Check out this support document to learn how to make these types of charts: Date Period Comparisons.
Megalytic now has full support for demographic data from Google Analytics. You can create charts and tables that show metrics by gender, age group, affinity, in-market, and other categories. Read this support document to learn how to use demographic data: Demographic Data.
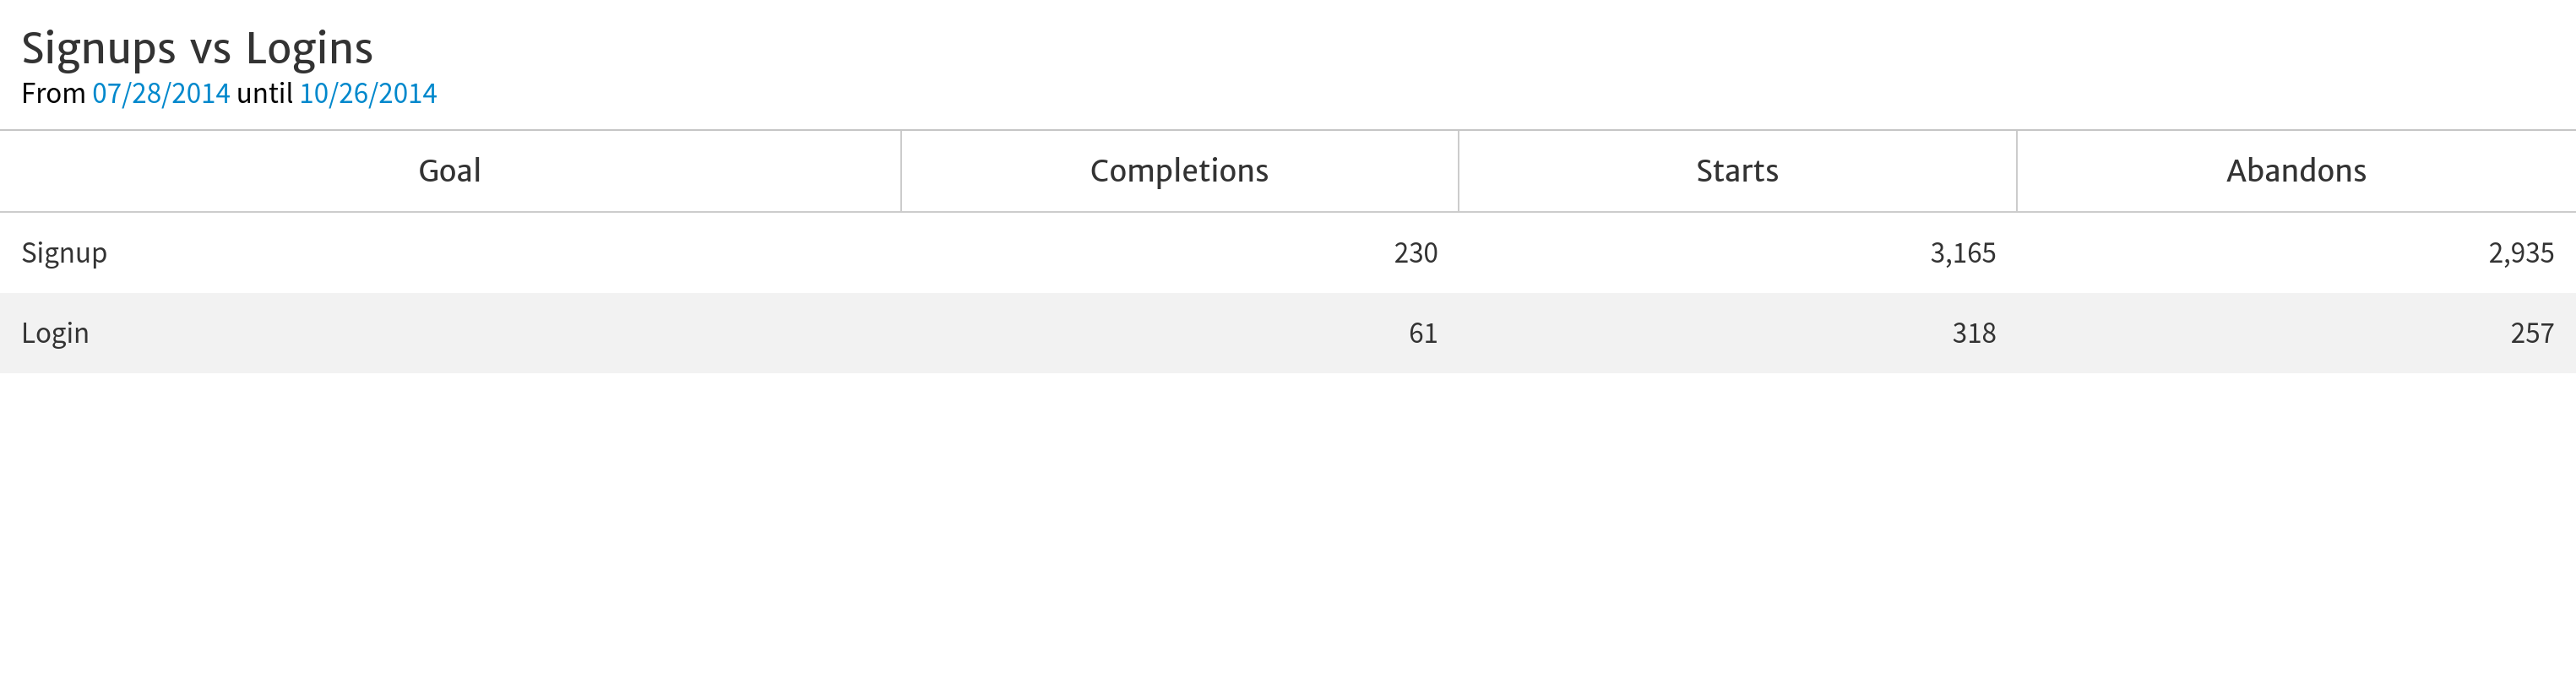
You can now compare Google Analytics goals with each other in a single chart or table. For example, if you have goal tracking for both signups and logins, here is the kind of table you can create that tracks them together.
Check out the support documentation to learn more: Multiple Goals Widget.
Long reports are easier to read and reference with page numbers. You can now turn them on and off in the report editor as described in the support document: Page Numbering.
Report logos can now be resized and aligned left, center, or right. Improved flexibility to make your cover pages look just right. See the support document: Resize and Align Logos.
Often times, you want to add multiple copies of a widget to a report. For example, suppose you have 8 campaigns and you want to show a table of the conversions by age group for each campaign. With the new widget copy feature, you can simply set the widget up once, copy it 7 times, and then change the campaign filter in each widget to correspond to each of your campaigns. See the support documentation for details: Copy (Duplicate) a Widget.
You can now open the widget library from anywhere within a report (without having to scroll back up to the top to click “+Add Widget”). In fact, all the basic report actions are available from anywhere in a report because the report toolbar scrolls along with you as you edit your report. See the support documentation: Report Toolbar.
Sometimes, for reporting purposes, you want to change the name of the Google Analytics Property and View. For example, if many of your Views are named “All Website Data”, this can cause reports to be confusing. Megalytic now lets you change these default names, so you can use more descriptive names in your reports. See this support document to learn how: Changing Connection Names in Reports.