
May 21, 2024
Tracking Revenue from Facebook Visitors using Google Analytics Goals
By Megalytic Staff - February 04, 2015

Setting Up a Goal with a Value
To attribute revenue to Facebook users, first set up a Goal that includes a value. As an example, we’ll use a brand that uses social media to not only drive users to the content on its site, but also to promote the purchase of an eguide. Users find out about the eguide through direct social posts, as well as promotion within site content.
First, set up a Goal to include a value. Start by going to the Admin screen in Google Analytics, choosing the View you’d like to use and select Goals under that view. Next, choose “New Goal” and begin to specify your parameters.
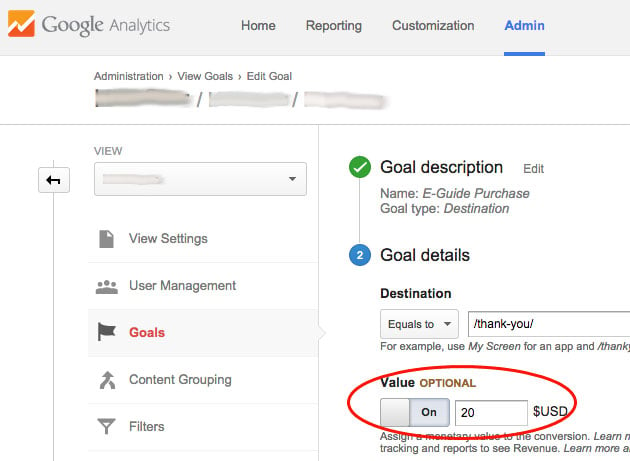
For our example site, any time a user purchases the eguide they land on a “thank you” page. We will set our Goal to register anytime this page is reached. In addition, we’ll turn on the Value option, denoting the $20 cost of the eguide.
Now, whenever we look at results from this Goal, we will also see the total revenue tracked as Conversion Value.
Viewing Revenue from Facebook
To specifically view revenue from Facebook, go to Acquisition > Social > Conversions. At first, you’ll see total numbers for all Goals. You’ll want to select a specific Goal using the Conversion dropdown above the graph.
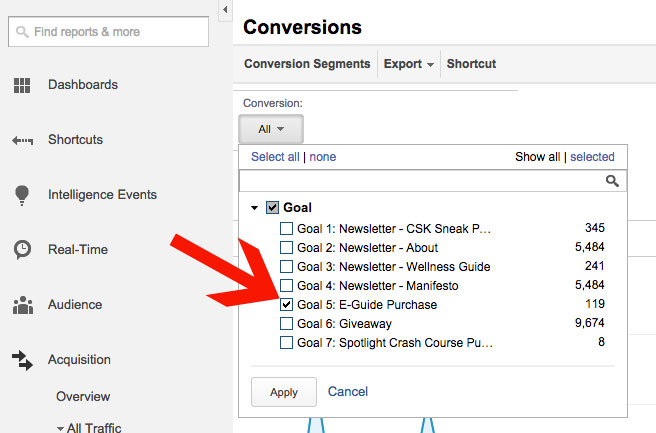
For this scenario, we’ll choose the eguide purchase as our Goal by selecting its checkbox. After applying this to the report, we’ll now see social networks, Conversions and Conversion Value filtered specifically to show eguide purchases.
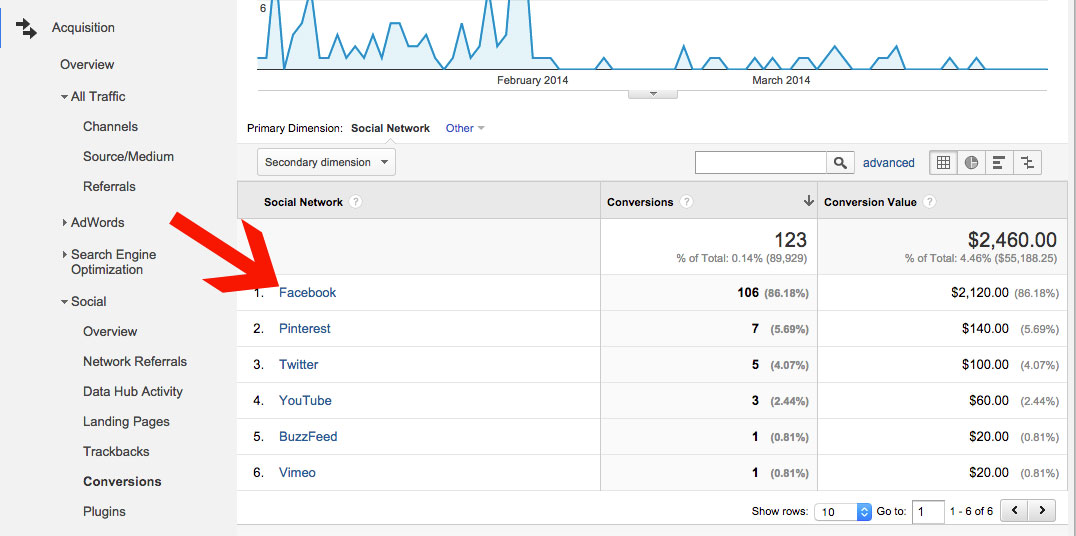
Here, we see Facebook without question tops the list of social networks for eguide purchases, driving more than 100 sales and over $2,000 in revenue. Clearly, Facebook contributes not only traffic to the site, but traffic that converts, and it plays the largest role by far out of social networks in contributing to revenue for this site.
How Does Facebook Stack Up?
That last report showed Facebook’s revenue contribution compared to other social networks. It did not reflect how Facebook’s performance compares to that of the site as a whole. We don’t know how the total value compares to the value driven by other channels, such as search.
To compare the performance of specific sources, look at the All Traffic > Source/Medium report.
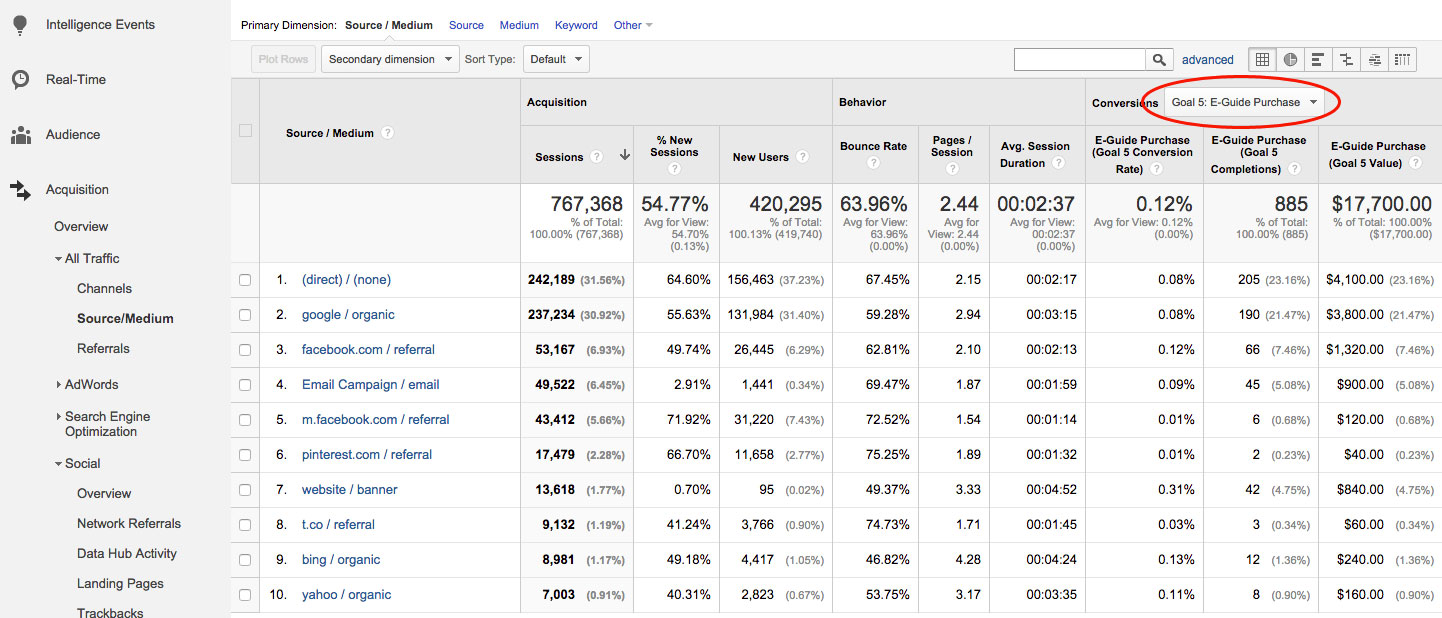
In this report, we’ve filtered the conversion columns at the right to display the eguide purchase. First, we see a lot of direct traffic, which can include anything from people accessing the site directly, to untracked organic search, to improperly tracked email campaigns.
Unfortunately, we don’t know the source of this direct traffic, but we can see that Google organic traffic appears to be the next most significant contributor to eguide purchases. We also see Facebook represented separately by facebook.com (desktop site) and m.facebook.com (mobile site). To better compare Facebook with other sources, we’ll create a segment that will aggregate all Facebook traffic.
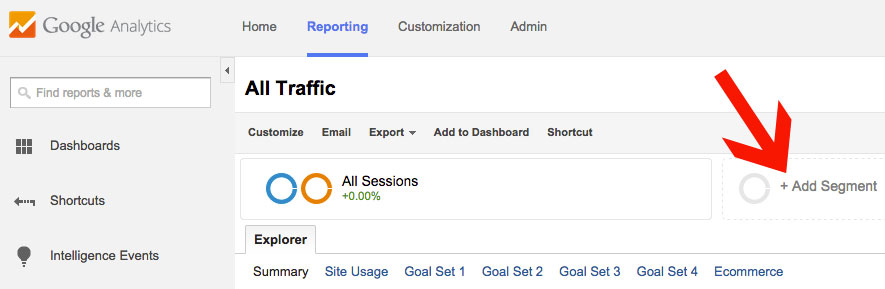
To do this, we’ll start by selecting “Add Segment” above the graph in the Analytics reporting interface.
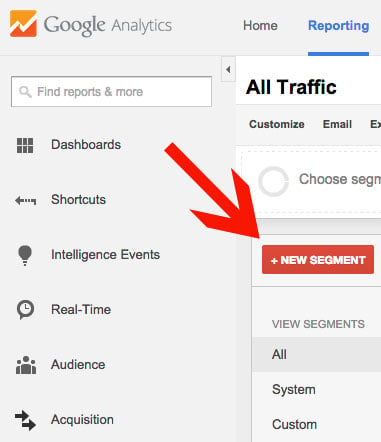
Next, we’ll select the red “New Segment” button and move on to define our segment’s parameters.
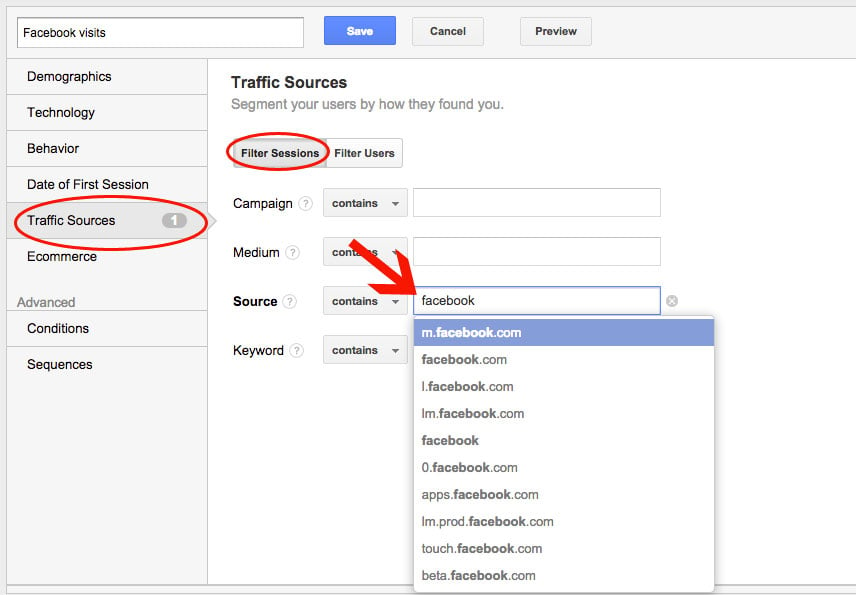
Within the box that appears, we’ll go to Traffic Sources, choose to Filter Sessions and set the Source to contain “facebook.” As you can see, Facebook referrals include a number of possible URLs, so we group these together in one segment.
After naming and saving the segment, we can now apply it to our Google Analytics view. We’ll also select the All Sessions segment so we can easily compare Facebook’s performance with overall metrics for the site. In addition, we’ll add an Organic Traffic segment, included by default in Google Analytics, to compare metrics with what we saw to be the largest driver of purchases, apart from Direct.
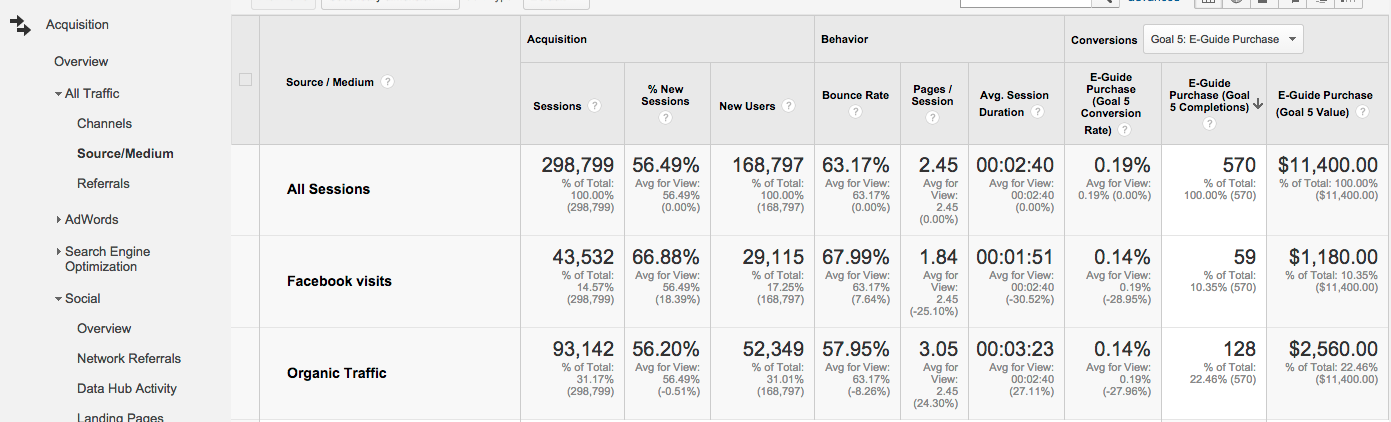
Now, we can see metrics stacked up for All Sessions, Facebook and Organic Traffic, once again with the eguide purchase selected as our Goal in the conversion columns. We’ve also narrowed to a slightly shorter timeframe because of the volume of data affecting accuracy when looking at multiple segments.
In this timeframe, we note that people from Facebook were just as likely to purchase the eguide as people from organic search, shown by the conversion rate being the same (.14 percent). However, since organic search received nearly twice as many sessions, it also received twice the number of conversions.
From this data, we can determine the traffic coming from Facebook is just as valuable as that coming from organic search, but at a lower volume. This conclusion is quite significant, since many sites see Facebook contributing to branding but not directly to sales. Also note that Facebook shows lower engagement, with a higher bounce rate, fewer Pages/Session and lower Average Session Duration than organic search while still converting at the same rate. This means that lower engagement does not always equal lower revenue from a traffic source.
We also note that sales from Facebook referrals account for around 10% of the website’s total sales for this product. In seeing the value of Facebook traffic, this site’s owner could push to more heavily promote the eguide to Facebook followers to raise this percentage. Of course, maintaining a balance between building a relationship with your brand’s followers and direct selling becomes an important factor.
Conclusion
As shown in this post, Facebook can clearly contribute directly to revenue. The extent to which Facebook traffic can drive revenue for your site depends on your industry, your social media strategy, and your content. Google Analytics provides features that enable you to track this revenue by setting up Goals with dollar amounts of value attached and then looking at Goal performance by source.
Comparing Facebook to other traffic sources reveals its relative importance as a source of revenue. If your Facebook traffic isn’t contributing significantly to revenue, you may want to start identifying opportunities to promote your products directly to your audience on Facebook.