Megalytic widgets support a variety of chart types for displaying data, including line, bar, pie, map, table, and table chart. More types may be added in the future
Watch the video tutorial: Working with Chart Types
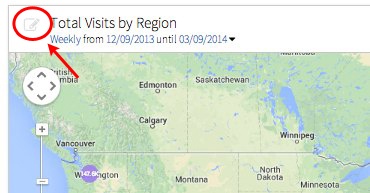
Each widget has a default chart type – the one you see when you add the widget to a report. The chart type can easily be change. For example, when you use the Traffic by Geography widget, the default chart that you get is a map. To change it to a table, first open the widget editor by clicking in the upper left corner.
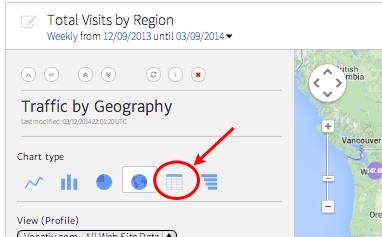
You will see that the map chart type is selected. Click on the table chart type, as shown below, and the date will be displayed in a table instead of on a map.