The Multiple Goals widget enables you to display conversions for multiple goals in a single table or chart. For example, suppose you have created goals for logins and signups and you want to track which are happening most frequently. You could use the Multiple Goals widget create a table comparing these goals.
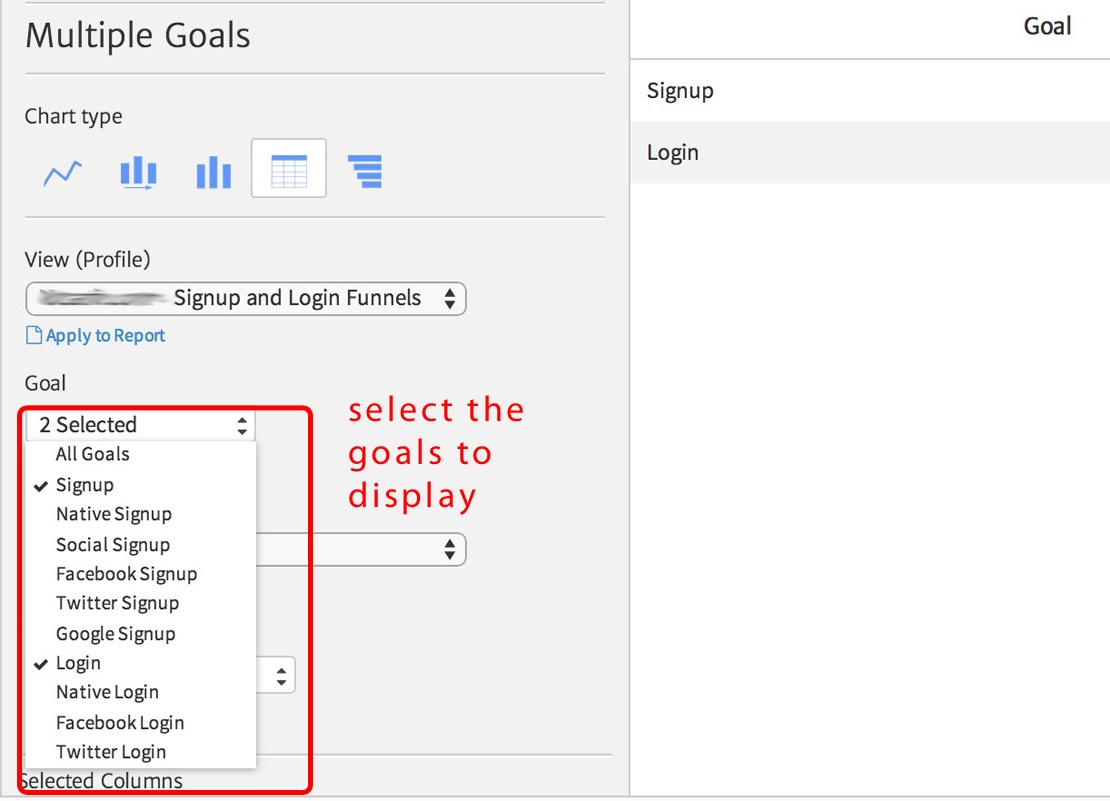
From within the editor of the Multiple Goals widget, you can select that goals that you want to display.
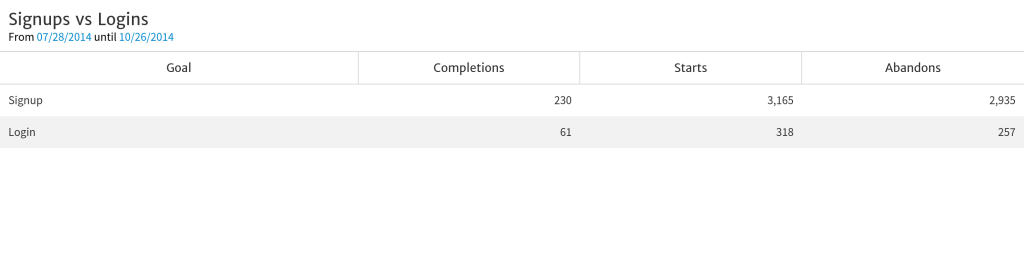
The result is a table which compares the two goals.
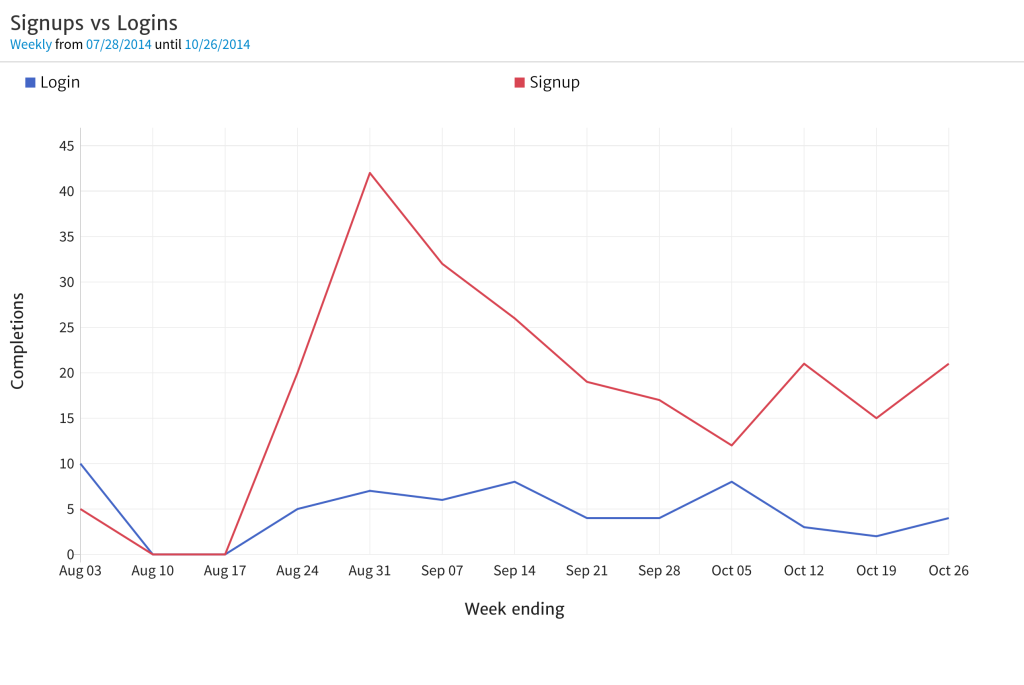
You can also compare multiple goals over time, simply by switching the chart type from table to line.