In addition to the eCommerce widgets in Megalytic, the General Purpose widgets also support reporting on eCommerce metrics.
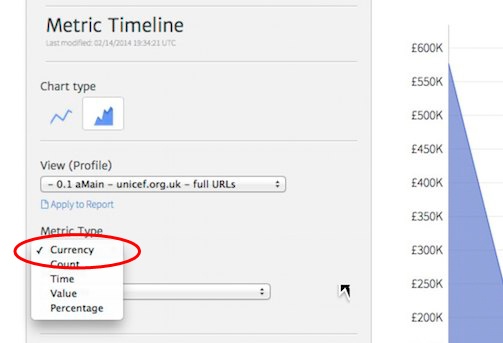
For example, to create a chart showing revenue over time, select the Metric Timeline widget, open the widget editor, and select Currency from list provided under Metric Type.
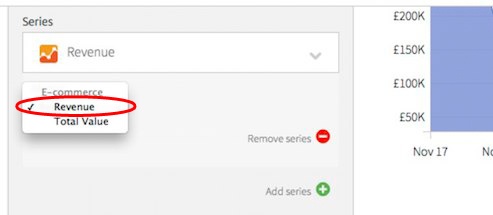
Next, to select the eCommerce metric to display in the chart, scroll down in the widget editor to the Series section, open the first series by clicking the down icon, and choose the metric you want from the list.
Metric Timeline will allow you to display multiple metrics – but only if they are of the same type (in this case currency). If you want to chart revenue vs visits (for example), you need to use the Double Axis widget.
Create a Double Axis widget, and open its widget editor. Scroll down to the Series section, and open each series. For the top one, select Revenue. For the second one, select Total Visits.
.jpg)
The Double Axis widget will chart the revenue against a currency axis and the visits against a count axis. The final product looks like this.
.jpg)