![]()
Dig Deeper than Bounce Rate
When looking at engagement, many of us automatically think of the standard metrics: Bounce Rate and Avg Session Duration. But these metrics often provide only a superficial view.
For example, on a blog, the bounce rate can be artificially high because of the natural behavior of blog readers. Readers may be highly engaged while reading only one page – the page they came for – but cause a high bounce rate because they finish the article and leave (see this, rather technical post, for some JavaScript that will help with better engagement tracking for blog posts: How To Track Content Engagement with Google Analytics).
A low Bounce Rate, on the other hand, can also be misleading. If visitors are clicking around your site, visiting many pages out of confusion, and then leave in frustration, they are not bouncing, but they are also not engaging in a positive way.
Use Events to Measure Positive Engagement
On your site, there are probably certain types of actions that indicate when a visitor is having a positive experience and moving toward conversion. Tracking these actions as Google Analytics Events will help you to more accurately measure the quality of traffic coming in from your company’s marketing campaigns.
A simple example is tracking “add to shopping cart” actions. But other types of actions can offer good insight, as well. At Megalytic, we often run campaigns intended to sign up trial users for our product. Doing so, we noticed that some campaigns produced lots of trials with a high conversion rate, while other campaigns produced a lot of trials but resulted in few paying customers.
To get a handle on which campaigns produced the best trials, we started using Google Analytics Events to measure engagement during the trials. To do that, we started by mapping many of the important clicks that happen during a Megalytic trial, to Events, like this:
![]()
At the top of this diagram is the Megalytic toolbar, where users can initiate actions like adding a widget to a report (+Add Widget) or scheduling a report for delivery (Schedule). Clicks on the toolbar are mapped to Events. Each Event is defined by a category, action and label. As described in the Google Documentation, these are the parameter values needed to define an Event.
Organizing Events
It is important to organize your Events so that, for example, all actions related to sharing are tracked in the same category. At Megalytic, we used three categories for our trial account tracking Events: Editing, Scheduling and Sharing. These are the primary groupings of Events that trial users engage in when working with Megalytic.
The Google Analytics Top Events report (Behavior > Events > Top Events) shows the Events grouped by these categories. As you can see, Editing Events are the most common, followed by Sharing and then Scheduling.
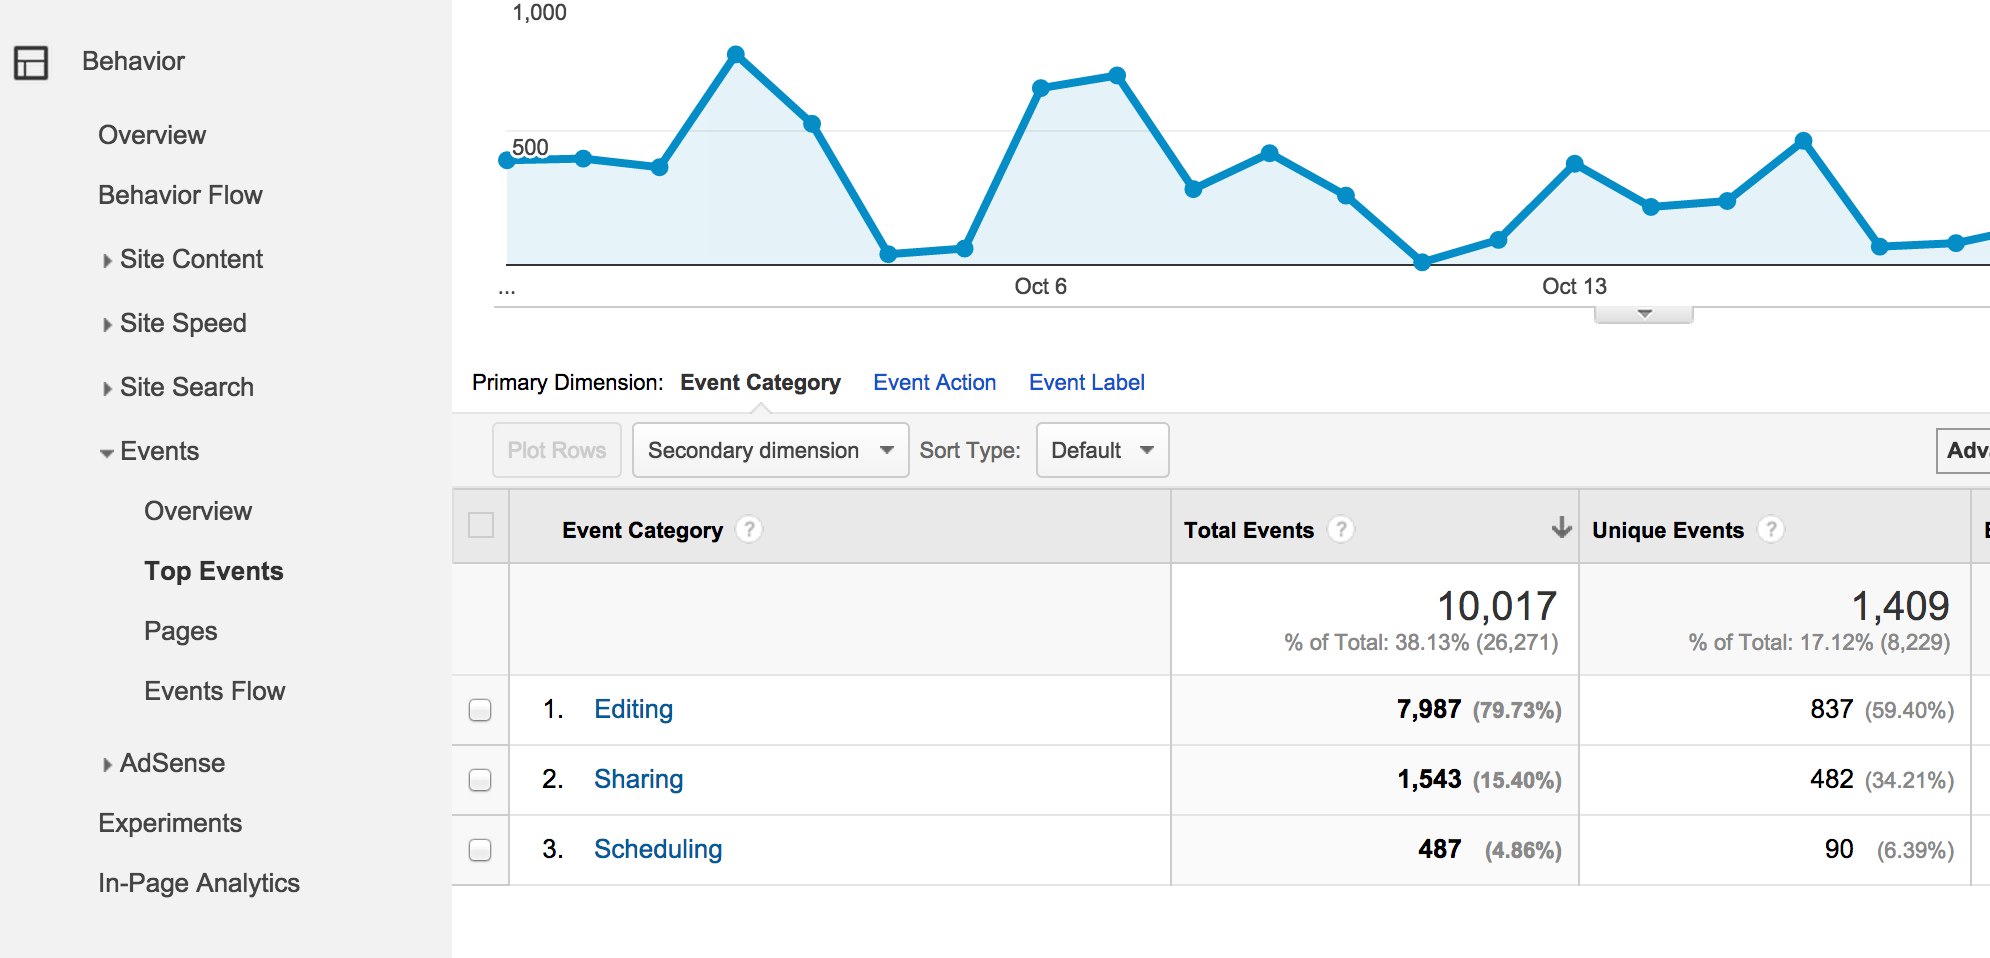
By itself, this data doesn’t tell us much about which trial users are “high quality” – i.e., likely to convert into paying customers. To figure that out, we need some more information.
Connecting Event Data with Individual Users
The next step is connecting this Event data with individual users. We wanted to see if certain Events were better predictors of conversion. For that, we needed to match up Events with the users who converted.
When trial users sign up for a Megalytic account, they provide us with an email address. Ideally, we’d like to connect the email addresses with the Events. But an email address is personally identifiable information, and Google’s guidelines prohibit storing such information in Analytics. So, instead of storing the email address, we stored a unique UserId in a Google Analytics custom dimension.
Adding this UserId as a secondary dimension to the Top Events report gives us a breakdown of the Editing, Sharing and Scheduling actions by account.
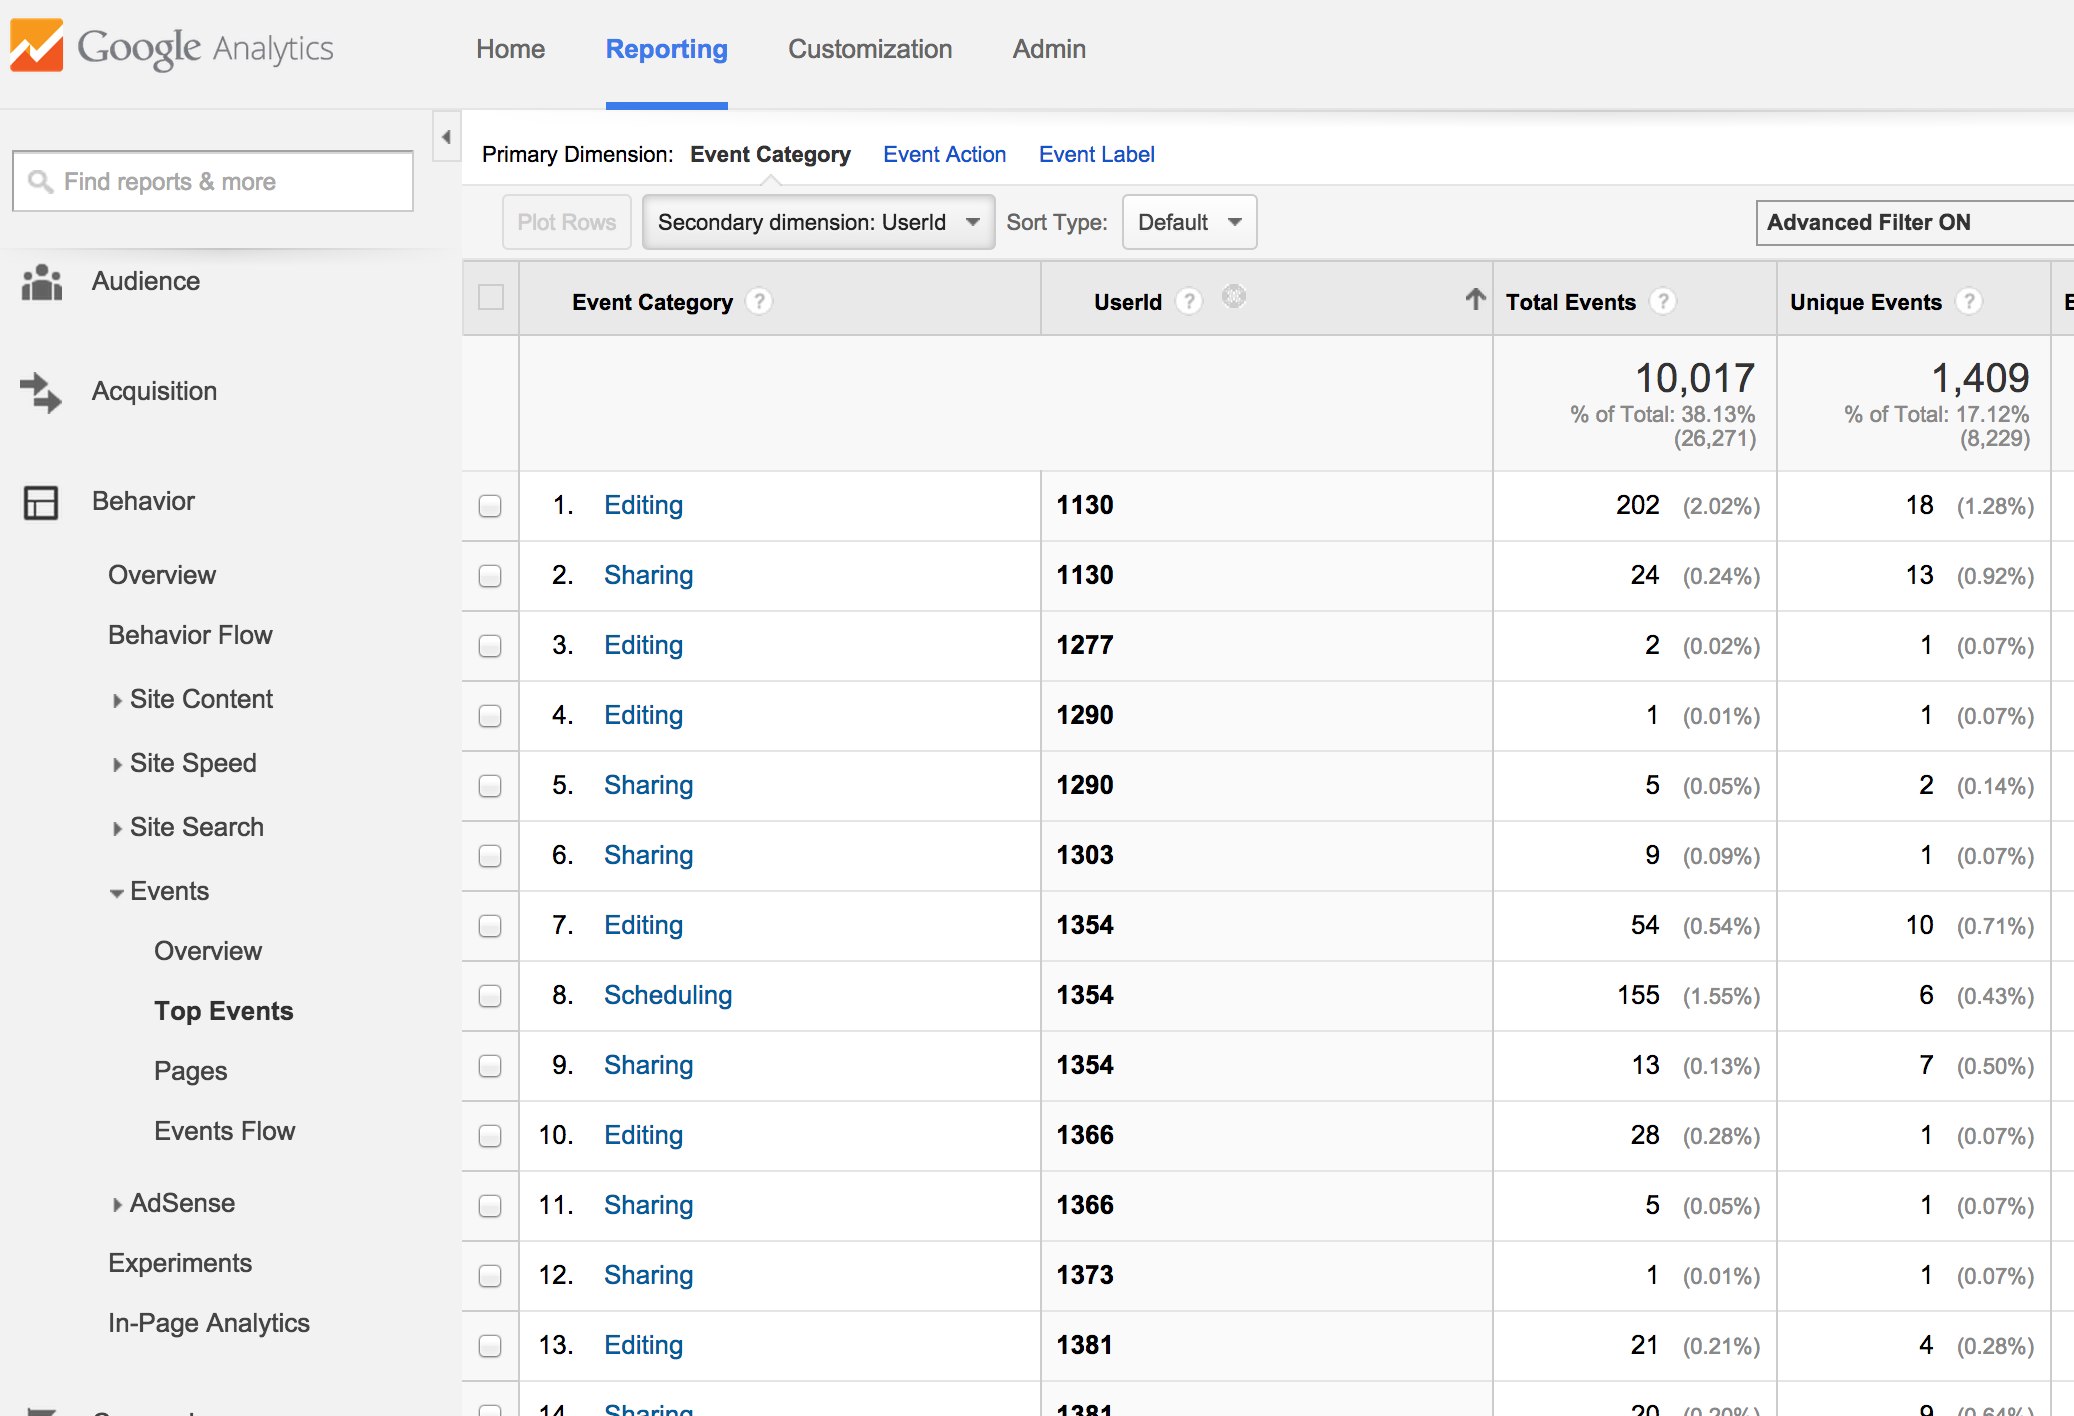
This is the data responsible for unlocking the connection between measuring engagement and predicting conversion. We exported this data as an Excel file and divided it into two groups: UserIds that had converted and those that did not convert.
When we analyzed the conversion rates of these two groups, we discovered users who had used the Scheduling features in Megalytic were significantly more likely to convert than those who did not.
We called this group the “Schedulers.” Our next step was to figure out if some of our campaigns were producing more Schedulers than others. Since Schedulers are more likely to convert, we wanted to boost campaigns that produced the most Schedulers.
Custom Segments to Isolate Positively Engaged Users
Once you have Events set up and you know which Events identify “positively engaged users,” you want to be able to compare campaigns to see which ones are producing the most “positively engaged users.”
At this point, you may be thinking, why not just measure the campaigns by conversion (purchase) rate? If your site has a lot of first-visit conversions, you can do that. But many, like Megalytic, have a much longer conversion cycle. In our case it is 30 – 90 days. By the time we have reasonable conversion data we have been running a campaign for months. We’d like to know sooner if the campaigns we are running are attracting the right audience.
To compare campaigns by “positive engagement,” you need to create a custom segment that isolates the users who are triggering the “positive engagement” Events. In Megalytic’s case, those are the Schedulers. Below is the segment we created to track them.
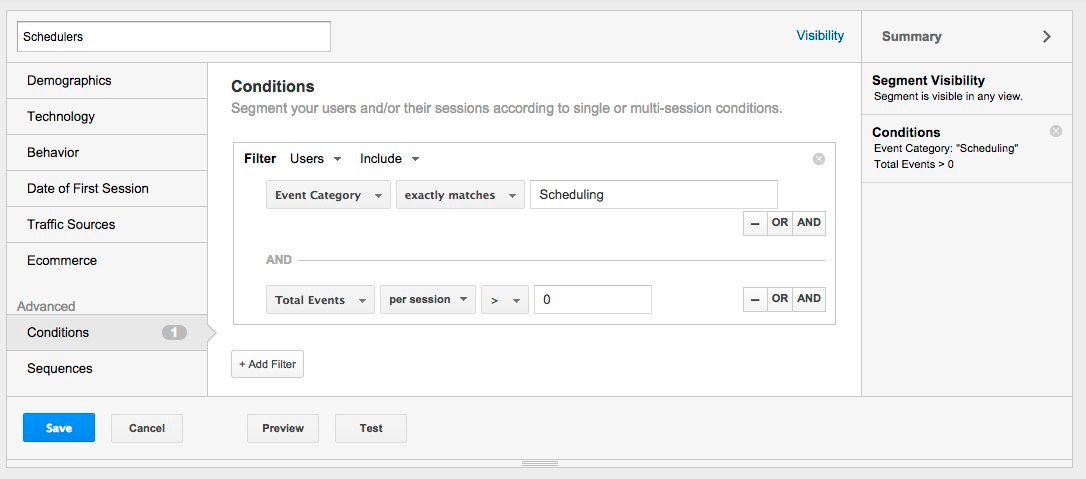
As you can see, this segment isolates the users who fired an Event with a category of “Scheduling.”
So which campaigns are producing the most Schedulers? To find that out, we used the Campaigns report (Acquisition > Campaigns), and applied both the Scheduler segment and a segment named Trial Accounts that we use to track activity from all our trial accounts.
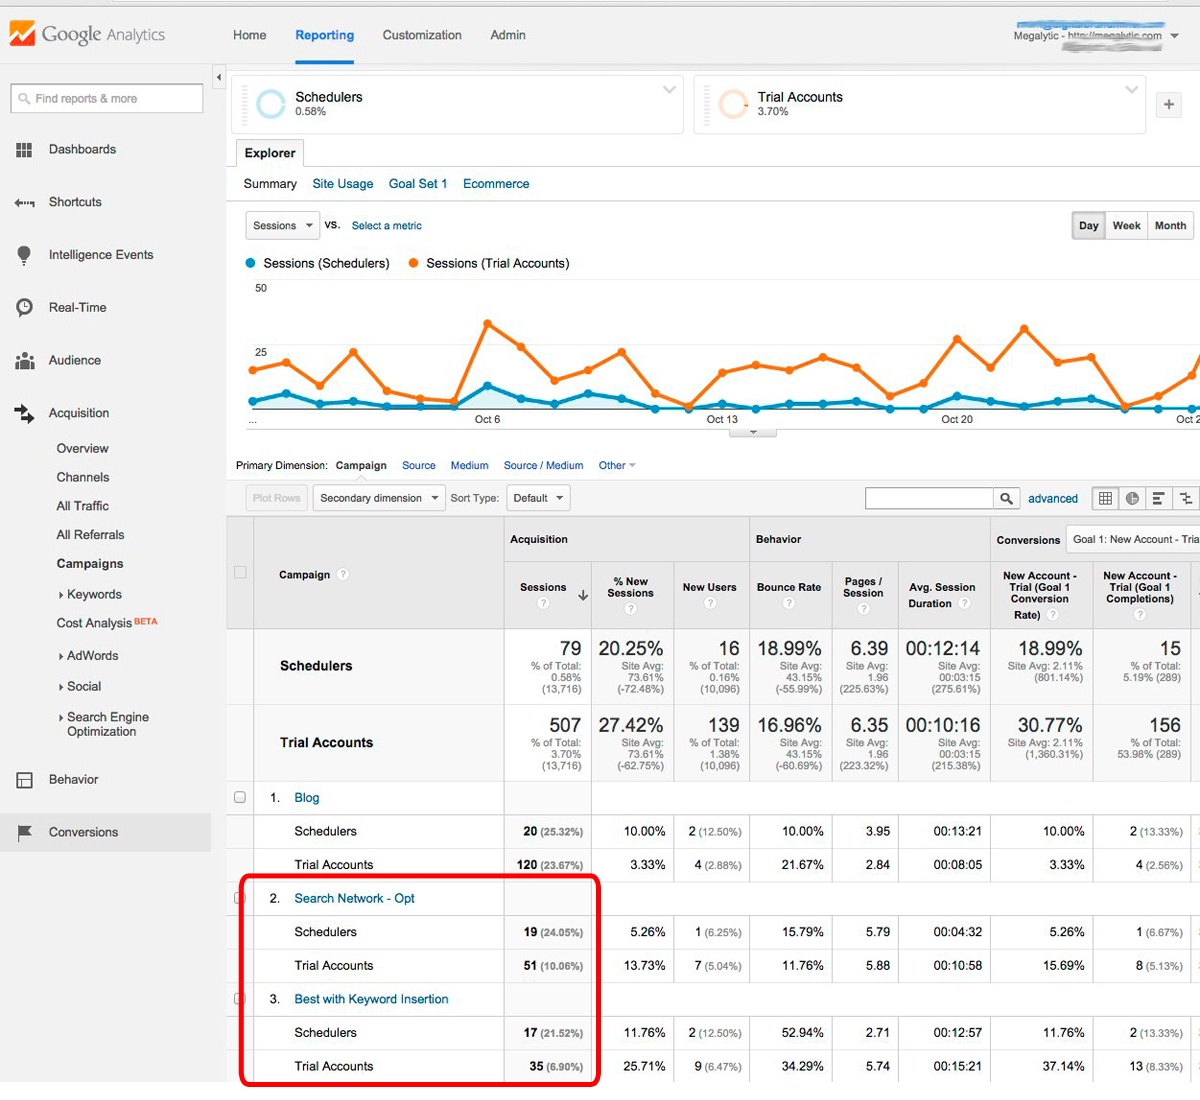
Looking at this report, we quickly identified two campaigns that were making an outsize contribution to the visits from Schedulers. “Search Network – Opt” produced more than 24% of the Scheduler visits, but only 10% of the Trial Account visits. Even more impressive, “Best with Keyword Insertion” produced more than 21% of the Scheduler visits, but only about 7% of the Trial Account visits.
Based on this data, we increased the spending on these campaigns and reduced spending on some campaigns that were not doing as good of a job of producing Schedulers.
Conclusion
Using Google Analytics Events can provide much more insight into engagement than simply looking at standard metrics like Bounce Rate or Avg Session Duration. You can use this engagement insight to identify your company’s most effective campaigns. First, track a variety of user interaction Events that indicate engagement. Then, identify which of those Events correlate best with conversion. Think of these as your “Conversion Predictors” (like the Megalytic Schedulers). Create a segment to isolate the users that produce Conversion Predictor Events. Lastly, use that segment to compare your campaigns.

