
Viewing YouTube in the Referrals Report
The Referrals report in GA allows you to see traffic volume, engagement stats and conversions from YouTube all in one place. To access this report, go to Acquisition > All Traffic > Referrals. Then, type “youtube.com” into the search bar below the graph to filter sessions.
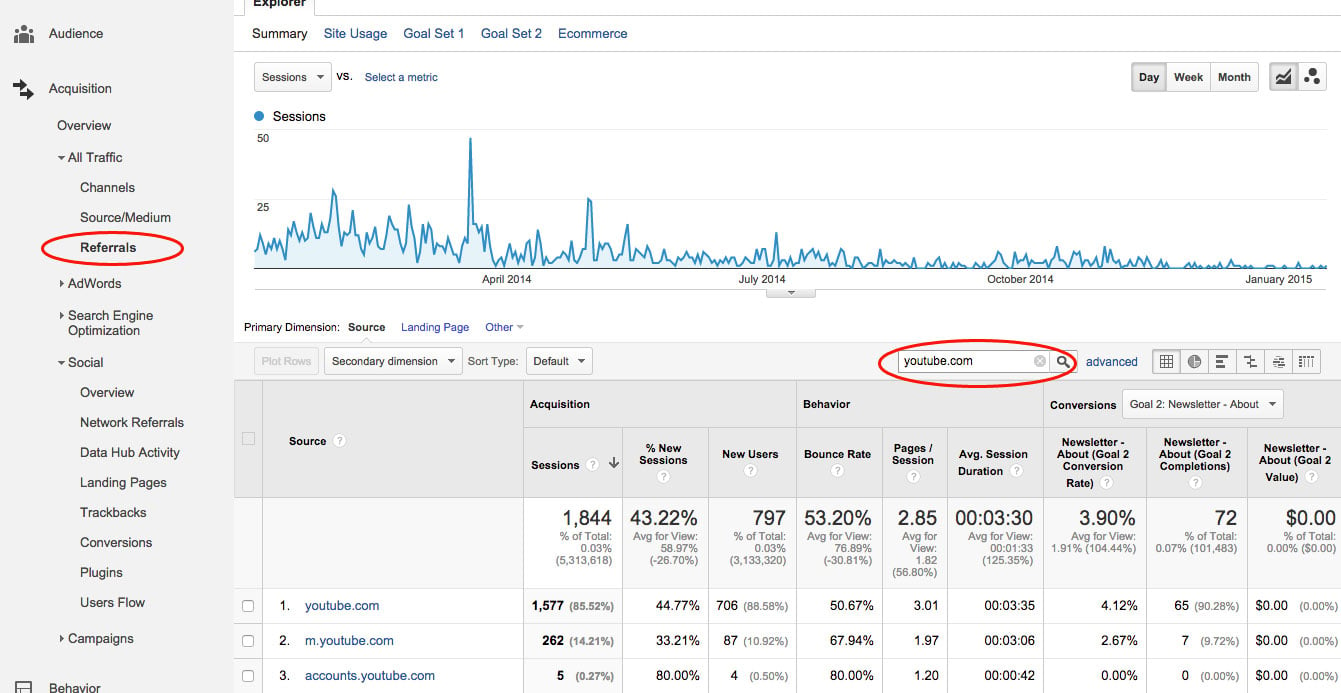
In this report, we see YouTube drove 1,844 sessions, and 797 new users. The engagement metrics (Bounce Rate, Pages/Sessions and Avg. Session Duration) for this subset also show that the quality of YouTube traffic is significantly better than site traffic as a whole. Bounce Rate is much lower than the site average while Pages/Session and Avg. Session Duration are much higher. This tells us that users from YouTube are more likely to look at multiple pages and spend more time on the site than the average users.
The % New Sessions column shows us that less than half of the sessions are from first-time visits to the site. This data means that a lot of people coming from YouTube are already familiar with the brand and may regularly engage with the content.
We can also look at the Conversions columns to determine how well YouTube contributes to the Goal of newsletter signups. Conversion rate is slightly more than double the site as a whole, confirming the quality of traffic seen through engagement. These users are much more likely to sign up for the newsletter than the average user.
Note that the Source column shows multiple URLs, breaking down visitors from the main youtube.com (desktop site), m.youtube.com (mobile site), and five sessions from accounts.youtube.com (extraneous traffic we can ignore). By looking at these specific URLs, you can compare performance of the desktop site vs. the mobile site in driving engagement and conversions.
Overall, desktop visitors show better engagement, as well as a higher conversion rate. While shorter time on site tends to be common with mobile usage, the low conversion rate is a red flag. The site owner should look at how the newsletter’s call to action to sign up is presented to mobile visitors, and should consider perhaps making it more visible or testing the signup form on a phone for usability issues.
Viewing YouTube Referrals in Social Reports
You can also view YouTube data in the Social section of Google Analytics. This method allows you to easily see all YouTube traffic together without showing separate mobile and desktop URLs or having to use the search bar to filter.
To access this information, navigate to Acquisition > Social > Network Referrals. As long as you’re receiving referrals from YouTube, you will see it in the list of social networks. This will help you see how YouTube measures up against other networks.
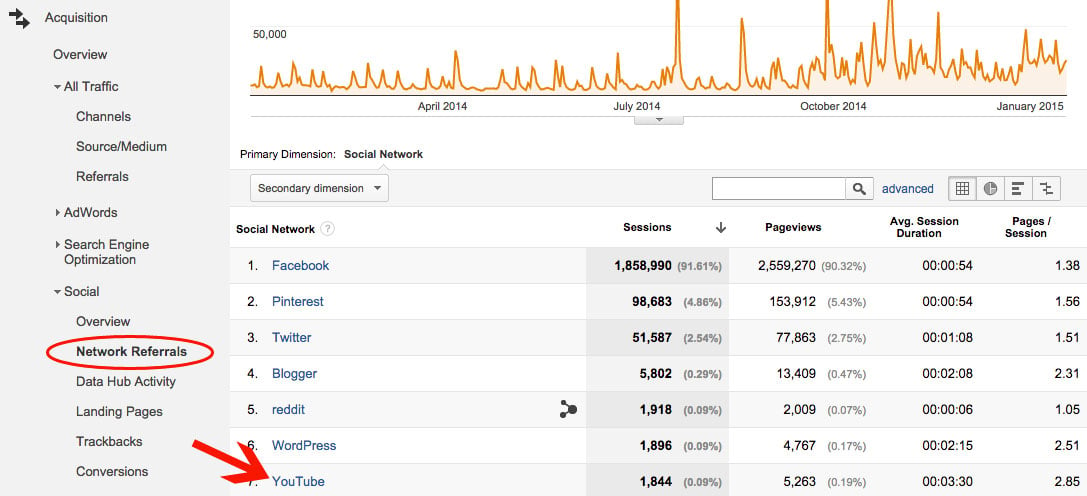
In this example, we see that while YouTube drives a fraction of the sessions coming from Facebook, Pinterest, or Twitter, sessions from YouTube show a much higher Avg. Session Duration and Pages/Session than any other channel. This data confirms that the traffic from YouTube is of very high quality.
To view the specific pages people landed on during these sessions, click “YouTube” from this list. You’ll then see a list of URLs visited from YouTube.
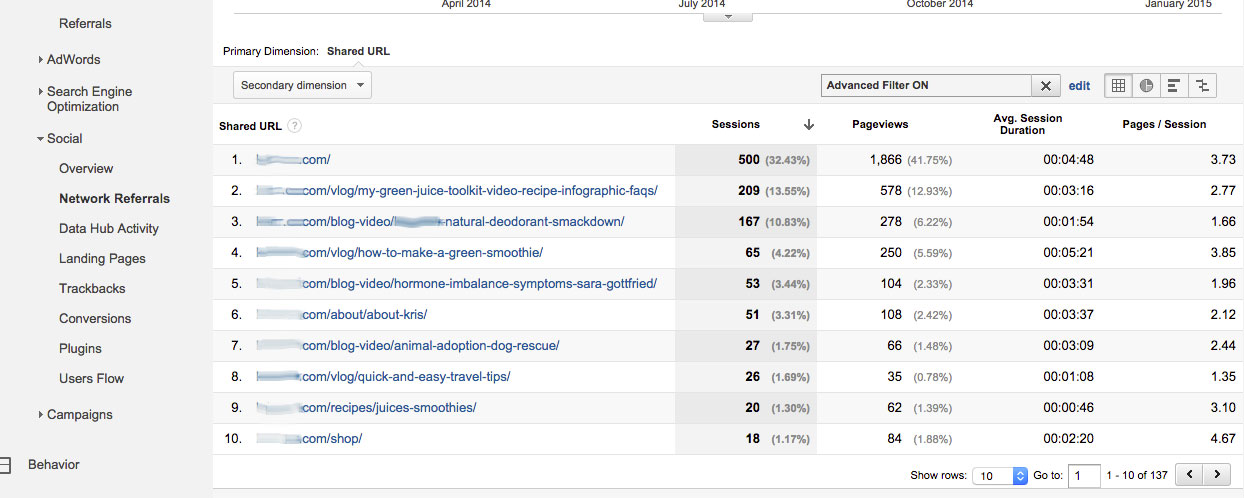
In this list, we can see the homepage at the top, a normal occurrence as your homepage will be most frequently linked to from social profiles. Next in popularity is a recipe page for green juice that includes an infographic and video. This page also shows relatively high engagement, with Avg. Session Duration of over three minutes. Also on our list is another video about making a green smoothie, helping us to determine that instructions for making “green drinks” are of high interest to this site’s audience and should continue to be part of future videos and articles.
Viewing YouTube Conversions in Social Reports
You can also view conversions within the Social section by going to Social > Conversions. While viewing conversions in this report does let you easily see YouTube conversion totals and value, you can’t see conversion rate as you could in the Referrals report previously referenced.
On this report, start by selecting a specific goal from the Conversion Type dropdown at the top. We’ve already determined YouTube’s effectiveness in driving newsletter signups, so this time we’ll choose a Goal directly connected to revenue, downloading an e-guide that sells for $20.
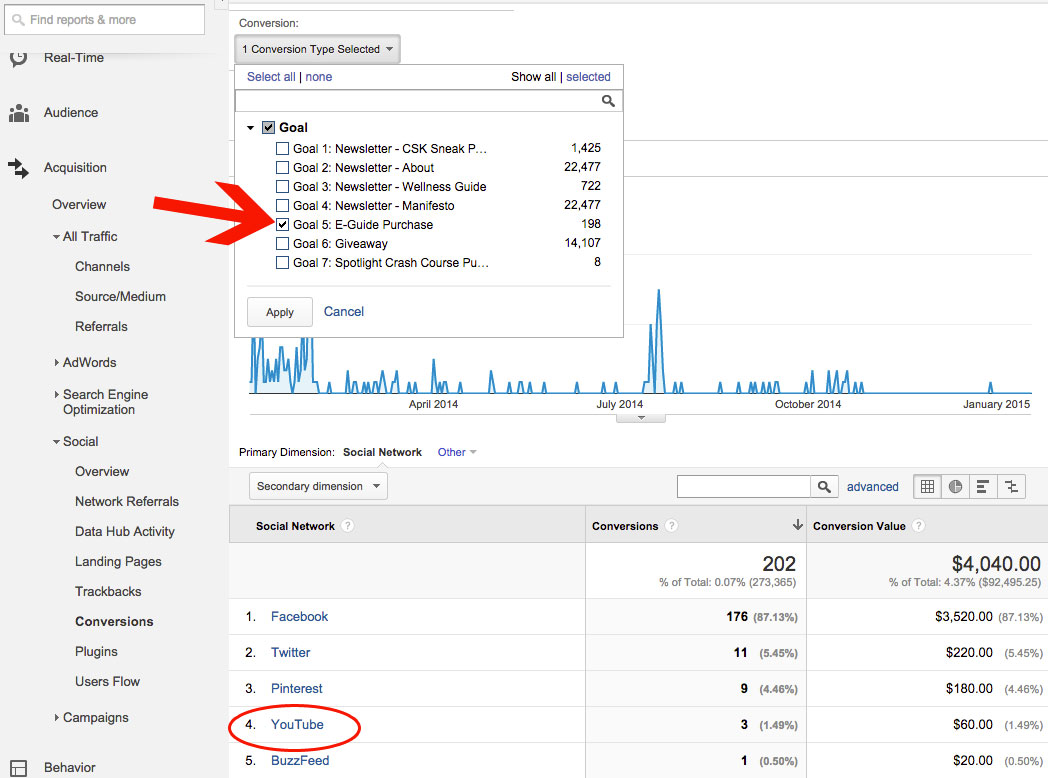
After selecting the Goal, you will see a list of social networks, with total conversions (e-guide purchases) and revenue for each. Facebook continues to rank on top as the highest contributor to conversions and revenue, partly because of sheer volume of traffic. For this conversion, YouTube only contributed directly to three e-guide purchases worth $60.
However, we did note previously that YouTube contributes to a high conversion rate for newsletter signups. Comparing the data for these two conversions, we can determine that YouTube is not well suited for driving direct sales but performs well with higher funnel conversions. Once on the newsletter list, they may then later choose to buy as they begin to further identify with the brand.
Tying the Data Together
From this data, we can show our client where YouTube is most effective – driving people to read site content and entry-level conversions. We can also show where YouTube is least effective – driving immediate sales. If YouTube isn’t effective in driving much traffic, we can encourage linking to relevant pages on the site from each video.
Overall, when reviewing YouTube data, look for the metrics that inform the quality of users coming in, as well as their potential to turn into paying customers. Compare multiple analytics reports to share the best information. For brands that use video well, a YouTube channel can help to drive not only sessions but conversions that ultimately contribute to long term value.

