But that was then.

Today, we have far more control over our analytics, both in terms of what we’re able to track, but also in how we can use that information to make smarter business decisions. We’re no longer tracking visits. We’re tracking something far more important – we’re tracking our actual users.
As a business owner, agency professional or in-house marketers, you can start getting better insights about your users by making use of the powerful features built into Google Analytics.
Below is a broad overview of the options for tracking users now available in Google Analytics. Discuss these features with your web analytics folks, or learn to use them yourself, and improve your digital marketing by tracking users instead of just visits.
Leverage Audience Reporting
The Audience reports located within Google Analytics help you understand who your audience is, how they reach and consume your content and what their loyalty and engagement is with that content. It’s easy for business owners and marketers to sometimes write off demographic information, thinking they already know who their target audience is or how their ideal customer acts. But just because you have an idea doesn’t mean you are correct. And if you are correct, it doesn’t mean your site is attracting the people you think it is.
Use these reports to find out.
The Audience reports within Google Analytics provide a detailed breakdown of:
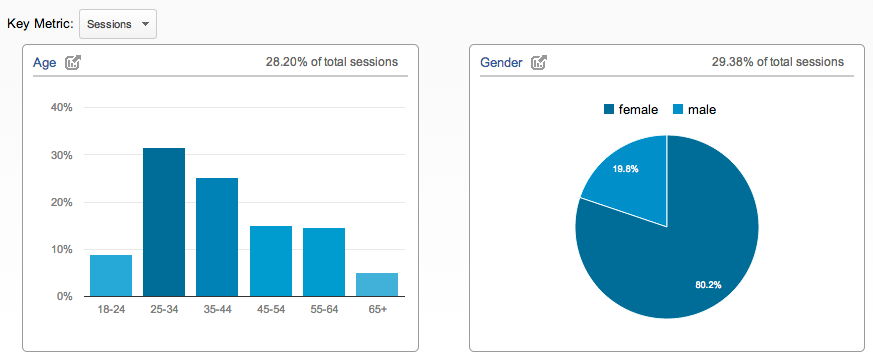
- Age: This report provides a breakdown of users by age, allowing you to target content – from the words on your page or the graphics on your site – to the right audience.
- Gender: This report provides a breakdown of user by gender, allowing you to understand how your site is skewing.
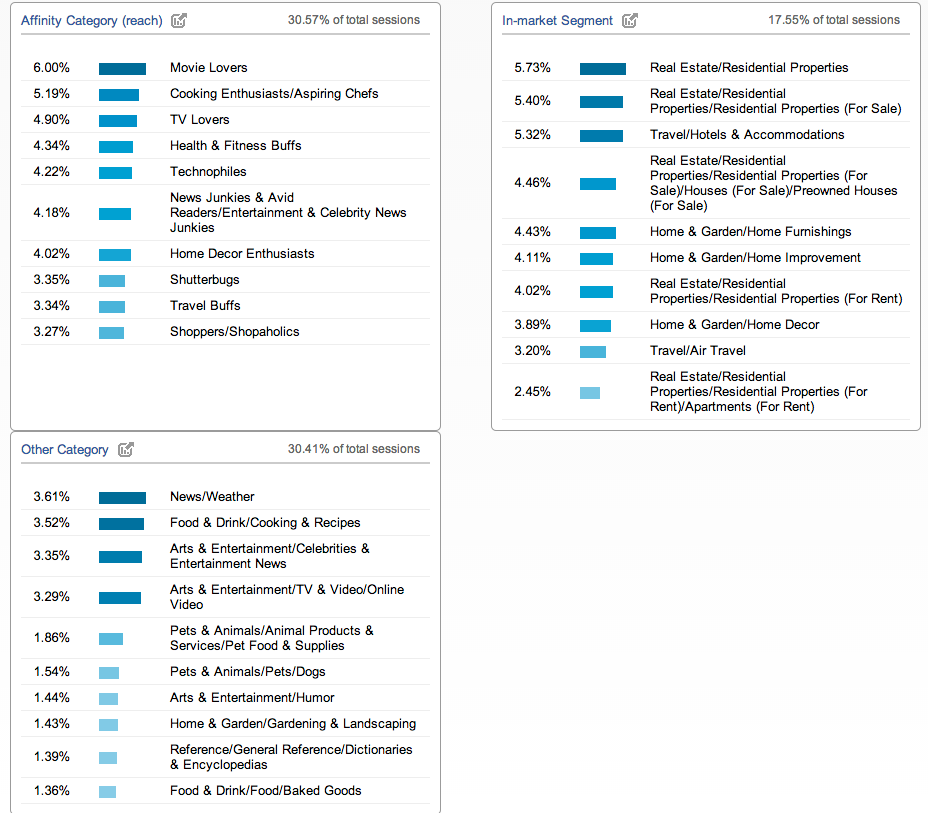
- Affinity Categories: This report works to categorize visitors based on their lifestyles (technophiles, music lovers, gamers, etc.).
- Other Categories: This report categorizes visitors based on the specific content they consume, along with how recently and frequently they consume that content to help you understand what they’re most interested in.
In the screenshot below, you can see how this data can paint a better picture of who your audience is. If we know that our site’s audience is made up of predominately females between the ages of 25-44 who identify as movie lovers, we can better target the content we’re creating. Perhaps we’ll be more likely to make certain cultural references or accept advertisements relevant to this life stage.
As a business owner or marketer, everything you do – from new partnerships to new content pieces – is dependent on your ability to understand who your audience members are, what gets them going and how you can establish your site as the answer to their problem. If you’re not already paying close attention to these reports, you should be.
FYI, in order to enable the demographics and affinity categories features of the reporting, the Google Analytics tracking code on your website needs to be updated. You can access the instructions here.
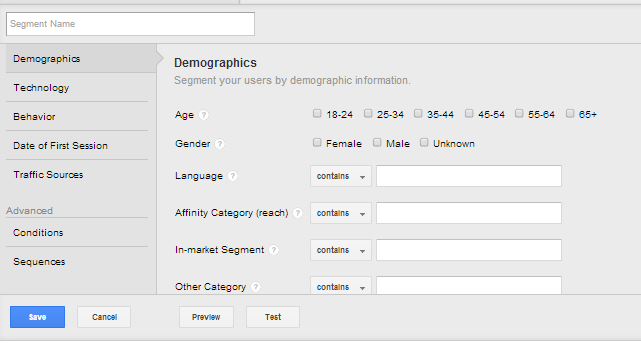
Google Analytics takes these reports one-step further by allowing you to use them for advanced customer segmentation. For example, if you know that most of your website’s purchases come from females aged 25-34, you can build a segment specifically for that category to see what sources those visitors are using to find your site and what pages they look at before buying.
For example, by combining this information with other customer profiles created you can identify how [technophiles who access your site via mobile] behave or which content that [movie lovers who access your site via mobile] regularly access.
Google Analytics makes it very simple to create these advanced customer segments. Start by clicking on the “+ Add Segment” button in any report. The Segment selector opens up, and you can click “+ Create New Segment” to begin building out the user profile you want to track.
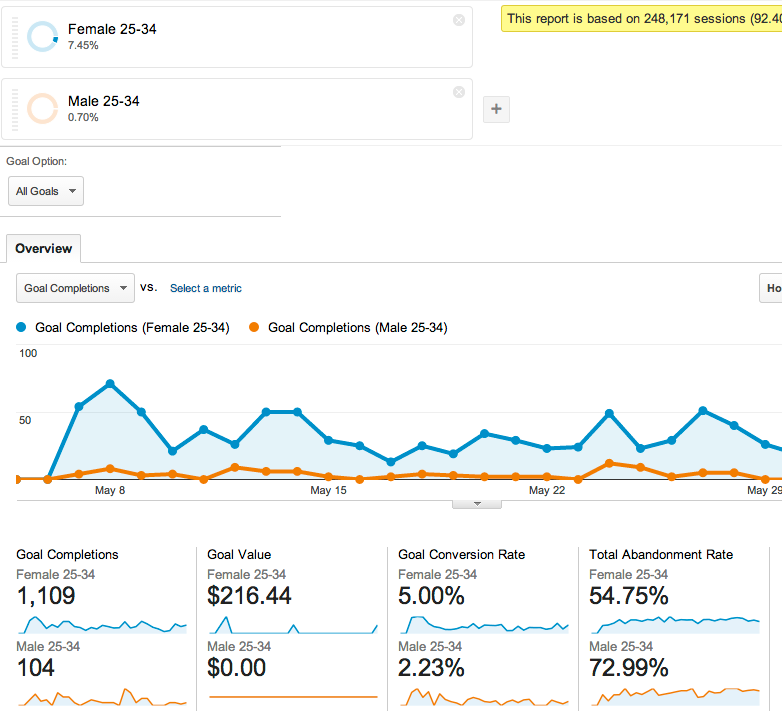
This is incredibly helpful information when trying to understand who your audience is and if you are attracting the people you intend! In this particular example, you can see that the Female 25-34 category is much more valuable than Male 25-34 when comparing conversion data.
Track Specific User Behavior
Before we had the ability to track users, we were left to track individualized interactions (hits) and the collection of those individualized interactions (sessions). What we were missing was the context of who those people were or what they were after. By tracking how specific user-types navigate our site and understanding what they do when they’re there, we can better market toward the right audience to get more of those people to our site. For example, if you determine that people who were referred from Facebook tend to drop off after putting an item in their cart, you can then target Facebook ads offering discounts for the items those people are likely to purchase.
Creating customer segments based on the Audience data is one way to track user behavior on your site. But it’s not the only way. Customer segments can also be defined based on Technology, Behavior, Date of First Session, and Traffic Sources.
- Technology includes devices (mobile, desktop, tablet), operating systems, and browsers. This section can help to examine usability and compare value of users across devices and platforms.
- Behavior includes frequency and duration of sessions, time since last session, and transactions. This section can help compare the browsing habits of potentially more valuable users who return to your site and make purchases vs. those who just visit once and leave.
- Date of First Session allows you to create user segments based on how long ago they first touched your site. This section can be useful for measuring the impact of a special offer in getting previous users to return, or seeing if people who previously visited your site before a redesign are showing better engagement.
Google has recently made significant changes to its segmentation UI to help marketers define different user sets and measure how they interact with your website. Previously, you could just create segments based on sessions, but now you can create segments by actual users. By comparing how a “preferred” user (someone who falls in our top customer segments) performs vs a non-preferred user, we can start to make smarter decisions about how we target them, the content we create and whether or not our site is working properly for their needs.
In the screenshot below you can see we have created three different advanced segments – comparing visitors based on how they were referred to the site whether via email, social media or organic search. Based on these segments, we can identify that people referred from organic spend far more time on the site and interact with more pages than those who landed via email or social, who may only be accessing a single blog post or looking at a specific product.
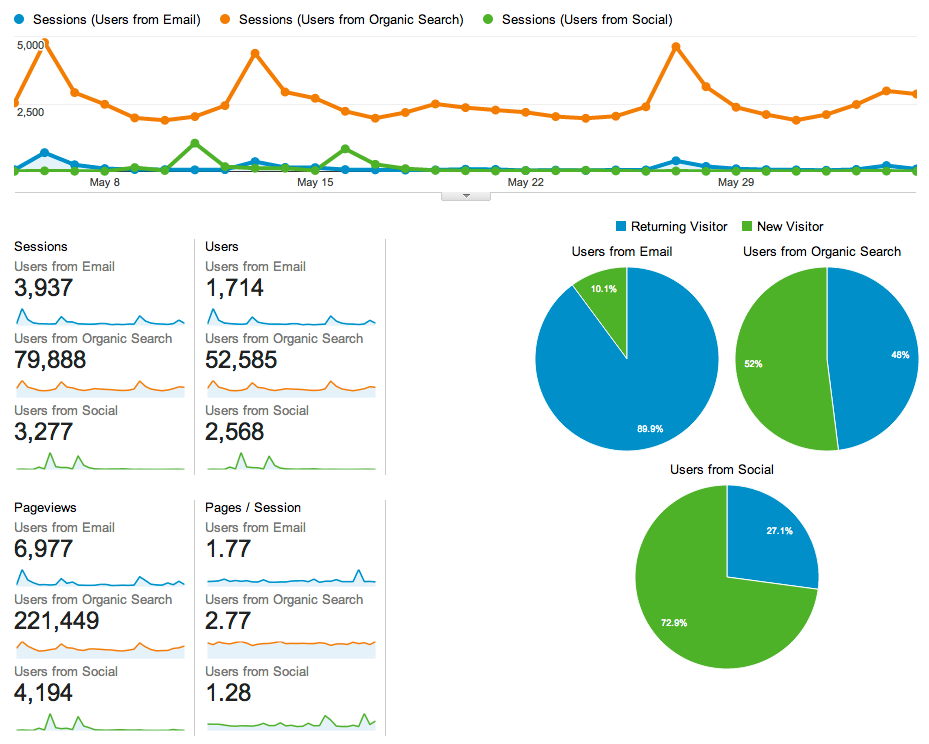
The advanced segmentation builder allows you to discover individualized users to make smarter decisions. If you’re working in an agency setting, you may not want to track all sessions, all the time. Instead, you may want to focus on how users from a particular campaign interact with your site over time, what pages they’re returning to and what they’re doing during different interactions.
Another valuable report for tracking user behavior is the User Flow Report, which allows you to track individual paths through the site to learn how users in a given segment interact with your content. For example, we can see how a user entering the site via a social network flows through the site, where they start, where they go next and where they may drop off.
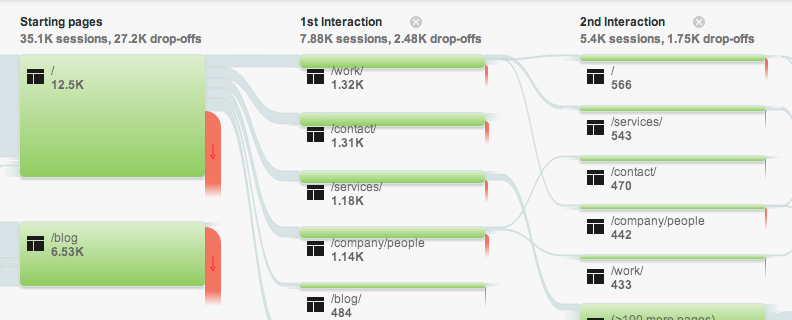
In this example, you see that if people don’t immediately go to “contact” after arriving on the homepage, they are looking next at “work” (a portfolio page of previous projects) or “services.” From this information, you can see a need to focus on those sections of the site to then drive people to contact.
Identify & Understand Super Users
All of this information allows for marketers to hone in on their “super users,” the small percentage of users on your site who are most profitable and the people you want to reach most.
Through Google Analytics segmentation, we can find our cohorts, or groups who act as one, and analyze patterns of behavior to understand how they act, what they do and what they want. This allows us to see how the site is working for our preferred customer set and make changes to improve their experience, thereby attracting more of the people we want.
- Previous buyers: people who have made purchases on an ecommerce site
- Return buyers: people who have made multiple purchases within an established timeframe
- Engaged readers: people who spend significant time reading blog articles and browse through multiple posts
- Regular returning visitors: people who come back to the site at least once a week
For more detailed information on segmenting your VIP users, check out this article. Or, see our technical description of how we use cohort analysis for our own marketing.
Conclusion
The improved reporting and segmentation UI within Google Analytics has made it possible to better understand user behavior, to better educate ourselves about the faults and wins of our site and to focus not only on hits and sessions but on the people we’re marketing to. If you want to improve your site to make it more attractive to other humans, you have to build a site for the humans you’re trying to attract in the first place. Thanks to the evolution in analytics, now you can!

