
Megalytic's Organic Traffic Summary Report
Megalytic offers a stronger solution for showcasing your organic traffic results. It provides widgets to visually represent the important metrics. In addition, Megalytic gives you templates – pre-built reports – that you can populate with your data in just a couple clicks. If you need to create the same report for a number of different websites, you can save it as your own custom template, and easily populate it with data from each site, creating a dozen or more reports in minutes instead of days. You can even add comments and cover pages, to personalize each report and explain important data.
In this post, we show how to start with the Organic Traffic Template to create a summary report containing the charts, tables, and metrics relevant to organic traffic.
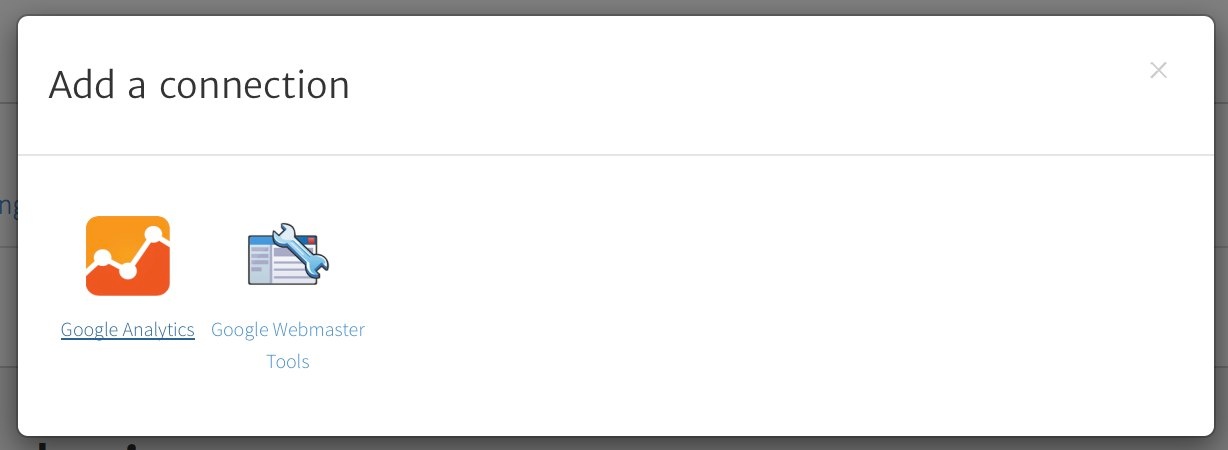
If you do not already have a Megalytic account, the first step is to sign up for a 14 day free trial. This video shows you how. The free trial gives you an opportunity to get familiar with the tool, without requiring a credit card or any other binding commitment. Next, connect your accounts to Megalytic - authorizing the tool to access your data to be displayed in its reports. You’ll need to go through this “Add a connection” process twice, once for your Google Analytics account and once for Google Webmaster Tools.
With your connections set, you are ready to create a report from the template named Organic Traffic Summary.
Megalytic will access the data from your Google Analytics and Webmaster Tools account and product a report containing six charts and tables
Contents of the Report
The first chart in your report shows the daily organic traffic to your website over the last six months, together with the 30 day rolling average.
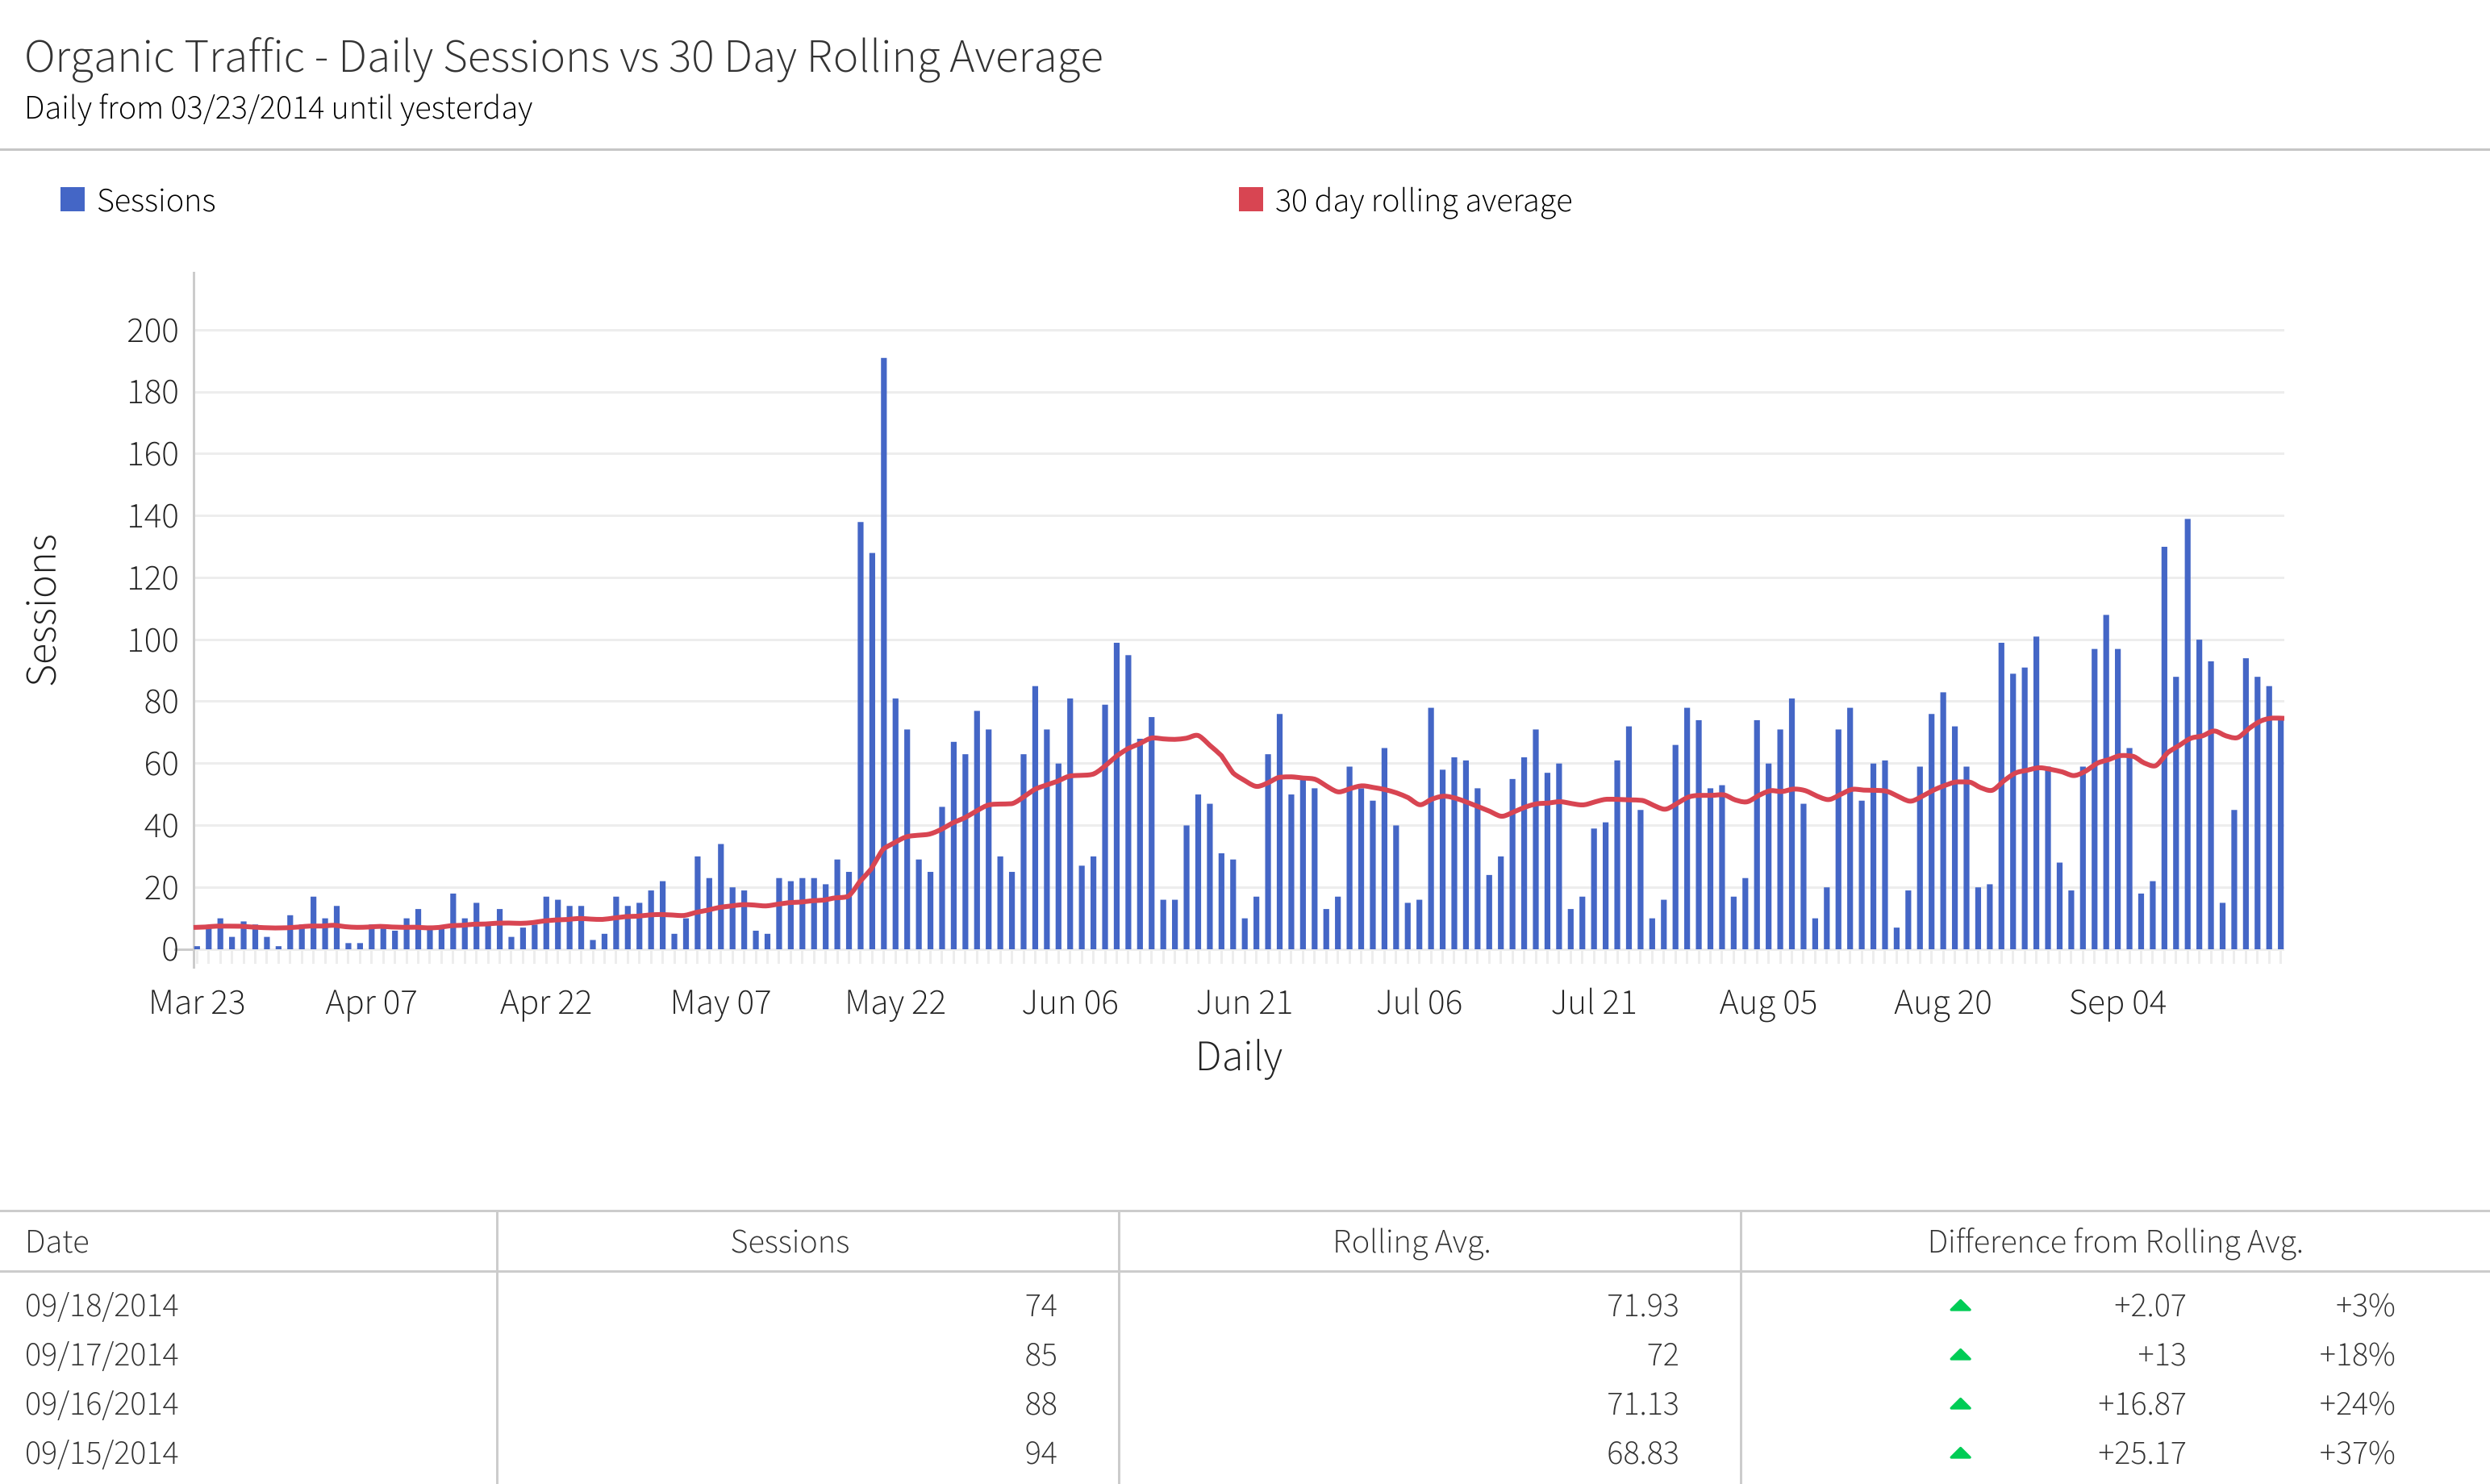
This chart provides the reader with a quick view of organic traffic over the last six months. Daily spikes in traffic are clearly visible. The red line – called the rolling average – shows the average daily traffic over the last 30 days. Superimposing this average on the daily chart smooths out the spikes and weekly fluctuations, providing a true sense of the trend.
The next chart in the report shows the monthly change in organic traffic together with the bounce rate.
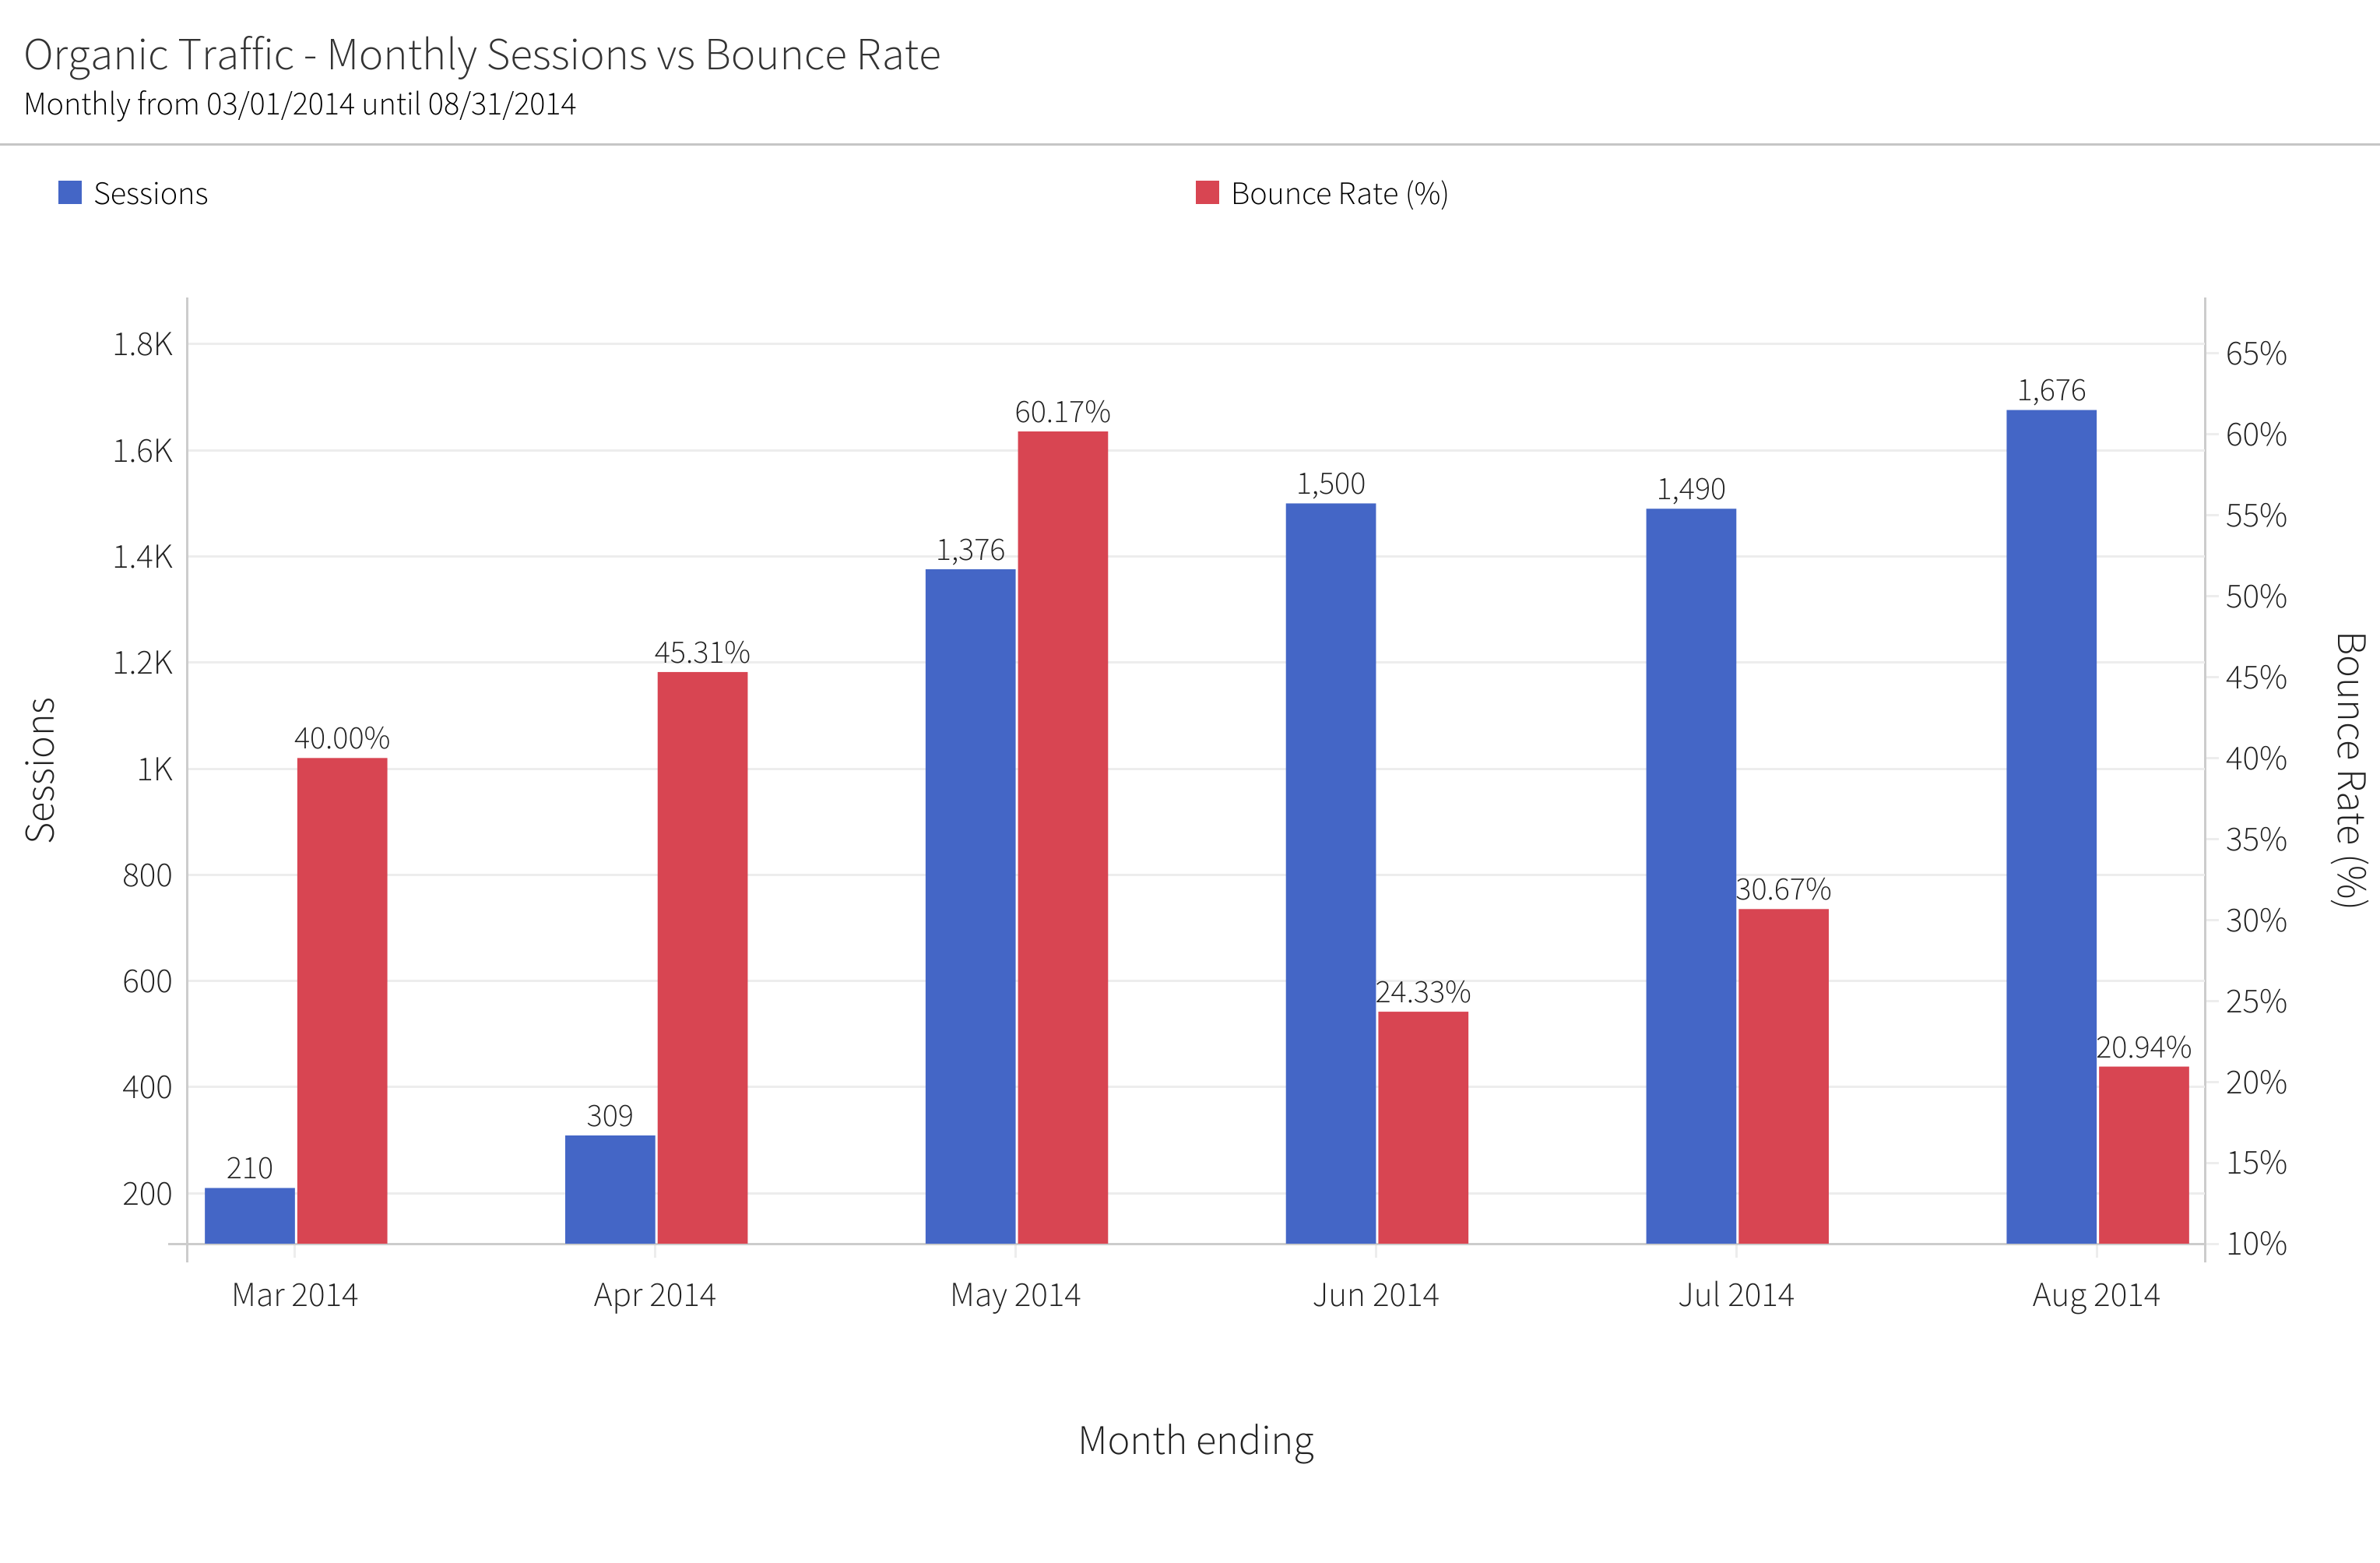
This chart shows the growth in organic traffic together with any changes in its quality. Ideally, you like to see the organic traffic (blue bars) increasing, and the bounce rate (red bars) holding steady or decreasing.
It is important to look at traffic growth and bounce rate together, because many strategies for growing organic traffic end up decreasing the quality of the visitors. For example, if you work hard to rank for keywords that are not backed up by good content, you may see your organic traffic go up, but you will also see the bounce rate spike up along with it. The best organic search strategies are backed up with great content that engages visitors, and will show increasing traffic and a steady or decreasing bounce rate.
Here, we show the data monthly, rather than daily, because bounce rate fluctuates a great deal and is more meaningful when viewed over a longer time period.
Next, we compare organic traffic with two other important sources of visits – social and referral.
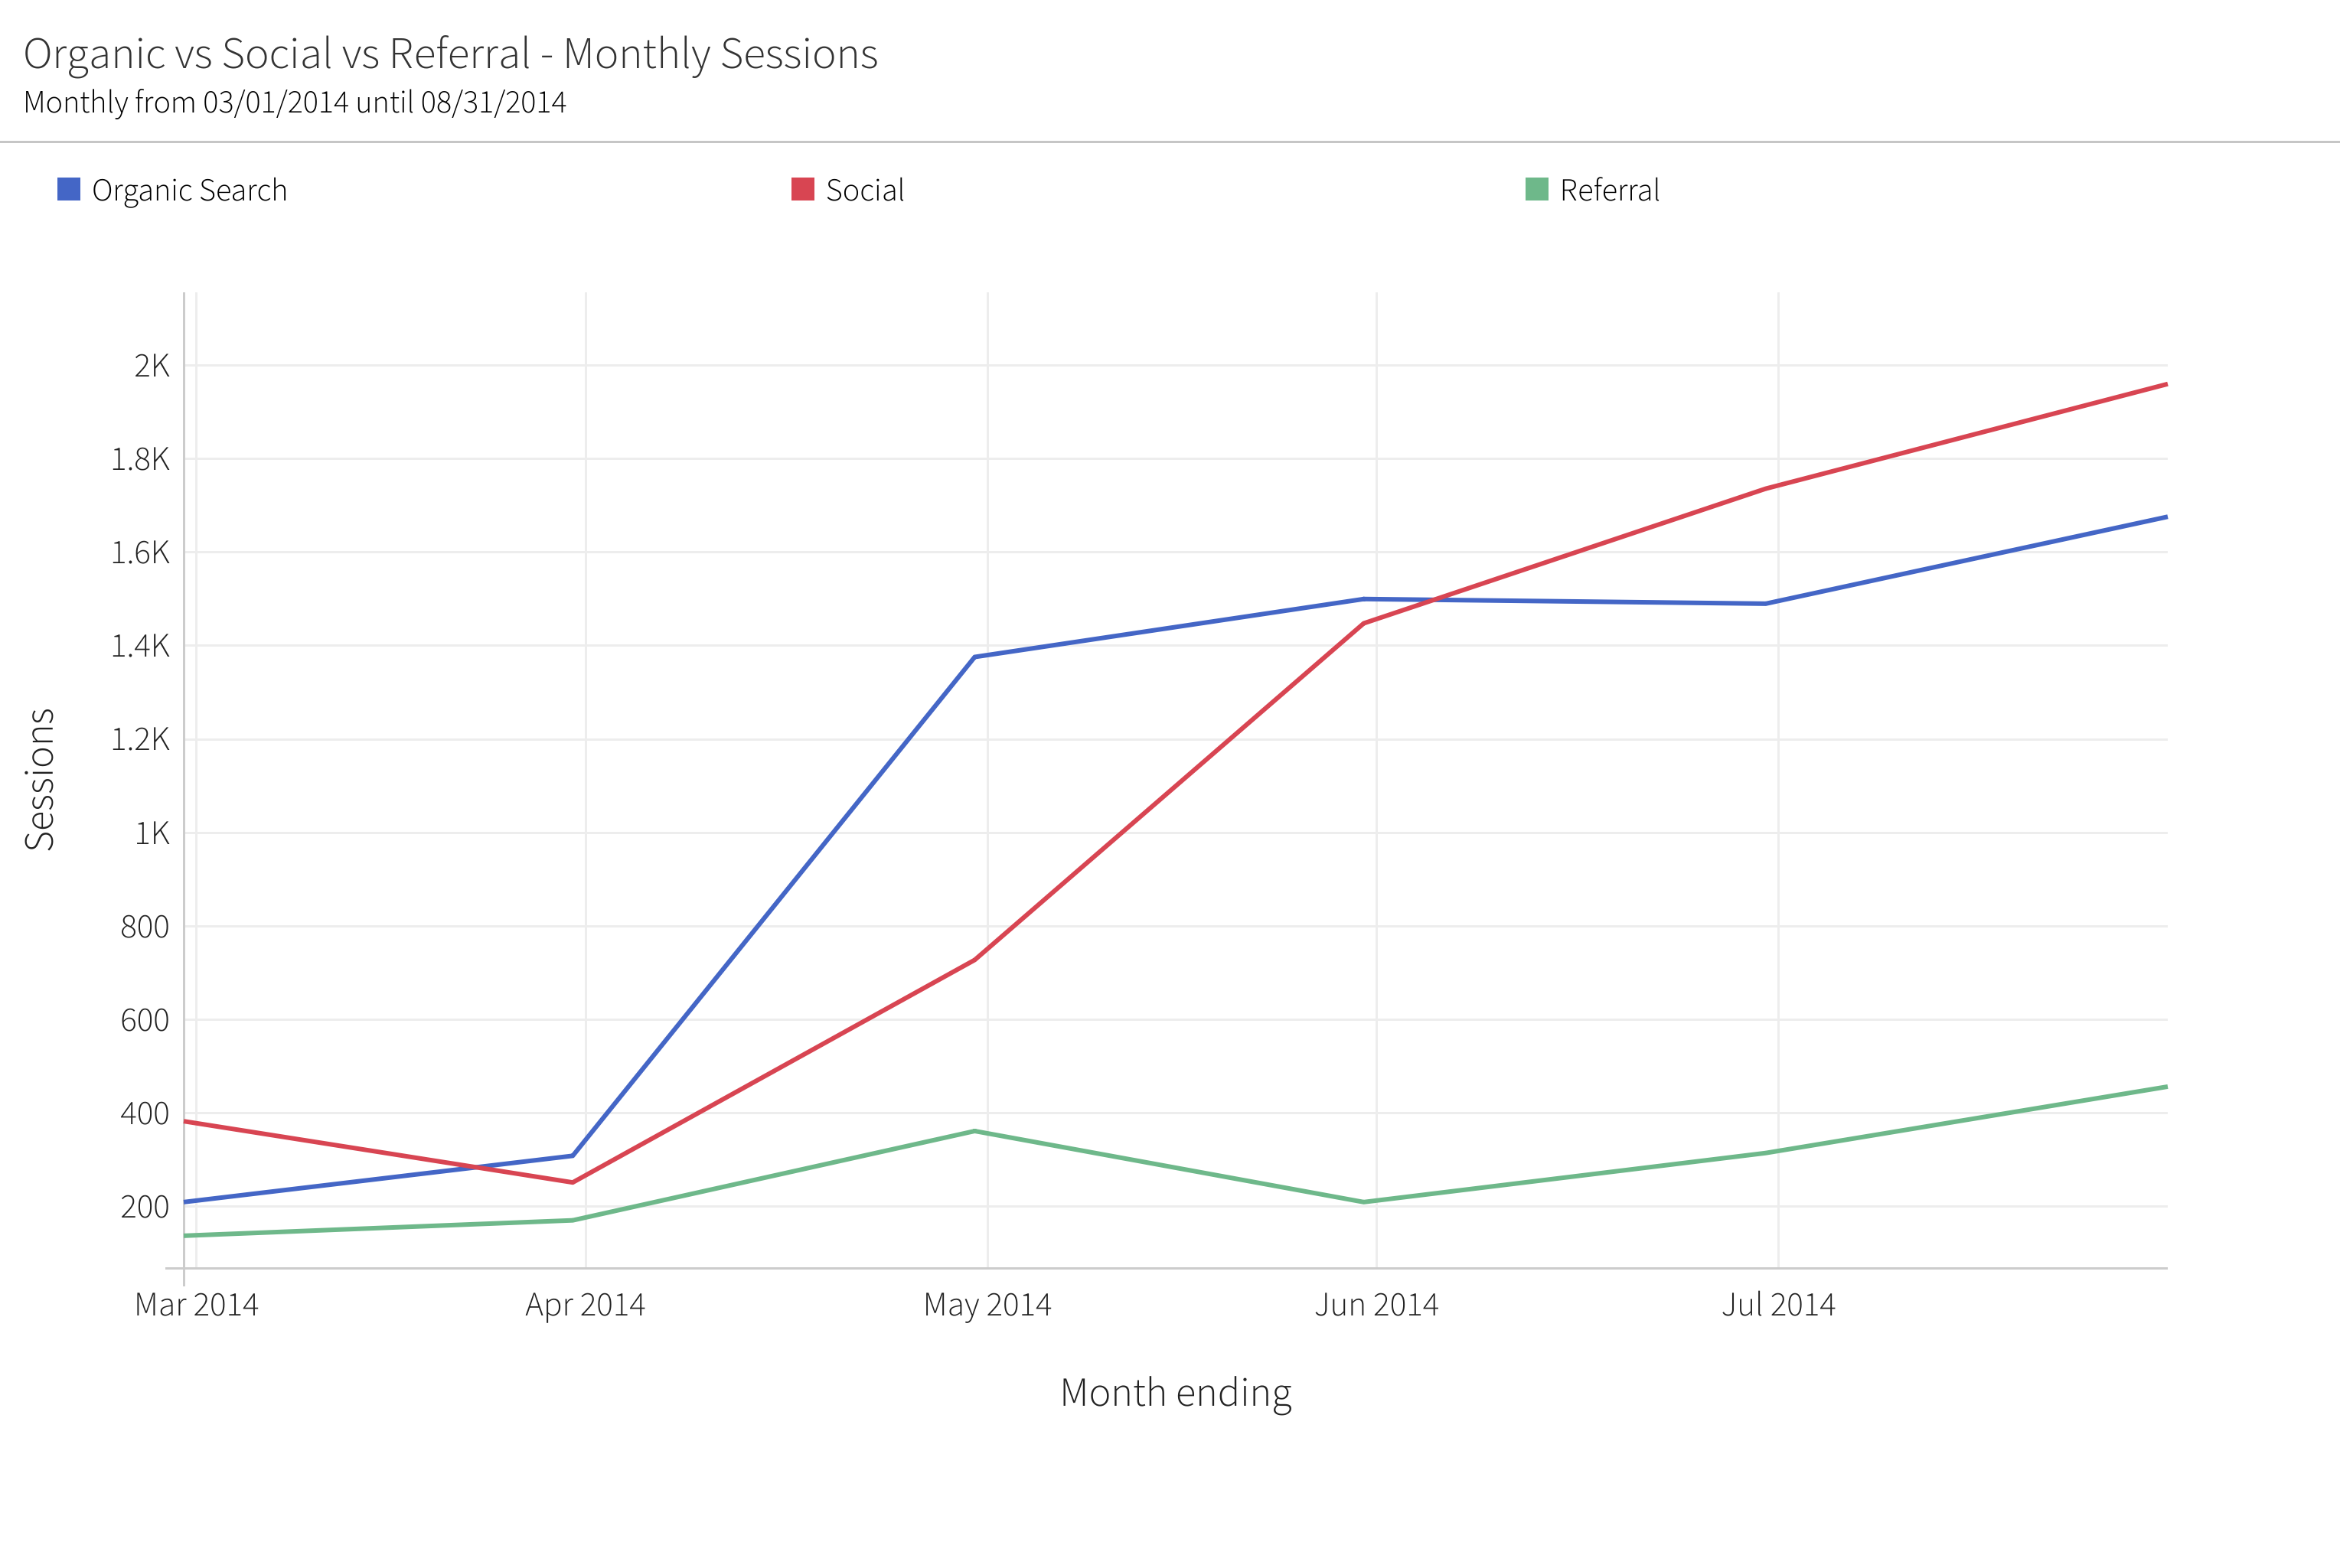
Organic traffic should be growing along with social and referral. If either of the other traffic sources are growing much faster than organic, it may indicate a problem. Why? Because if there is interest in your site on social media, for example, that interest should spill over into people searching for your content. If that is not happening, it may mean that your brand is not well identified with the content on social media that is generating website traffic. It could also mean that your content is getting penalized in the search rankings and you need to check your SEO tactics.
Next in the report, you will find a table labeled “Quality of Organic Traffic – Last 6 Months.” This provides an overview of how well organic visitors engaged with your site content, and how this has changed over the last six months.
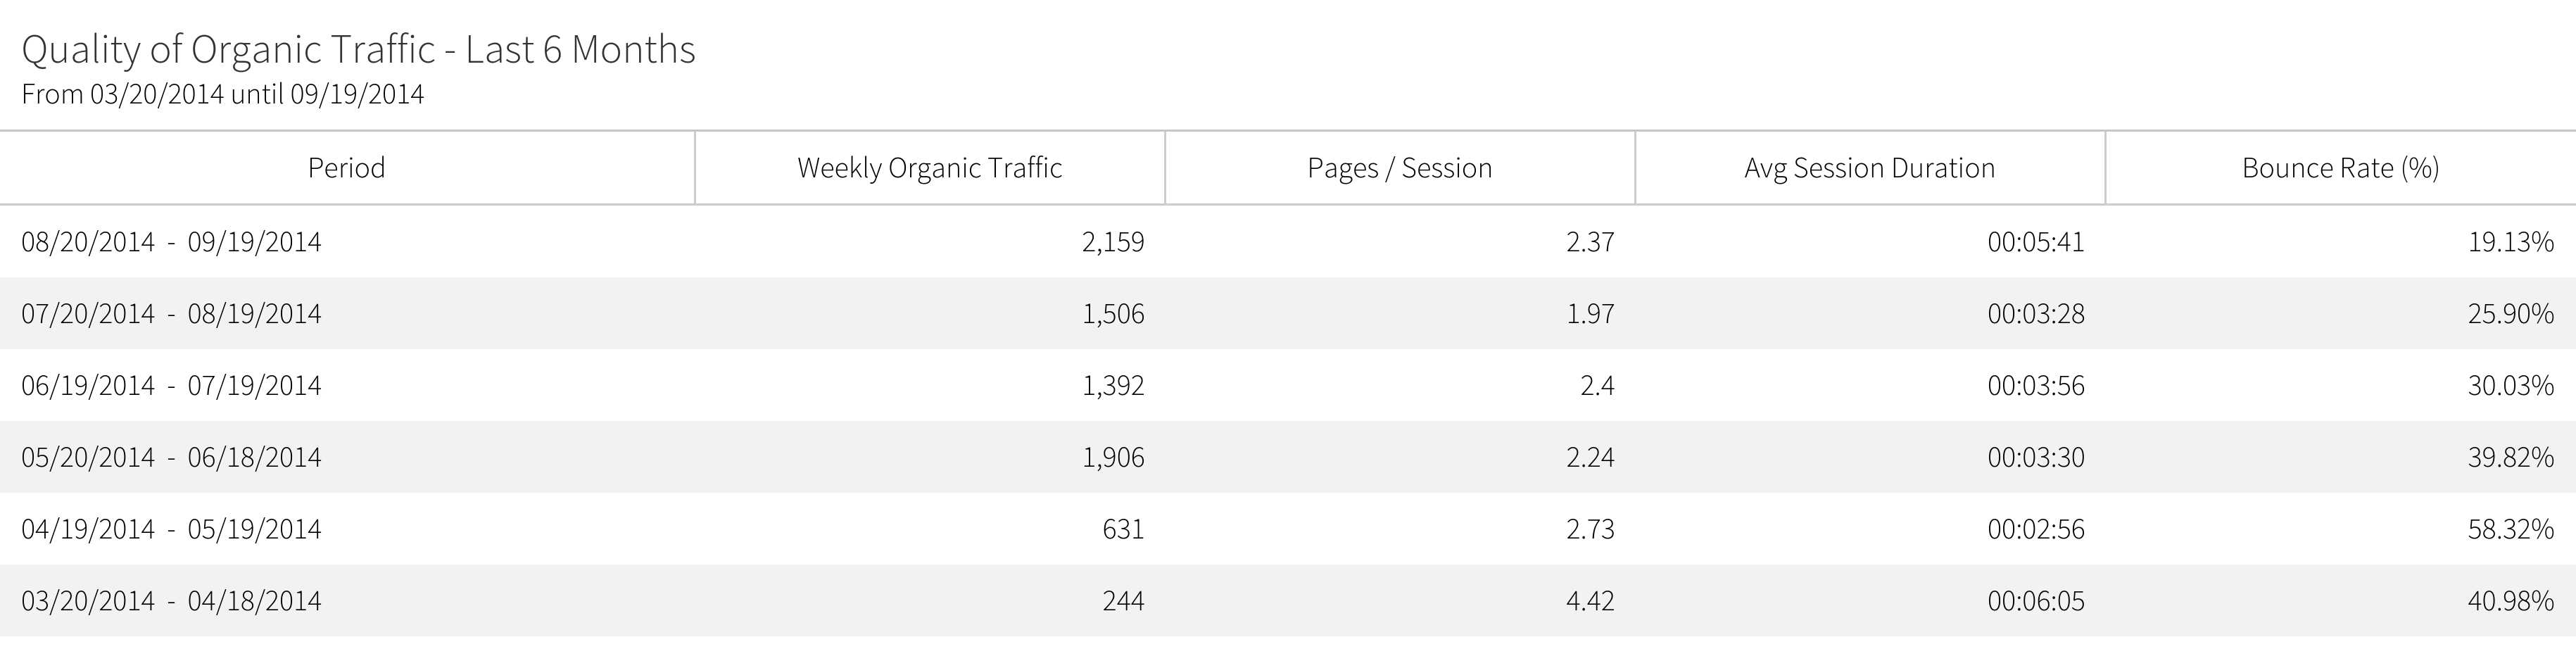
Here you’ll see the following data broken out:
Sessions – The number of visits from organic traffic during the month.
Pages / Session – The average number of pages on your website viewed by an organic visitor. A high value indicates visitors are interested in what they see when they arrive at your site and continue looking at additional pages.
Avg Session Duration - The average amount of time an organic traffic visitor spent on your website during the month. Higher numbers indicate visitors are spending time with your content and are not simply taking a quick look and leaving.Bounce Rate - This is the percentage of organic visits that bounced during the month. A bounce is when a visitor arrives at your site, views only one page, and leaves. A low bounce rate indicates your organic visitors are finding your content relevant to their search.
Taken together, the Pages / Session, Avg Session Duration, and Bounce Rate are referred to as engagement metrics. These provide an indication of whether or not your content is relevant to the organic searches bringing visitors to your site.
If organic searches leading to your site are connecting visitors with the content they are looking for, then your engagement metrics will be high. If your spending SEO efforts researching keywords, optimizing landing pages and writing interesting and relevant content, and you’re succeeding, you should see these metrics trending up.
Unlike in Google Analytics, where you can only compare across two periods, this table (build from the Megalytic widget called “Metric Table by Period”) allows you to compare a group of metrics across as many periods as you like.
The next chart in the report is the Top 10 Organic Traffic Landing Pages. This table shows where most of your organic search traffic is landing.
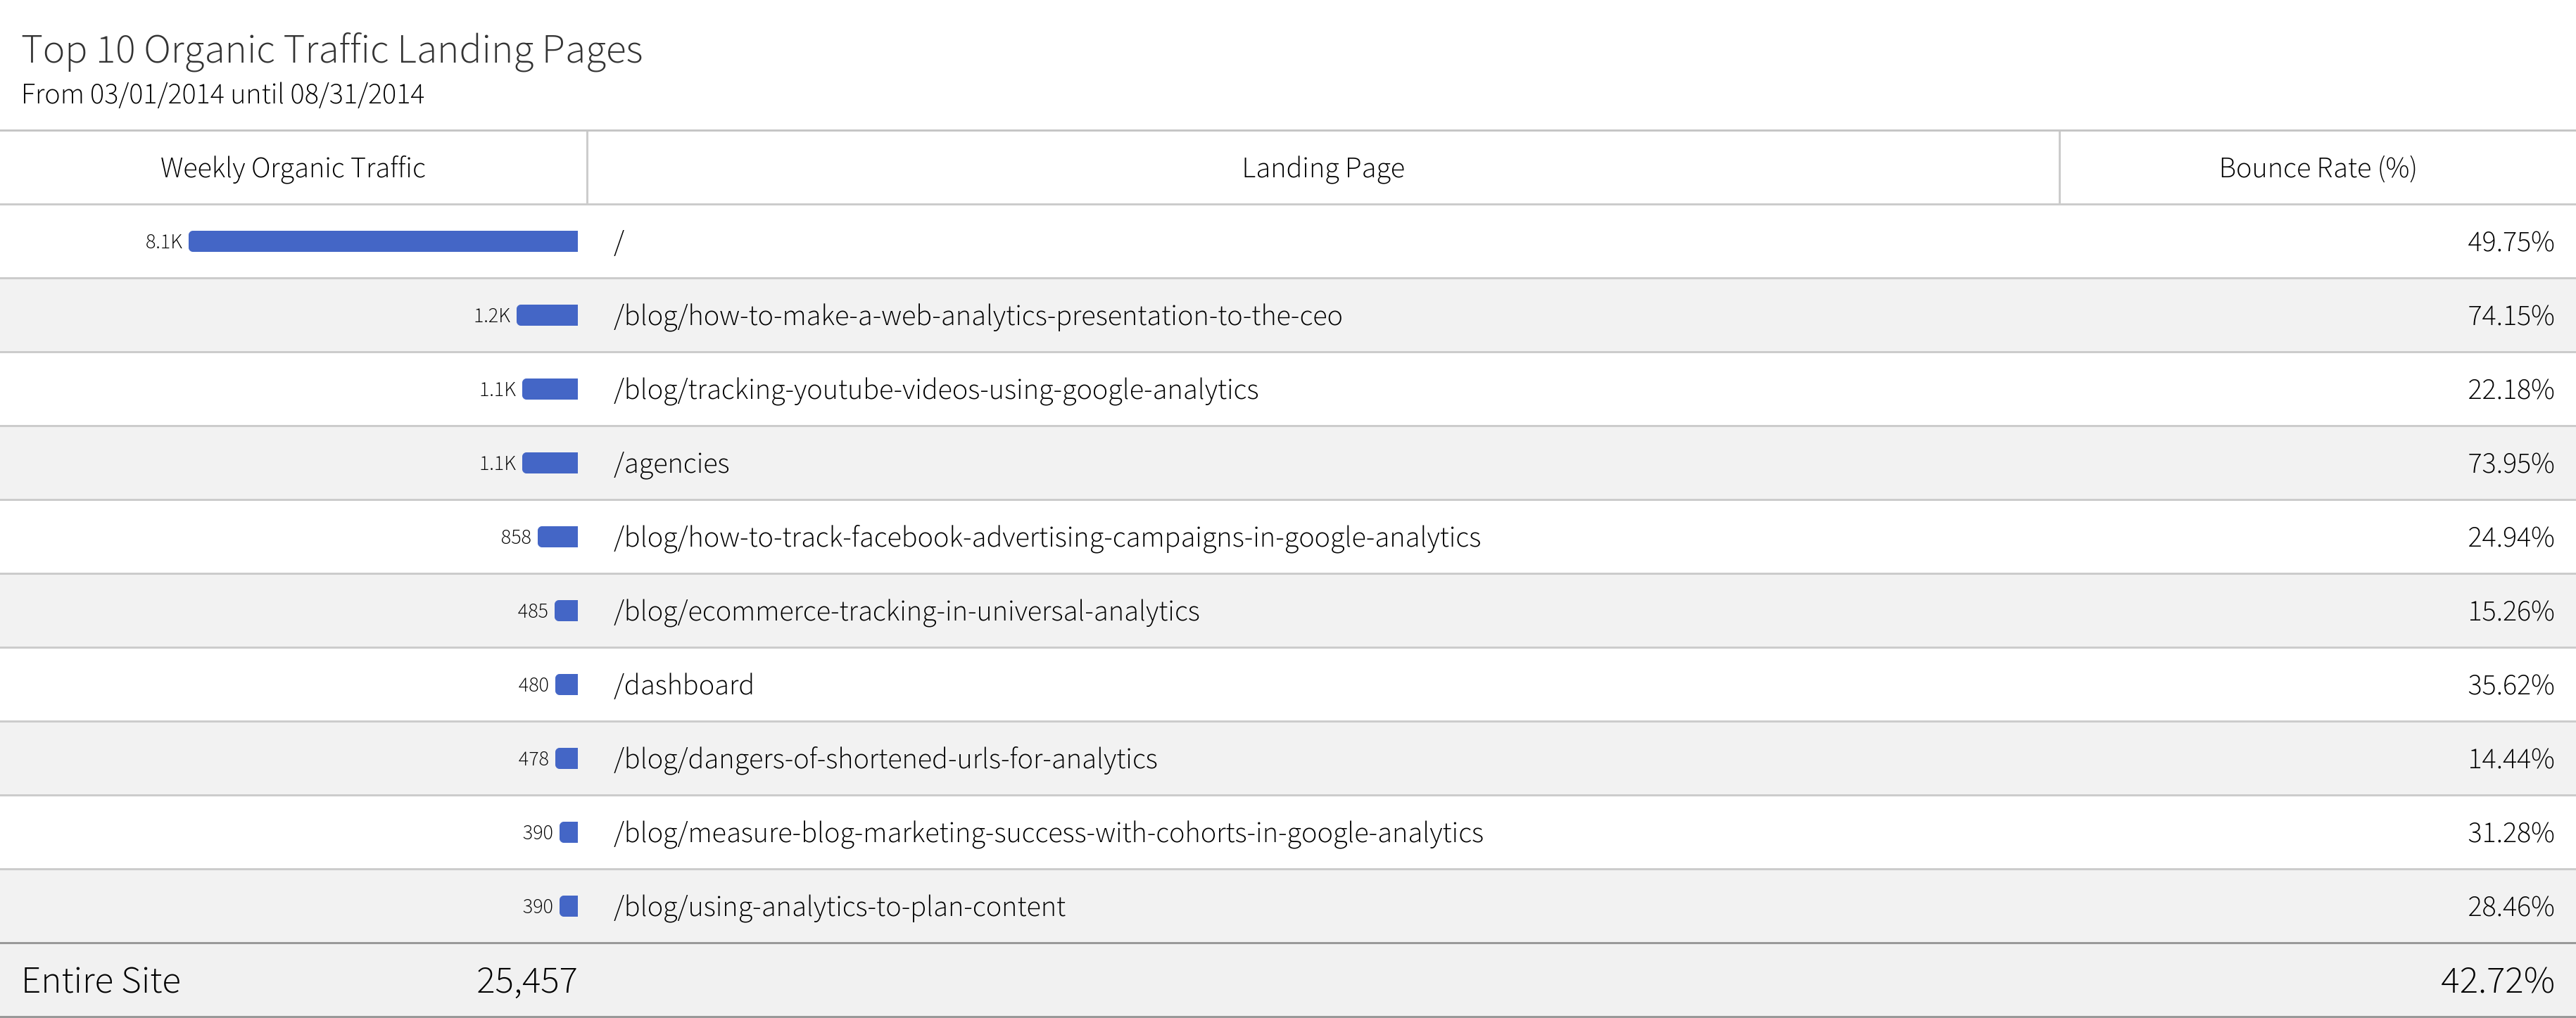
The column on the left shows the volume of traffic landing on the page, and the right hand column shows the bounce rate for the landing page. It is helpful to view these two metrics together to see how engaging your visitors are finding the content where they most frequently land. Consider further content optimization on high-ranking pages that have a high bounce rate. Here, I can see the blog post “How to Make a Web Analytics Presentation to the CEO” gets a lot of organic traffic, but has a relatively high bounce rate compared with other blog posts. My guess is that’s because the article is very long, and people leave the site before finishing it. I might break it up into a series of short articles and provide links to other site content within that article to point readers to other Megalytic content they might find interesting.
These first 4 charts and tables have been created from data in Google Analytics. They provide an overview of organic traffic visitors reaching your website and how they are engaging with your content.
The last two tables are generated from data provided by Google Webmaster Tools. These provide insight into how Google views your site and the type of traffic that Google searches are generating.
The Top 20 Search Queries (Keywords) table shows you the Google search queries that sent the most visitors to your site over the last 90 days. The table is sorted by Clicks, so you can see the keywords sending the most traffic at the top.
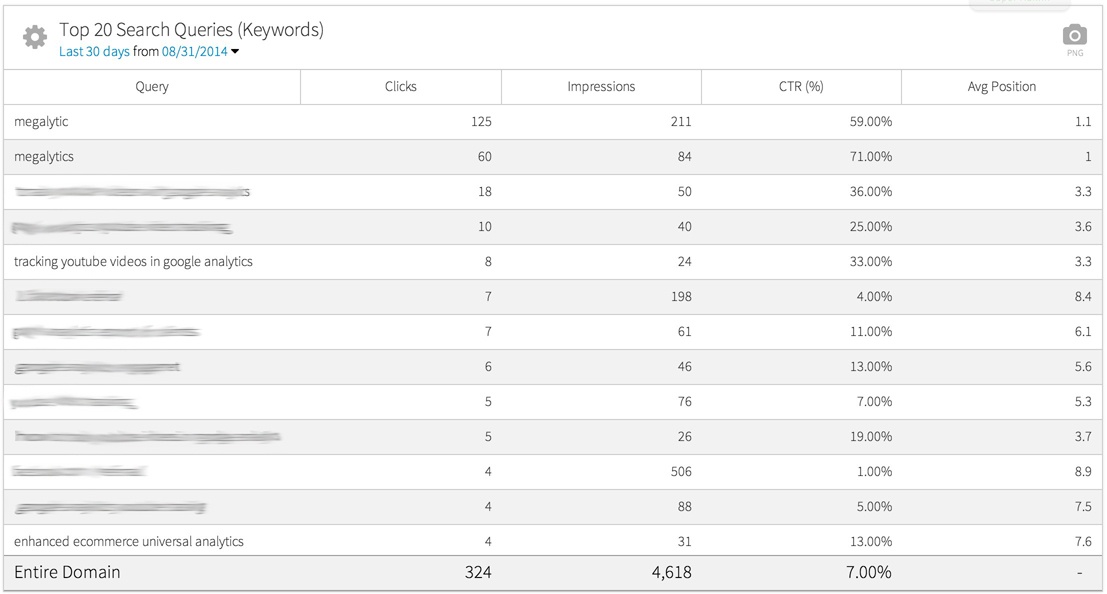
Clicks – The number of times that one of your pages was clicked on the Google Search Engine Results Page (SERP) for each query (keyword).
Impressions – The number of times that one of your pages was clicked on the Google SERP for each query (keyword).
CTR - The percentage of clicks received out of all the impressions your pages received for each query (keyword).
Avg Position - Also referred to as the Rank, this metric indicates the average position for your site on the Google SERP for each query (keyword).
The last table in the report shows the keywords Google’s crawler is finding on your website.
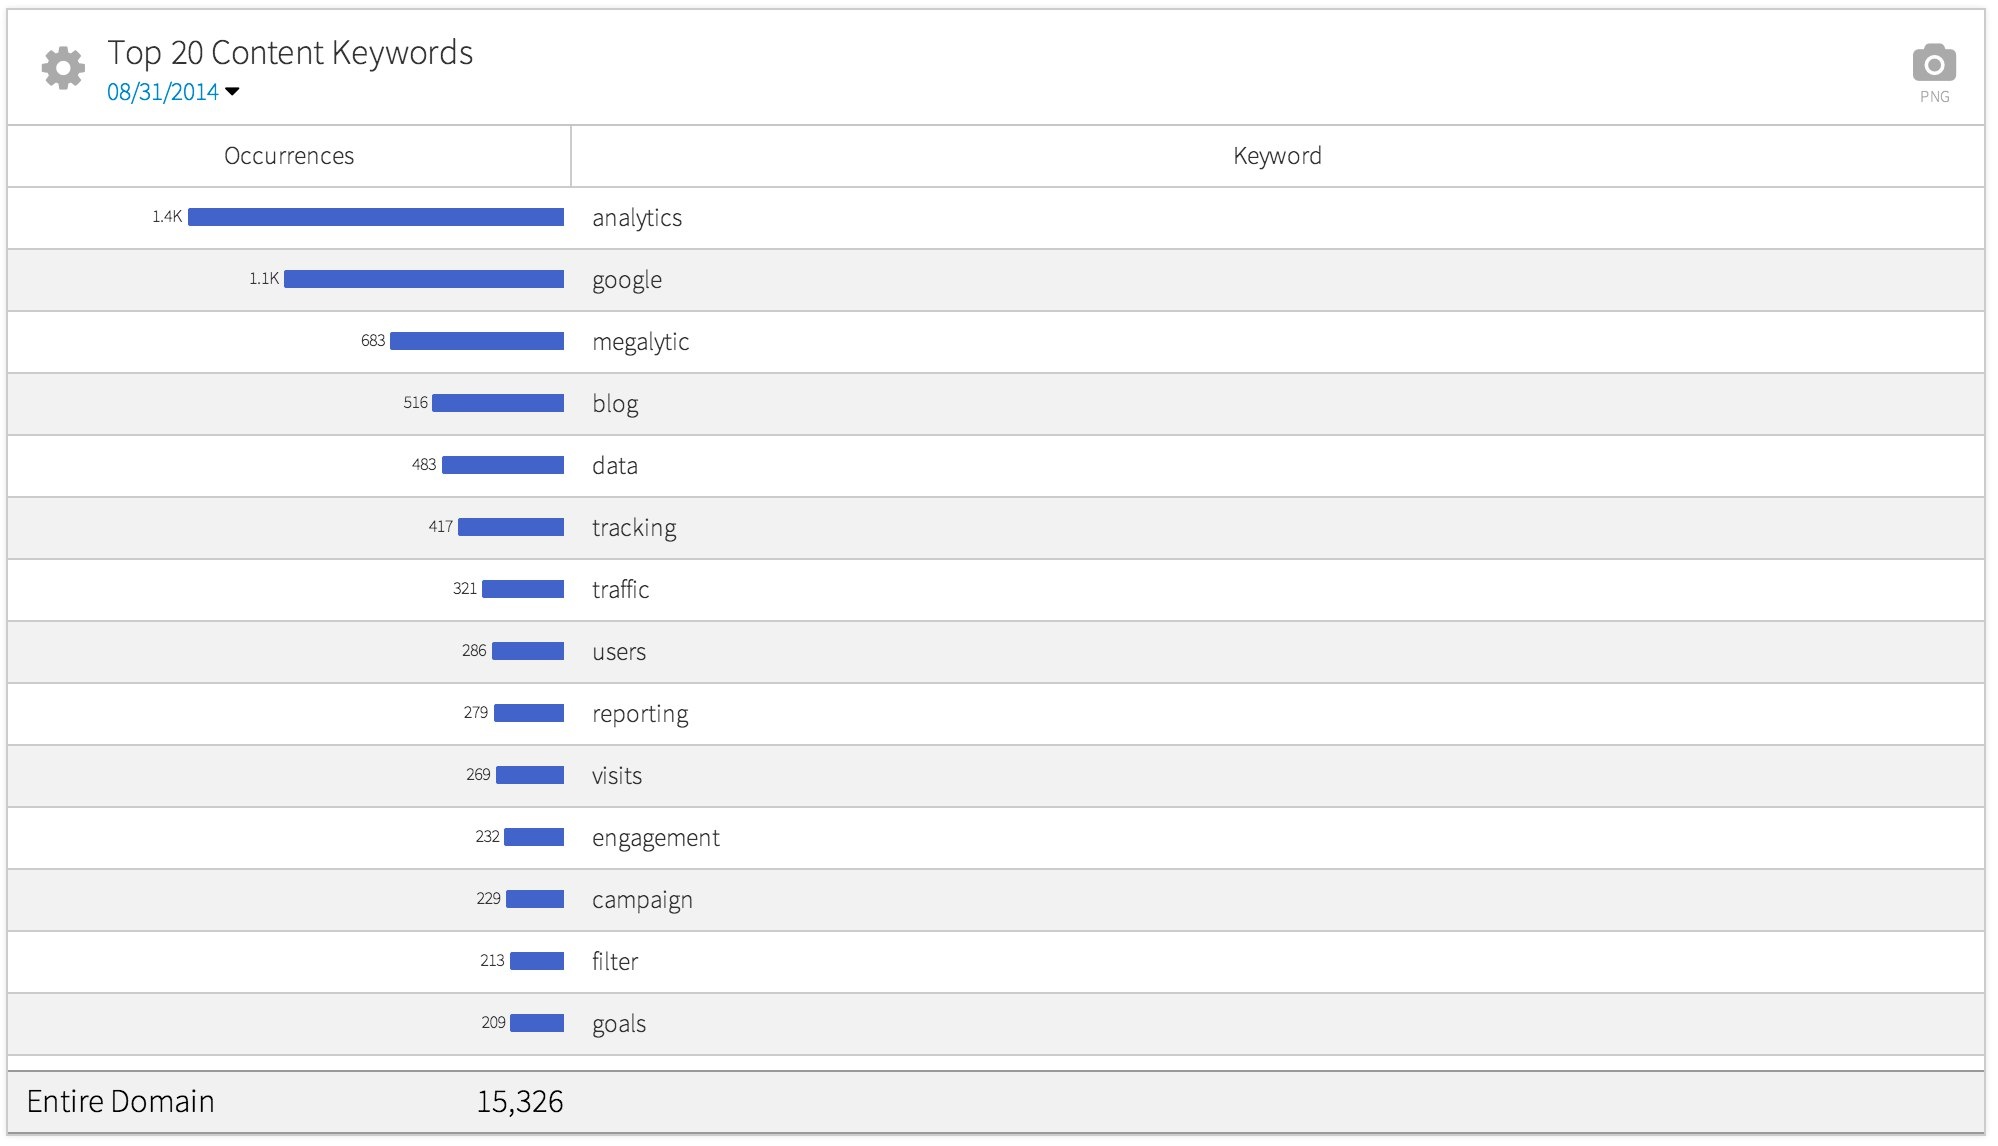
This table shows you what keywords are jumping out at Google when they crawl your site. Ideally, you should see keywords here that are relevant to the type of traffic you want to attract to your site. This example, which is from a crawl of the megalytic.com website, shows Google is associating us with “analytics” and “google.” Further down we see “reporting.” Since Megalytic is a reporting tool, this indicates we should probably work harder to create content that is relevant to reporting and generate more organic traffic from searchers looking for reporting tools.
Conclusion
The Organic Traffic Template provides a way for you to quickly and easily create a report summarizing the results of your SEO efforts. You can easily customize this report to suit your needs. Check out this video to quickly get up to speed on how Megalytic reports can be customized. And, consult the Megalytic support site for detailed instructions.

