Connecting Your Facebook Page to Megalytic
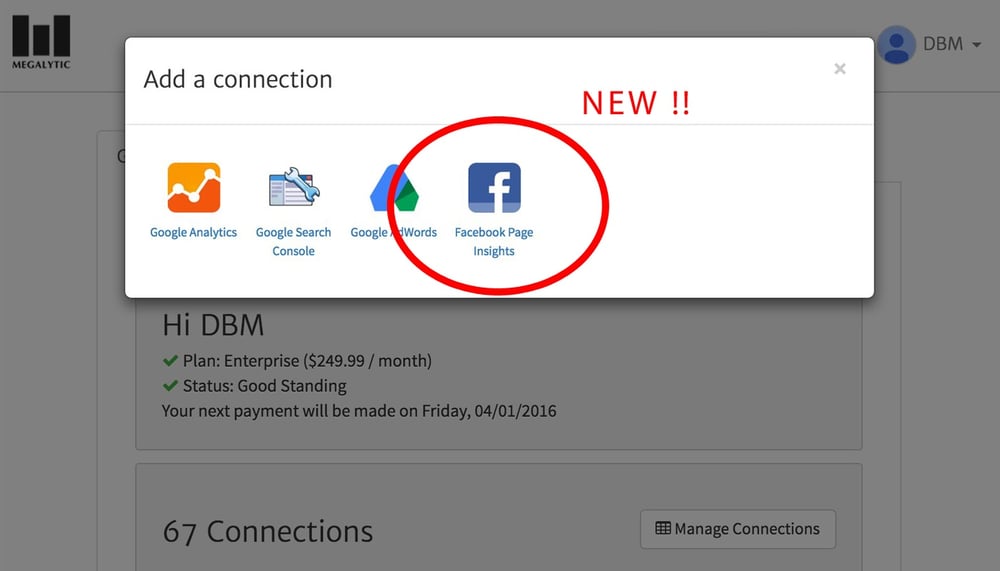
Ready to start reporting on your Facebook page performance? Excellent. You’ll just need to connect your Facebook page to Megalytic. Under the admin section of Megalytic, select “Add a New Connection.” Then, choose “Facebook Page Insights” from the options that appear.
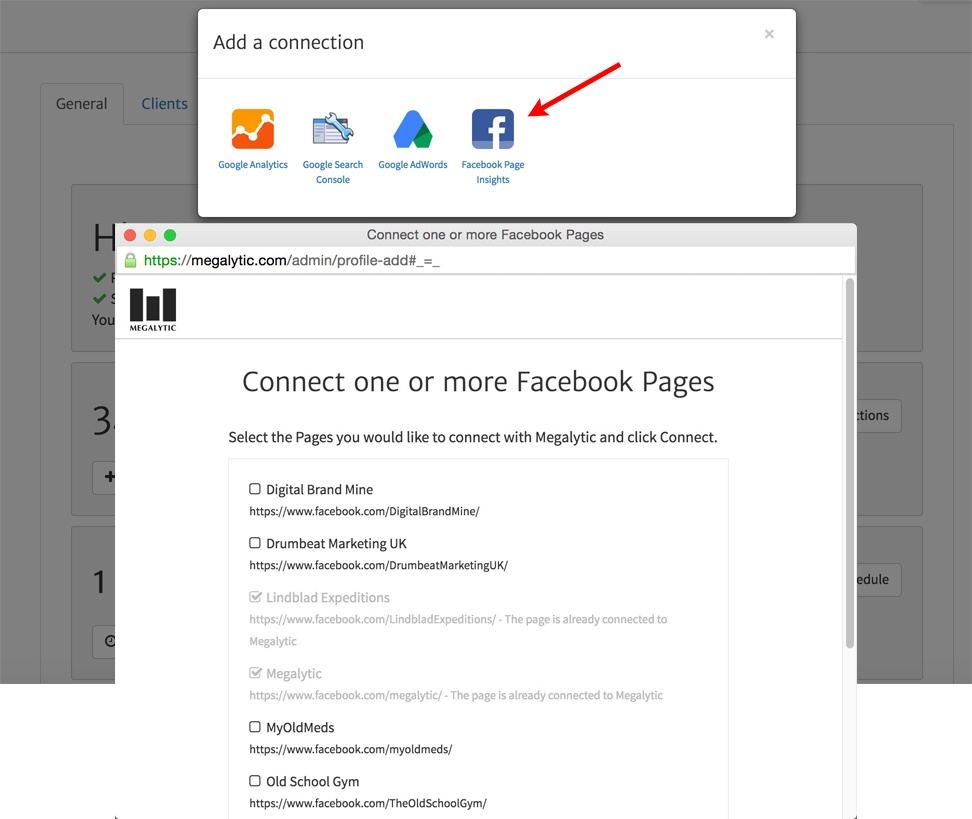
Next, you’ll see a prompt to log into your Facebook account. Once you’ve entered your user name and password, you can choose from a list of Facebook business pages that you manage. Check the box next to any accounts you’d like to integrate and click “Connect.” If you manage several pages on which you’d like to report, that’s no problem. You can conveniently add them all at once during the initial set up. Once finalized, you can insert data into your reports from any Facebook page you’ve connected.
Showing Facebook Data in Reports
Along with Facebook integration, we’ve added four new widgets: Page Likes, Posts Published, Page Impressions, and Page Reach. We’ve also added a handy new Facebook Page Summary template to use when creating a new report.
Upon using this template or adding a Facebook widget to a report, you’ll see a prompt to choose from a list of Facebook pages connected to your account. Once you select a page, you can configure the widget to show data in the format you’d like.
When creating a new Facebook Page Summary report, simply choose this option from the list of default templates. You’ll see several example uses of the new widgets, which you can customize further based on your preferences.
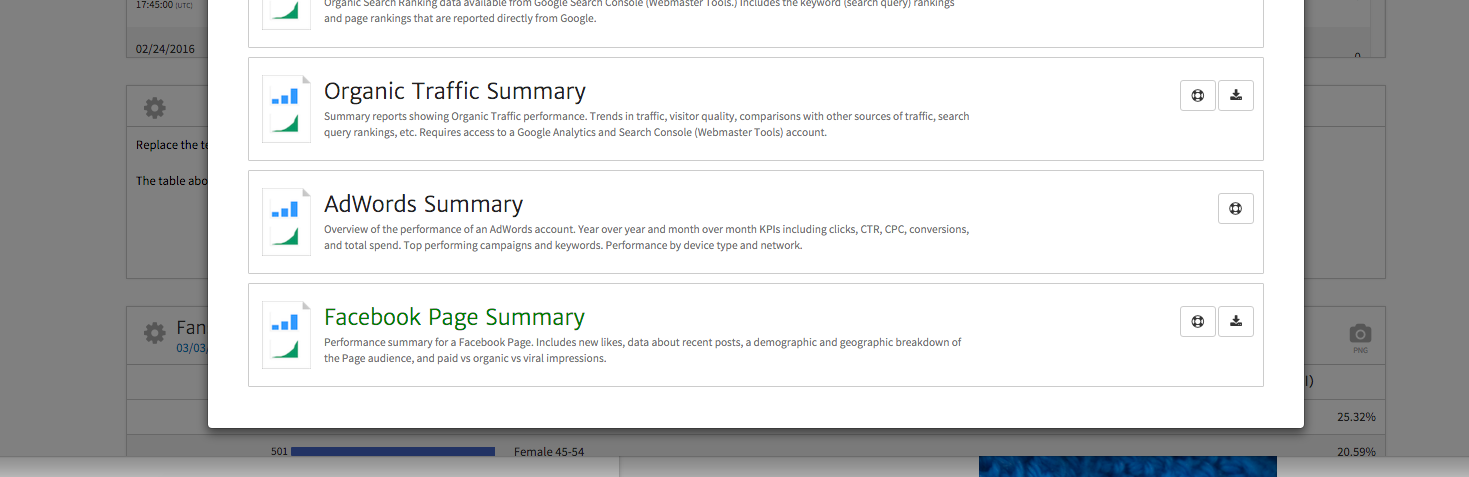
The four new Facebook widgets used in the Facebook Page Summary can be customized to drill down to specific data. These widgets are also flexible to allow you to customize the way you present the data. Below are some examples.
Tracking Your Fan Base
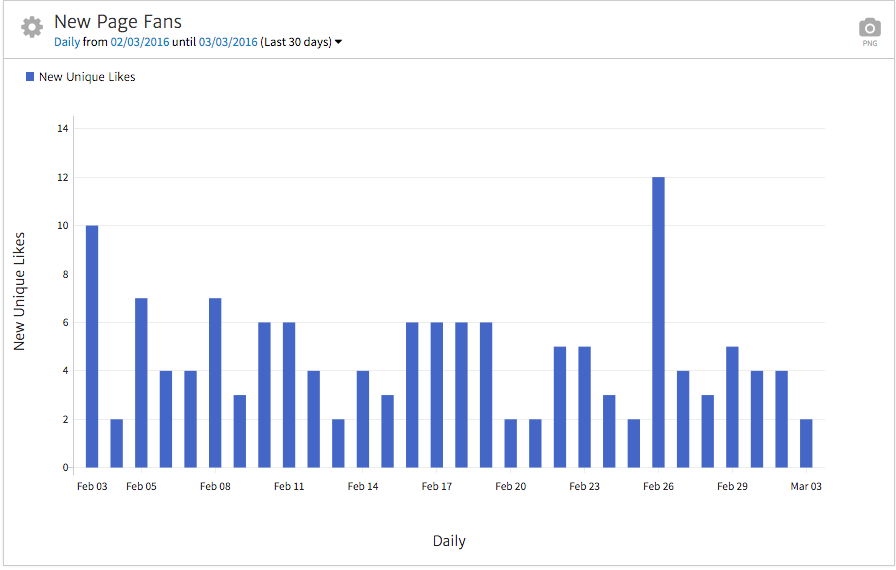
By tracking your fan base, you can show growth of a page’s following over time using the Page Likes widget. This data proves helpful in showing how your social media management efforts have contributed to expanding the audience for a brand. In the example below, a bar chart shows how new people have liked the page each day.
Beyond measuring Like counts, you can also show demographic data about your fans, including age, gender, city, country, and language. To display that information, customize the widget via the Dimension dropdown in the widget options.
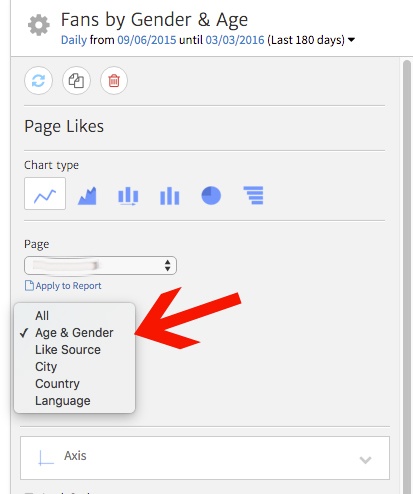
This information allows you to determine if you’re reaching your intended audience, as well as identifying new demographics that show interest in the brand. For instance, if you’re primarily targeting New York City but suddenly see a spike in Likes in Boston, you may want to try promoting the brand more in that geographic region.
You can also show this data using several different chart types, from tables to pie charts. For instance, a line chart for total Likes can be helpful to show growth over time.
Showing Post Performance
Another option allows you to show a summary of specific posts, using the Posts Published widget. This will display a table of posts including the date of publication, a thumbnail, if the post had an accompanying image, the post copy (or the initial portion of the post for longer copy), and performance metrics. In addition, each post snippet links to the actual post to easily view it in its entirety.
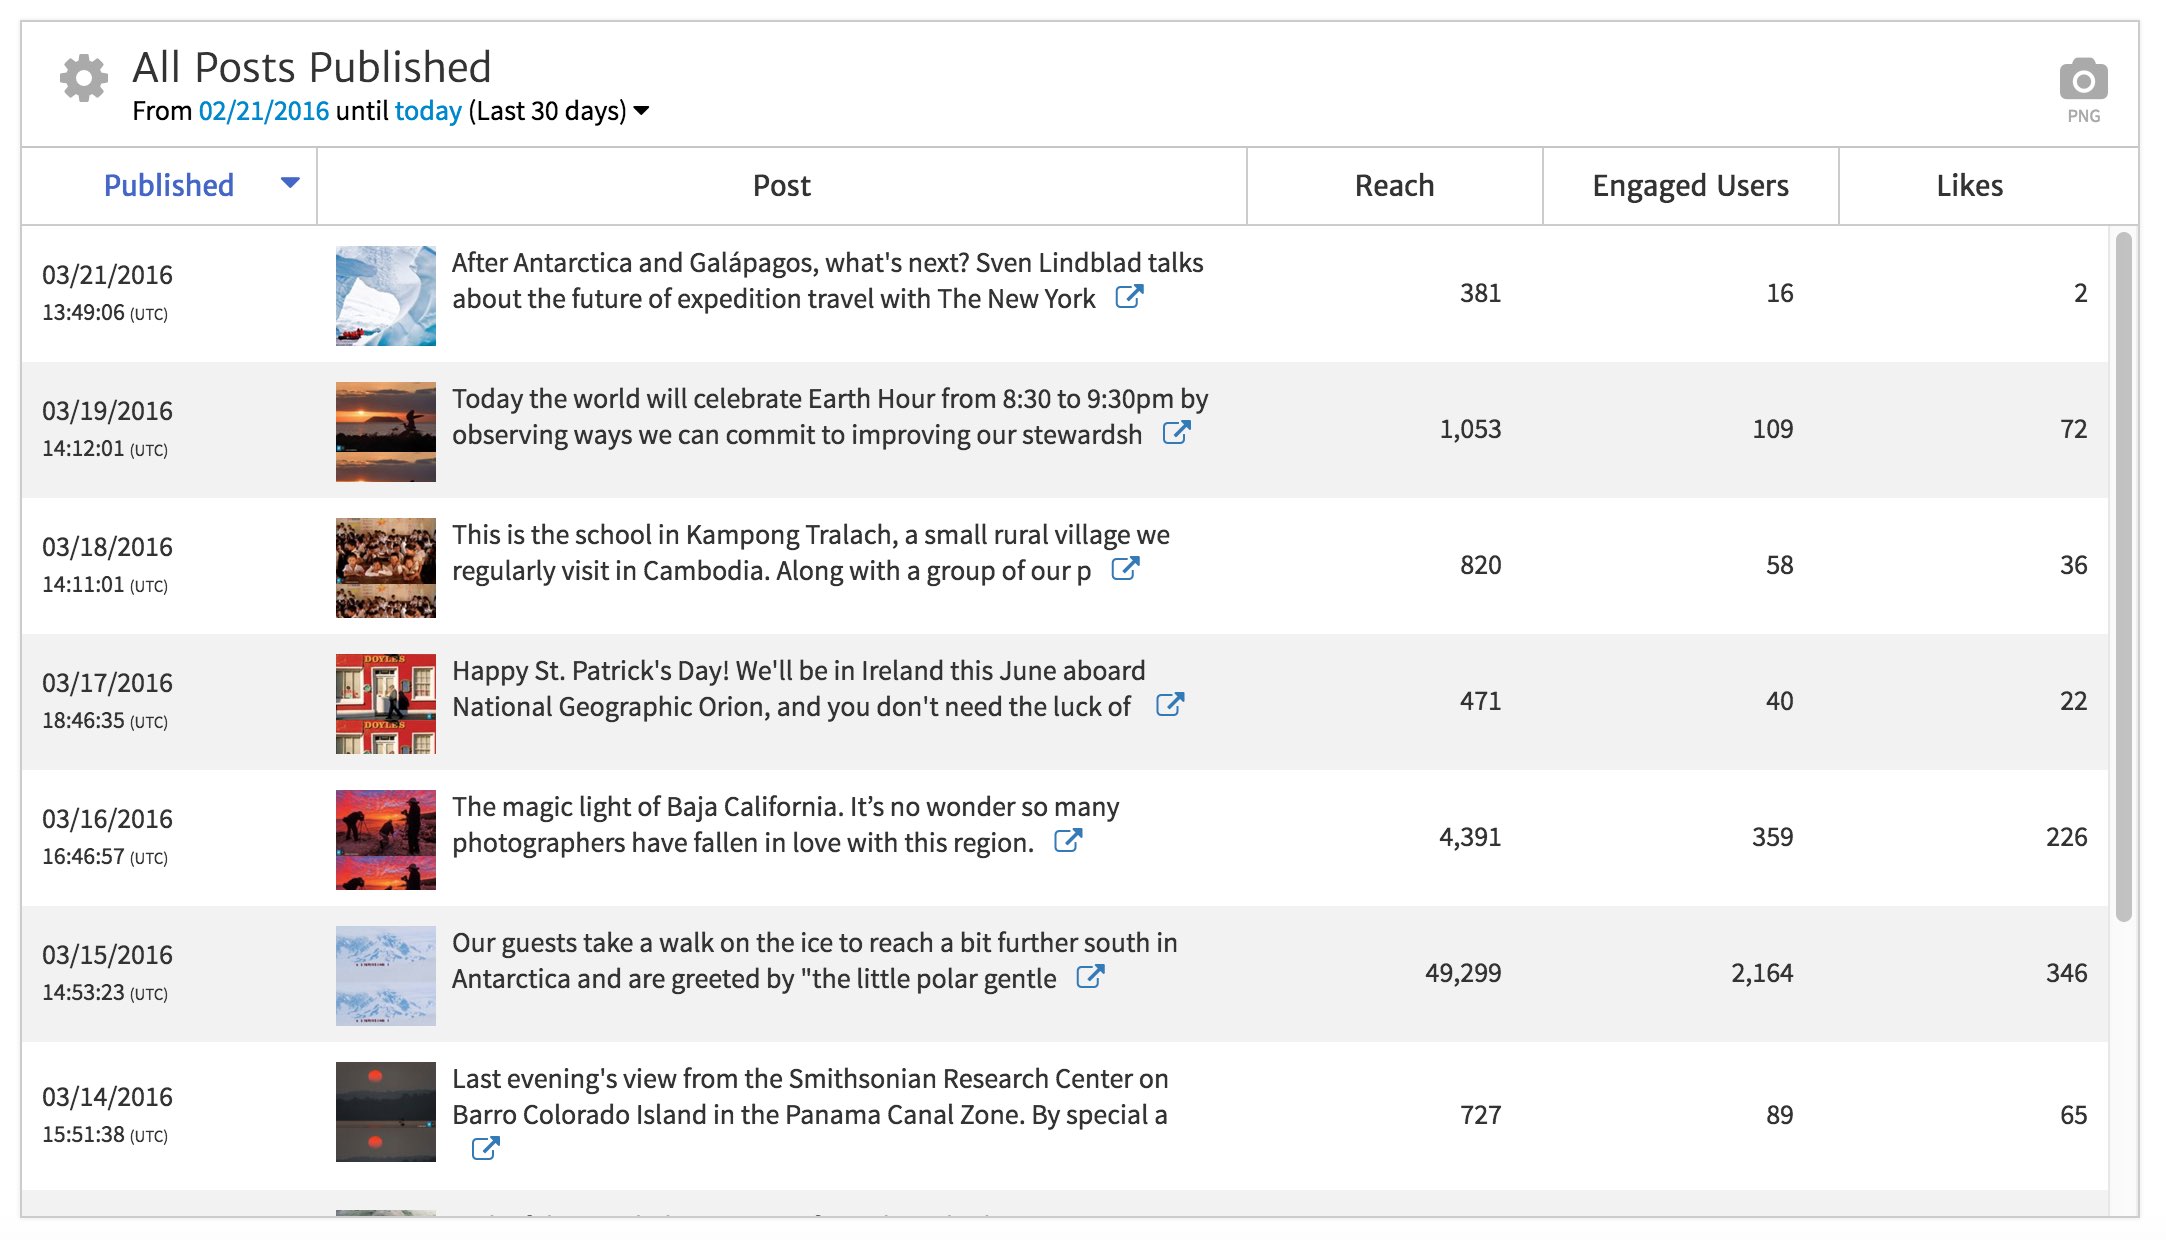
Using this data, you can show your client which posts had the most exposure and engagement. The measurement includes metrics like impressions, reach (unique individuals exposed to posts), Likes, comments, and shares. With this insight you can see which posts relied primarily on paid reach, as well as which ones may have taken off organically. An aggregate view of posts over time allows you to critique what types of messaging and format you should continue, or discontinue, using in the future.
Showing Page Impressions
The Page Impressions widget allows you to show how many total times posts from your page were shown. You can break the data down by how the posts were presented to individuals, whether through paid promotion (Facebook ads), viral views of popular posts, or standard organic reach. This example shows data from a page where paid promotion ranked as the highest factor of driving impressions.
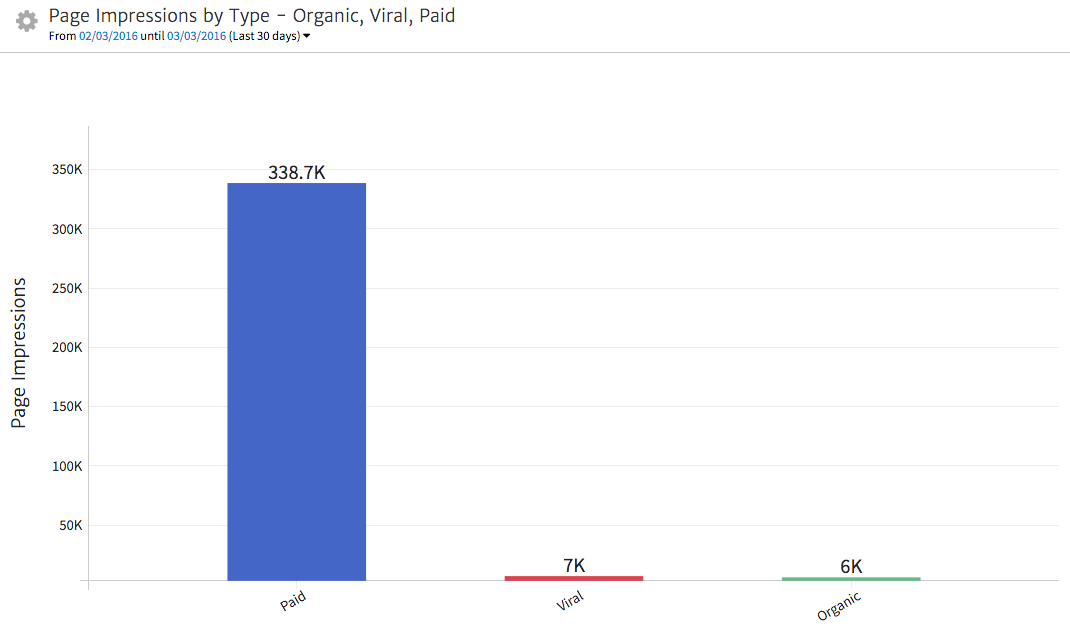
Within this widget’s options, you can change the dimension to categorize the page impressions by other variables. For instance, you can segment by Story Type, which breaks down views of posts from your Facebook page, posts from others to your Facebook page, and auto-generated posts showing that someone became a fan of the page. You can also simply show paid vs. unpaid post impressions.
Showing Page Reach
To break down data about the individuals you reached with your posts, you can use the Page Reach widget. Anyone that saw a post, even if they don’t like the page and saw it via an ad or a friend’s shared post, is counted in this data. The wealth of demographic information people provide in setting up their Facebook profiles allows you to access in-depth data about the categories of people the brand reaches.
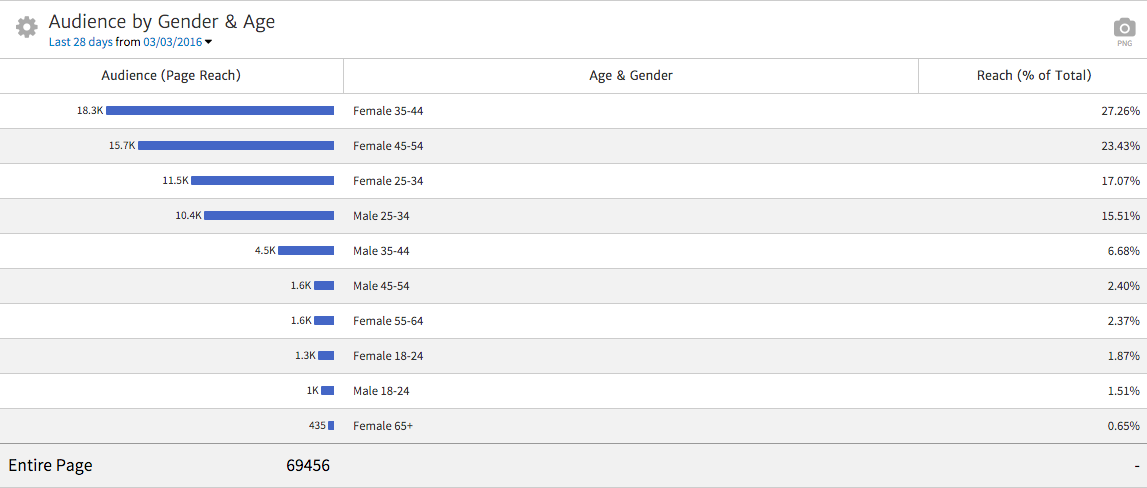
This widget offers several dimensions that are available in the Page Likes widget, as well as some additional options. You can segment the data by the following factors:
- Age & gender
- Medium (paid/organic/viral)
- Story type (page post/user post/fan who liked the page)
- City
- Country
- Language
- Frequency distribution (the average number of times people viewed posts)
- Paid & organic
This widget allows you to show full data on the demographics of people being exposed to the brand across Facebook. Beyond the people who like its page, you want to know that you’re reaching the right audience via both paid promotion and that you’re gaining traction through having posts shared.
Conclusion
With the release of Facebook integration, we hope you’ll find the new widgets helpful in taking your digital marketing reports to the next level. Now your reports can be more comprehensive by including data on your social media efforts alongside website traffic, SEO, and AdWords performance.
It only takes a few moments to connect your Facebook account to Megalytic and to update your report template with the new widgets. Your clients will appreciate seeing data on Likes, posts, impressions, and reach when you present up-to-date reports. As a marketer, you’ll be able to analyze and enhance your social media efforts in a more meaningful and integrated way. And who doesn’t want to give that a thumbs up with a happy face emoji?

