
Identifying User Locations
The geographic section of Google Analytics shows where your visitors are searching from and where they are located when they visit your website. Here, you’ll be able to see a breakdown of which cities are driving the most visitors, the highest engagement, and the most leads.
In this example, we want to show the owner of a fitness studio in New York’s Capital Region where people are located when they visit his site. To do this, we’ll look at the Audience > Geo > Location report, selecting United States and then New York to show cities within New York State.
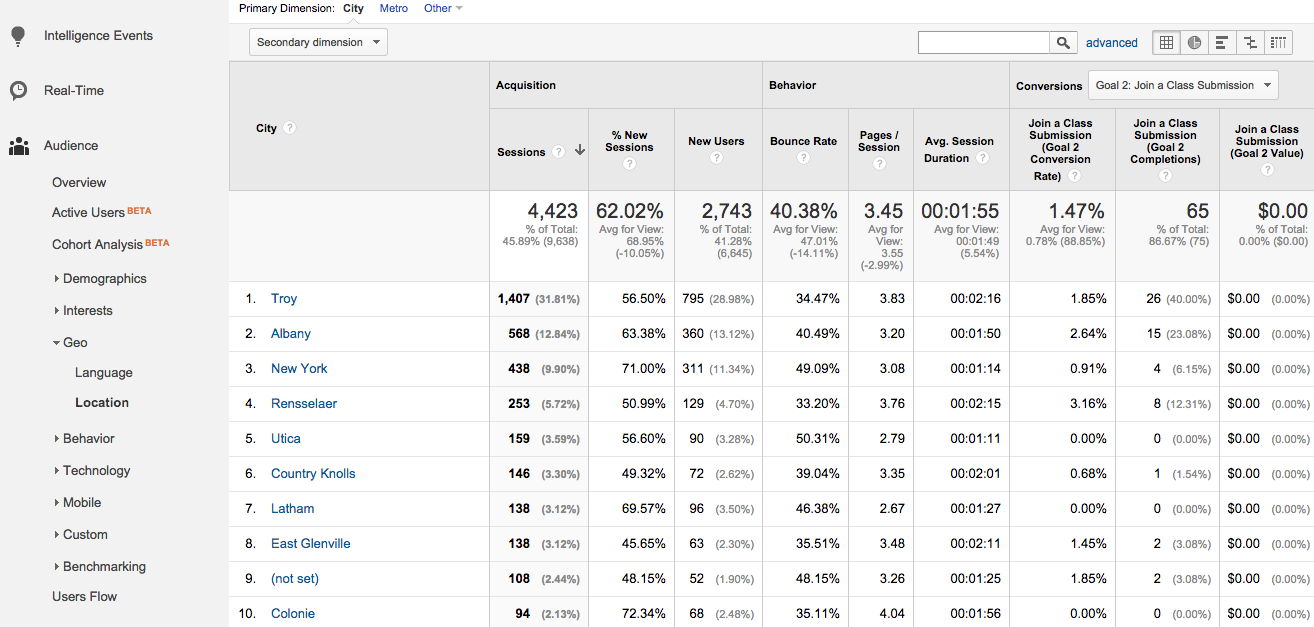
In this report, we can see that most visitors are coming from the city of Troy, where this studio is based. Albany and Rensselaer are other nearby cities showing a high volume of users. Despite being quite a distance away, we also see New York (City) appears on the list. This is likely a result of population level and NYC being a high-volume search area.
The Conversion-related columns (the right-hand side of our table) show data on goals customized to the business’s performance. In this case, we’ve selected the “Join a Class” goal, which measures people who submitted a form to sign up for a kickboxing class. Within this data, we can see both total goal completions (the total number of form submissions) and conversion rate (the percentage of sessions that resulted in a user requesting to join a class).
From this information, we note that Troy shows the highest number of “Join a Class” goal completions, by far. Albany and Rensselaer rank next in volume of class signups.
However, looking at the conversion rate, we see that Rensselaer is highest, followed by Albany, with Troy third. This high conversion rate tells us that Users coming from Rensselaer have turned out to be the most likely to sign up for a class after visiting the site.
This data can help to inform location targeting for ads. For example, this business relies heavily on Facebook advertising to generate local awareness. They may see value in creating micro-targeted campaigns that allocate a higher budget toward the cities with the highest conversion rates. In addition, geographic data can inform offline marketing efforts, such as where to send direct mail pieces or where to place billboards, based on regions most likely to convert into business.
Segmenting Traffic Sources by Location
Of course, we know that when representing data, segmenting it is far more useful than looking at it in aggregate. As such, we’ll begin segmenting our data to look not at total traffic, but how each attribution channel, broken down by city, contributed to traffic and conversion.
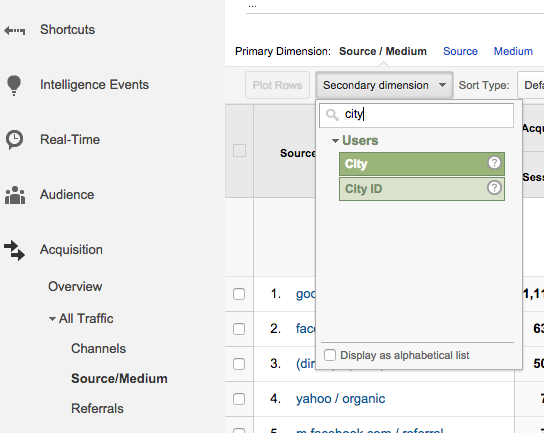
To do this, we’ll go to the Acquisition > All Traffic > Source/Medium report and select City from the Secondary Dimension dropdown to further segment the data.
Here we see a list of the top traffic sources and mediums, broken out by city. We can use this data to select the points where popular traffic sources and cities combine to show the best performance, sorting by goal completions. Note that we’ve again selected the “Join a Class” goal.
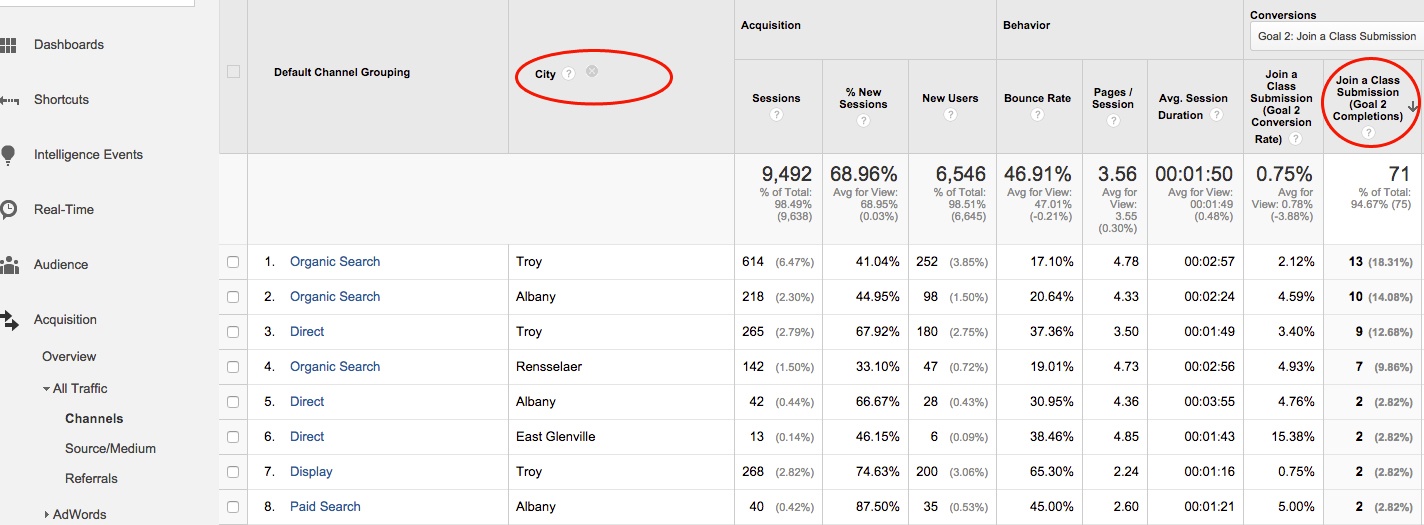
We see that organic search traffic within Troy has resulted in the largest number of conversions. However, organic search traffic from Albany, next on the list for number of conversions, shows more than double the conversion rate. This shows that visitors from Albany are twice as likely to sign up for a class as visitors from Troy. This data may encourage the client to invest in greater search engine optimization (SEO) for Albany-related search terms.
We also see that Paid Search, while only contributing a small volume of traffic and two conversions, drove a five percent conversion rate. This data suggests that investing additional budget in paid search might be worthwhile. When increasing the budget, keep an eye on this report to determine if this high conversion rate continues as the traffic from Paid Search grows.
Finding Locations in Search Queries
Besides looking at actual User locations, you can also evaluate a business’s presence on the web by looking at search queries containing mentions of cities. To do this, you can review Webmaster Tools data. For this step, you must have already linked your Webmaster Tools and Analytics accounts.
Go to Acquisition > Search Engine Optimization > Queries within your Analytics account. In this case, we’ll use the search bar to filter for the word “Troy” for city-specific searches. Note that {company} indicates where the brand name showed up in a search query, so these searches understandably received a much higher click volume.
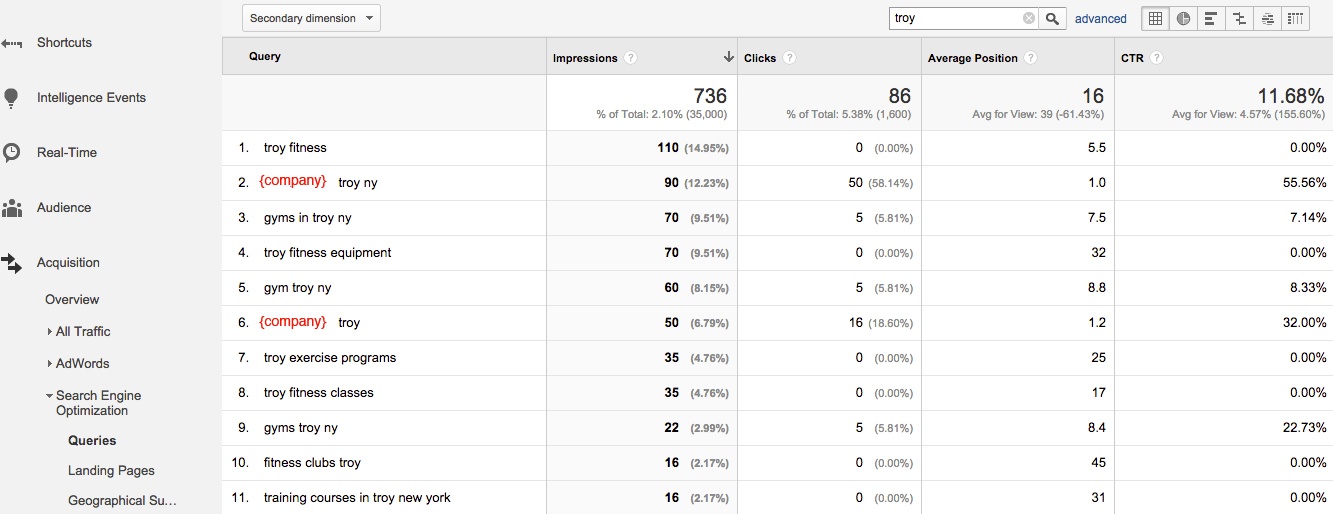
Here we see this business showed up more than 700 times in search results for queries mentioning Troy, with 86 of these searches resulting in clicks. This information tells us the business has positioned itself well in local search results, and that a decent number of people in the area are searching for gyms and local fitness centers.
We also note that, other than brand name searches, the only queries receiving clicks out of the top ten were those including “gym” or “gyms”:
- gyms in troy ny
- gym troy ny
- gyms troy ny
Based on this, we can conclude people searching for “gyms” are likely to be interested in this studio’s offerings. However, we can also identify other possible searches to target. For example, the brand is showing up in an average position of 17 (far onto the second page of results) for “troy fitness classes,” an extremely relevant search, and could increase clicks and class signups if they were able to move higher in the rankings for this phrase.
Continuing on with this analysis, you would likely want to review search query data for multiple town and city names from your business’s area. Compare impressions, volume, and average position to identify keywords that are working well and others that show opportunity for future targeting. You can either sift through queries row by row to spot city mentions or enter your desired city names into the search bar.
Conclusion
Monitoring actual visitor locations and searches containing location terms can help to guide your business’s knowledge of online prospects. Use the data available in analytics to measure what’s working and to identify new opportunities for online ad targeting, keyword optimization for organic search, and even offline marketing. In doing so, you’ll be able to position your small business a step ahead of the others who aren’t using online data to inform their business strategies.

