
All Content Contributes to Sales
If you run an ecommerce site, you may naturally think of your product pages as the revenue-generating portion of your site. However, the content marketing revolution has helped us see that every piece of content on your site contributes to sales. A customer may initially read about your product through a blog post before deciding to come back later to buy. They may download a whitepaper or read a series of customer testimonials before gaining the confidence to convert. We want to look at performance of all content types across your site to determine how well each piece contributes to engaging and, ultimately, converting visitors into customers.
Where do you begin?
Start by realizing that a number of metrics tie together to show how effective various content pieces are for your business. Numbers of visits aren’t everything, since a lot of people could be landing on a particular page but just bouncing off. You want to look at how long users stay on pages and how far they go within your site, as well as how many users ultimately convert into customers. Let’s look at how to measure the performance of some popular types of content.
Measuring Blog Posts
A consistent blog posting strategy drives search rankings and ultimately traffic to your site that may not come through other forms of content (like a whitepaper or more technical content). However, running a blog successfully requires careful review of performance to inform decisions for future topics. You should segment blog topics by theme to determine what types of posts work best in holding users’ attention as well as driving conversions.
Bounce rate indicates how many people are leaving your site immediately after landing. To identify the posts with the least likelihood of users bouncing, we go to the Behavior > Site Overview > Pages report. Then, we enter “blog” into the search bar to filter to just blog posts (as long as your site uses /blog/ in blog post URLs, you can filter this way).
Next, we click the header of the Bounce Rate column to sort the column by bounce rate, lowest to highest. Finally, we select “Weighted” under the “Sort Type” dropdown to ensure that we see statistically significant results.

In this screenshot, we see five of our best performing blog posts by engagement. We can then take the time to look through the content of these posts to see what themes most engaged readers.
Of course, we can also sort by the reverse of this example, looking at the highest bounce rates to see the worst-performing posts. In addition, we can sort by average time on page to get additional insight into engagement. Take time to look at multiple metrics before making firm decisions about how well each page performed. Also, note that setting up some additional code in your site will allow you to more accurately track content engagement.
Measuring Pages with Videos
Many businesses are giving videos central placement on their sites, whether showcasing a brand, describing the benefits of a product, or introducing visitors to a new CEO. Video offers a powerful medium to communicate branding messages. However, when implementing video, you want to be sure that people are engaging with it, and you want to measure how video is impacting decisions to look further at your website.
When measuring video, you want to look at three things:
- You want to be sure people are actually playing your video.
- You want to know how much of the video they’re watching.
- You want to know how far they go into your site after watching the video.
If you’ve embedded a video on your site from YouTube, you can add some extra code to your site to track video views and engagement. Depending on other video embedding options you’ve used, a number of solutions exist for tracking videos in your site.
Whatever your setup to track videos, use the data to inform decisions on where you place the video on your site as well as what future video content you should plan. You may find most people are only watching one minute into a five-minute video and decide to test a shorter video.
Measuring Product Pages
Product pages can exist in a variety of forms, from brief bullet points with a single image to long-form content with parallax scrolling. While the strategy may differ based on the products, these pages ultimately exist to convince a user to buy.
When reviewing the performance of product pages, you can look at similar engagement statistics as outlined in the blog section
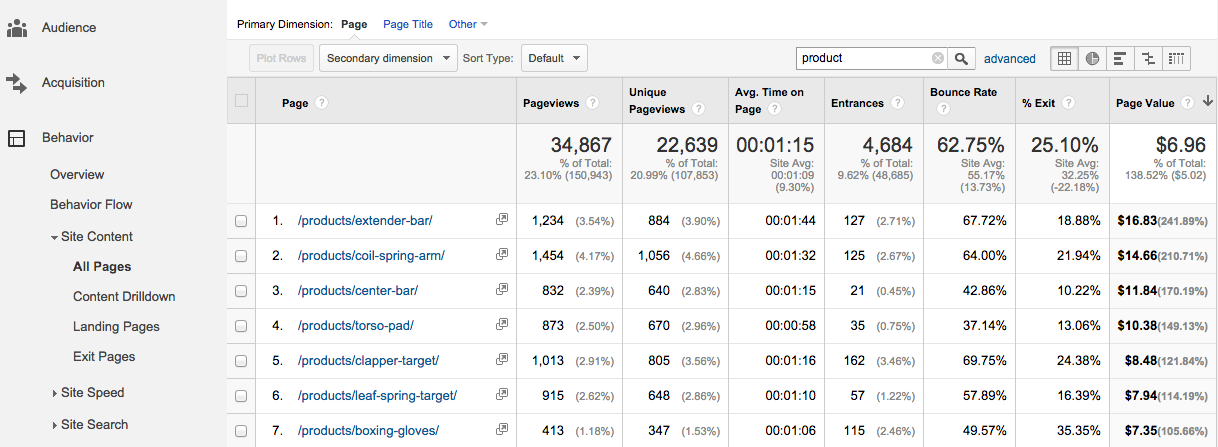
In this example, we’ve sorted by Page Value to show the average revenue attributed to each page. We can use this data, compared with the actual value of each product, to determine how various product descriptions, images, and general presentation contribute to purchases on the site.
Megalytic Measurements
Using Megalytic, you can present engagement and conversion data for content across your site. First, the “Engagement by Landing Page” widget shows the content entry points on your site that drove the best engagement. You can then determine if blog posts, video, product pages, or other content ultimately contribute to people going further into your site.
By default, this widget shows average session duration and pages/session for each landing page, although you can customize the metrics.
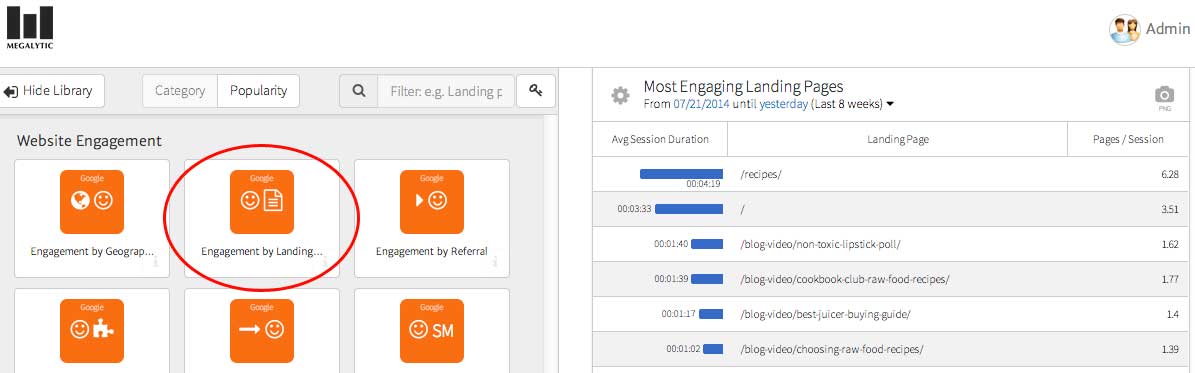
When looking at the top pages, pull out popular categories from the information you see. In this example, we can see the main “recipes” page, as well as two blog posts related to recipes, showing among the landing pages with top average times. From this data, we can infer that recipes rank among the more popular content from this site.
Next, let’s look at the top converting landing pages on the site. The “Conversion by Landing Page” widget shows goal completions and conversion rates by landing page.
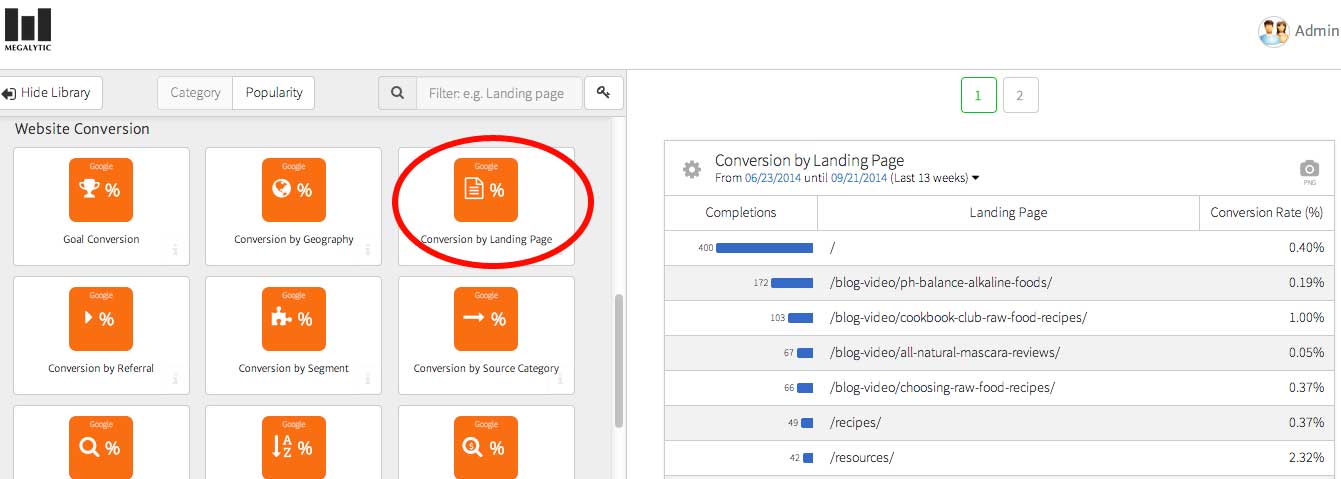
Interestingly, while we see a couple of overlapping pages from the Engagement report, we note that the top converting landing pages don’t necessarily correlate with the top engaged ones. First, be aware that different pieces of content serve to contribute to different points in a marketing funnel. A person may come to the site and find recipes to use but not be ready to immediately buy a recipe book. That purchase may take place later.
Second, observe the statistics for content across the site to decide how to improve upon your return from content. Perhaps you could improve conversion on the popular recipe posts by promoting an offer on a recipe book once a user has read through a recipe.
Conclusion
Analyzing effectiveness of content types involves looking at performance for specific pages of your site and then examining those pages to see what type of content worked and didn’t work. In addition to showing the value of past efforts, data on content performance should help drive future decisions as to what types of content to use on the site and where.

