- Where should you start - which campaigns or activities are most important to look at?
- What metrics should you focus on – traffic, engagement, conversations, etc?
- And, of course, how should you visually display the results to best communicate the insight?

Identifying KPIs
Ideally, digital campaigns will be created to focus on two types of objectives – business objectives and cost objectives. So when you’re identifying KPIs for a digital marketing campaign, you’ll want to look at what the business hopes the campaign will achieve (an increase in more qualified sales), as well as the cost-specific goals you have (a decrease in the cost per click) for that campaign.

The business objectives will have been determined by the senior management within the organization. To uncover these, you’ll need to speak with the management team or someone who is aware of their priorities. If you don’t have access to such a person, you can use your intuition about what benefits the campaign seems designed to generate for the business. See How to make a Web Analytics presentation to the CEO for some more background on sussing out business objectives.
The cost objectives will probably have been laid out by folks in the marketing department. These are likely to be determined based on how the campaign fits into the overall portfolio of marketing activities.
For the purposes of this post, we are going to assume the campaign has the following business objectives:
- Increase Traffic from Social Media
- Increase the Rate of Trial Account Signups
In this particular situation, the business is very happy with the performance of organic and paid search traffic. As a result, they have tasked the marketing department with increasing the volume of its social media traffic. They feel this is an area of great opportunity. This is objective one. A good KPI for this is to simply measure the Monthly Sessions coming to the website from Social Media sources.
The second objective goes right into the heart of growing the business – increasing the rate of trial account signups. Based on past experience, generating more trial accounts invariably leads to more revenue as the trials convert to paying accounts. A good KPI for this objective is to measure the Monthly Trial Account signups. Fortunately, these signups can be tracked using Google Analytics Goals.
For the marketing department, this campaign is one of many that need to adhere to specific cost objectives with their portfolio of campaigns:
- Cost per Click (CPC) of Less Than $1.50
- Cost per Trial Account (CPA) of Less than $40.00
The marketing team has a specific budget for delivering clicks and generating trial accounts. They know that if they can keep CPC and CPA within these ranges, they’ll be able to deliver the results the business needs and stay within their budget. In this case, the KPIs for these objectives are simply the CPC and the CPA for the campaign. We will look at how these are calculated in the next part of this series.
Reporting on KPIs
Once you have identified the KPIs you want to track, its time to start thinking about the best way to report on these. Generally speaking, it is a good idea to present KPIs in a couple ways.
First, you should provide a simple display of the result and how it compares with a prior period. For this, we invariably use KPI widgets. It is also a good idea to provide a time series representation of the data to provide context. For further analysis, you may also choose to segment the data between general website traffic and traffic coming from the particular campaign you are reporting on. This will show the effectiveness of the campaign most clearly.
Traffic from Social Media
Starting with the Megalytic KPI widget, we open the widget editor, click on “Show Filter” and then set the Default Channel Grouping to exactly match “Social.” This will restrict the widget to report only on the traffic from Social Media.

Next, we click on the date range in the upper left and select the period to be “Monthly” (as the business likes to look at marketing data on a monthly basis), and the end date to December 2014 – the month that the campaign ended.
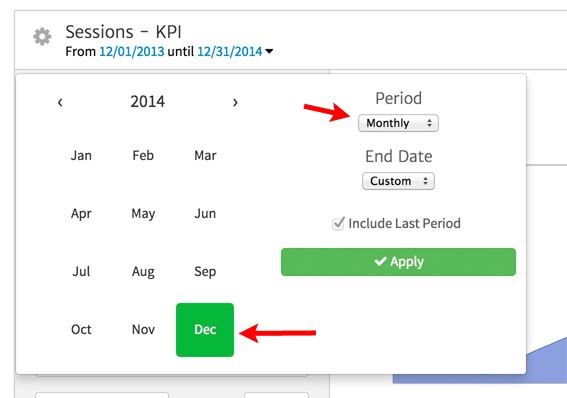
We will also edit the title to be “Social Media Traffic” – a reflection of the way the business management expressed its goal: “Increase Traffic from Social Media.” When presenting data, it is always a best practice to use language that is as close as possible to the terminology your audience uses.
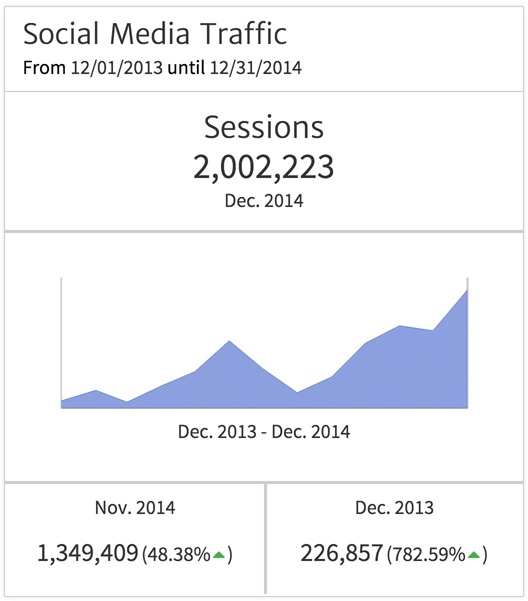
This campaign started in June 2014, and as you can see from the sparkline chart in the center of this KPI widget, has been very successful in increasing traffic from Social Media during the last six months. The last month of the campaign (from November 2014 to December 2014) was particularly successful, with a 48.38% traffic increase. To add context, it’s helpful to know Social Media traffic increased over 750% since December of 2013.
This KPI widget shows social traffic from all sources. But what about the specific campaign that started in June and ended in December? It makes sense to also show a time series chart that focuses on just that campaign.
To do that, we can use the Megalytic widget named “Traffic by Campaign/Keyword.” As we did above for the KPI Widget, we add a filter that restricts the traffic to the “Social” channel. Having done that, we select a line chart to display the monthly Sessions over the last six months.
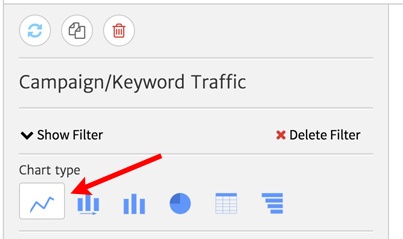
This produces a chart that graphs the top three campaigns producing social media traffic over the six month period.
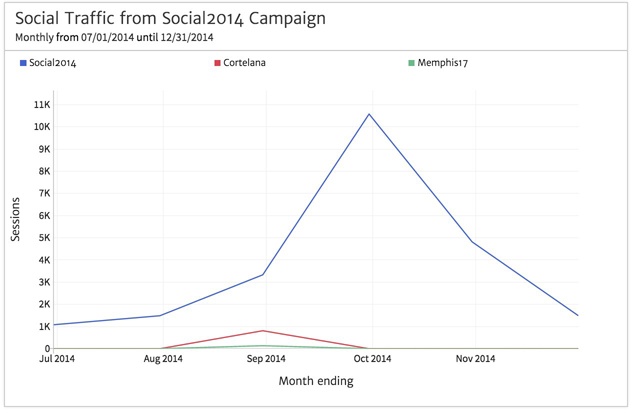
The campaign we are tracking is named “Social2014” and it clearly dominates the social media traffic in this chart – the other two closest campaigns are tiny in comparison. What is interesting, however, is that this campaign peaked in October and then trailed off in November and December. But, as we saw in the above KPI chart, the social medial traffic kept increasing. How it that possible?
Organic growth! The Social2014 campaign was so effective t that it sparked a larger overall interest in this brand on social media. Soon, the campaign itself became less important, as there was enough organic tweeting and Facebook sharing. Seeing the natural success, the marketing department made the decision to scale it back.
Why scale back something that is working so well? The answer has to with managing the overall CPC budget. We’ll dive more into that in Part II of this series where we’ll talk about KPIs Based on Marketing Objectives.
Trial Accounts
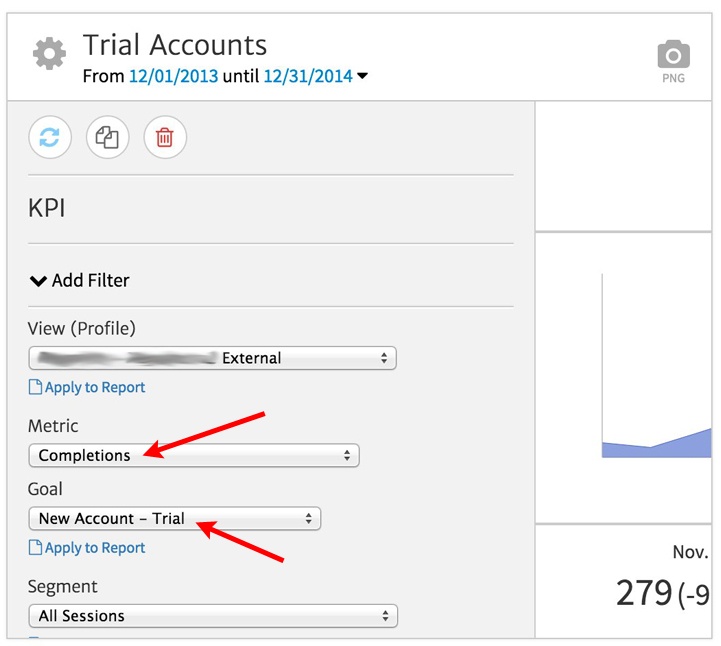
As we did above, we are going to use a KPI widget to highlight the number of trial accounts created each month. In this case, we don’t use a filter, but we do change the metric being displayed by selecting “Completions.” Since “Completions” is a goal metric, the Goal selector is revealed in the widget editor. We select “New Account – Trial” which is the goal tracking our trial accounts.
The completed KPI widget is shown below. You can see that the New Account conversions were rising well in July, August, September and October. Then they dropped slightly in the last two months of the year.
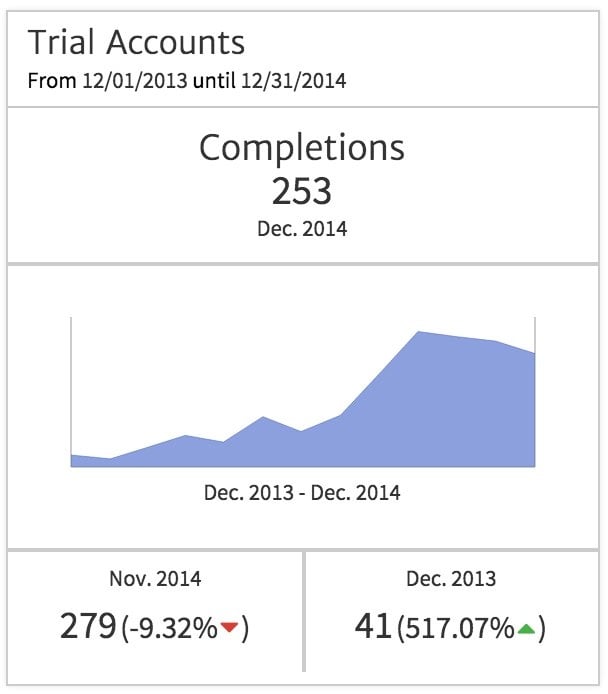
The marketing team will need to explain to the business management the cause of the decline at the end of the year. Is this a seasonal effect, or something defective in the campaign? It is usually a good idea to include key background information like this and a Note that provides text embedded right into the report – see: Notes widget.
Conclusion
KPIs, or key performance indicators, are used to demonstrate how effectively a campaign is achieving its business and marketing objectives. They should be selected carefully as, over time, they will become you organization’s agreed upon, de facto standard. In this post, we have looked at KPIs based on a business’ objectives, focusing on how to identify them and how to report on them. In Part II of this series, we will example KPIs based on marketing objectives.

