
Marketing Department Cost Objectives
As discussed in Part I, the marketing department has specific cost objectives for their portfolio of campaigns.
- Cost per Click (CPC) of Less Than $1.50
- Cost per Trial Account (CPA) of Less than $40.00
Each individual campaign may vary somewhat from these objectives, but, on average, costs need to net out within those parameters for the campaign to be considered profitable.
To help the marketing department assess the performance of individual campaigns, we want to report on KPIs related to these two objectives.
Cost per Click (CPC)
Cost per Click (CPC) is defined as the average cost you paid for someone to click on an advertisement and land on your website. It is a common metric for tracking the cost effectiveness of paid ad campaigns. 1
So, suppose you paid $1,000 for the ads and you received 400 click-throughs. T the CPC for this campaign is $1,000 / 400 = $2.50.
The marketing team typically has a goal for how much they are willing to spend to increase website traffic. For example, suppose that goal is $1.50 per visit. In this case, our advertising campaign should have a CPC of less than $1.50 to be consistent with our marketing goal of not paying more than $1.50 per visit.
The CPC of a campaign may fluctuate from day-to-day based on how many people click on the ads and what rate you are bidding to display the ads. So, for the KPI, you probably want to look at CPC over some consistent period of time – weekly or monthly.
Many organizations like to look at KPIs monthly. his will help smooth out any volatile daily fluctuations and is consistent with monthly planning.
Displaying Monthly CPC for a Campaign using Megalytic
If you are running an advertising campaign with Google AdWords, you can easily use Megalytic to display Monthly CPC as a KPI. Start by dragging the KPI widget onto your report.
By default, the KPI widget displays the Sessions metric. However, you can choose from a wide range of metrics to be displayed.
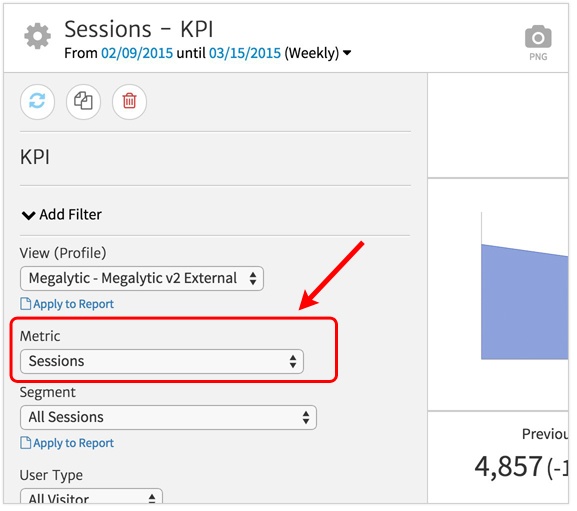
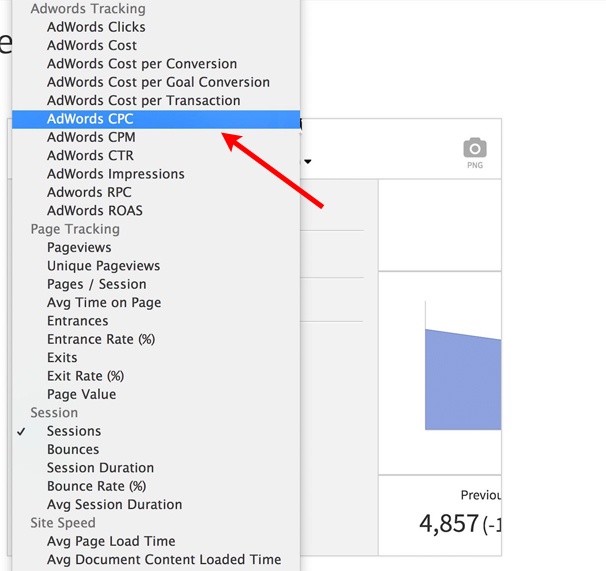
In this case, we are going to select the AdWords CPC metric – which appears in the “Adwords Tracking” category in the metric selection list.
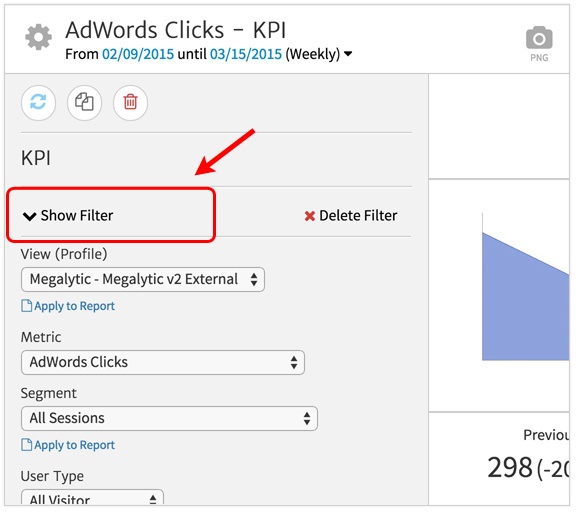
At this point, the KPI widget is set up to display CPC, but for which campaign? By default, the widget displays the average CPC across all of your AdWords campaigns. To select a specific campaign, use Megalytic’s filter capability. Click on “Show Filter” as shown below.
This will open up the Filter editor where you can configure it to match your campaign. Select “Include” and “Campaign,” and then type in the name of your campaign. If you are unsure of the specific campaign name, use the Megalytic widget “Traffic by Campaign/Keyword” to see a list of all your campaigns.
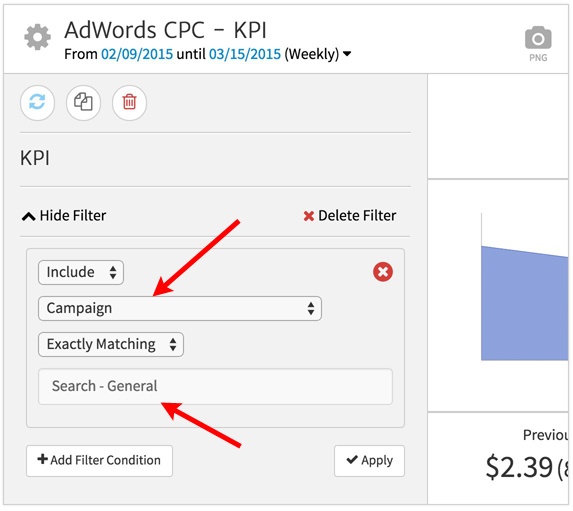
In this case, we entered the name of a general purpose search campaign called “Search – General.”
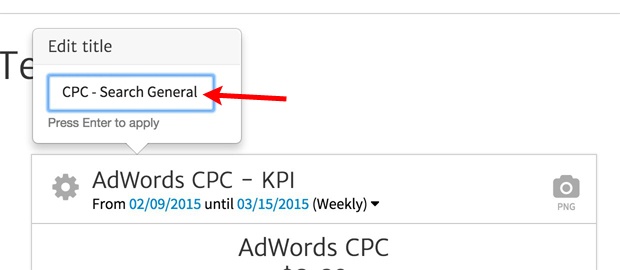
As shown below, you many also want to adjust the title of the widget to include “Search – General” so it is clear to the readers of your report what campaign is being reported on.
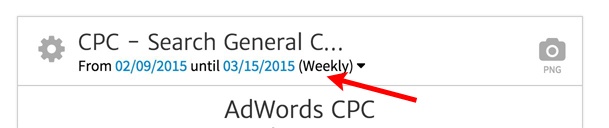
Lastly, double check you are reporting your KPI for the correct time period – monthly in this case. By default, the KPI widget shows data weekly. To change this, simply click on the date range as shown below.
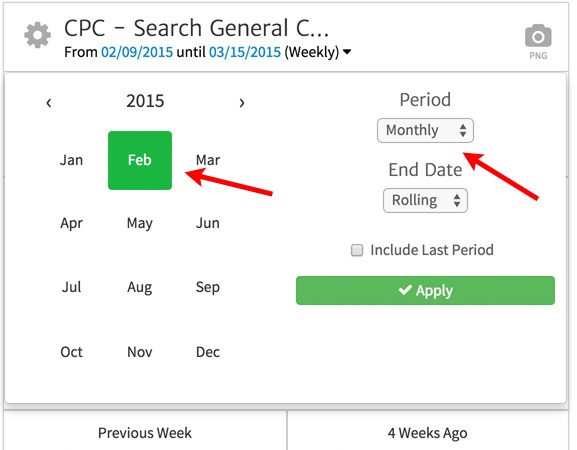
This will open the date picker where you can update the Period from Weekly to Monthly. For “End Date,” pick “Rolling” to select the last full month of data. For example, since it is March, the date picker shows February. When April rolls around, it will advance to March – always showing the last complete month.
Click “Apply” to save your changes and then close the Widget Editor by clicking on the gear symbol in the upper left. The KPI widget now looks like this:
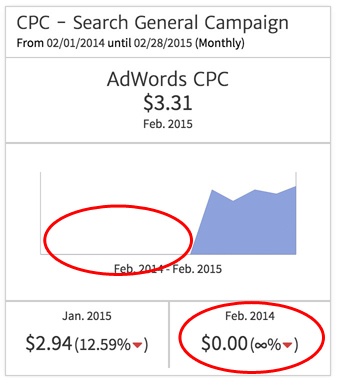
Because this campaign has only been running for five months, the display shows some empty space on the chart, and the year-ago comparison (to February 2014) doesn’t make sense. The widget is showing the CPC as $0.00 in February 2014 – because the campaign was not running then!
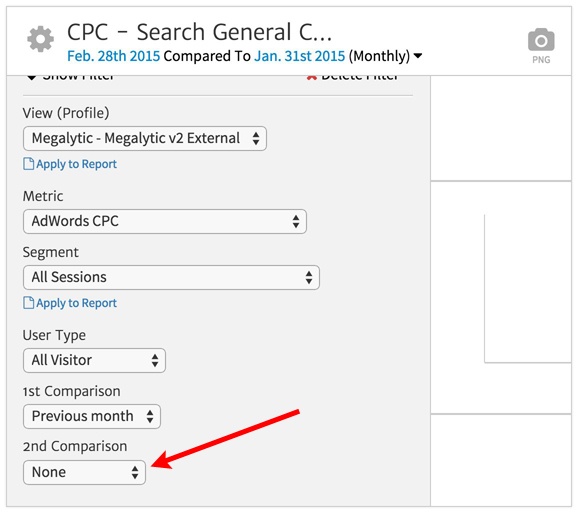
By default, the KPI widget displays two comparisons – the previous month and the same month one year ago. In this case, we only want to show one comparison -- comparing with the previous month. To do that, open the Widget Editor again and set the “2nd Comparison” to “None.”
This will cause the widget to only display a single comparison – with the previous month. The resulting KPI display is shown below.
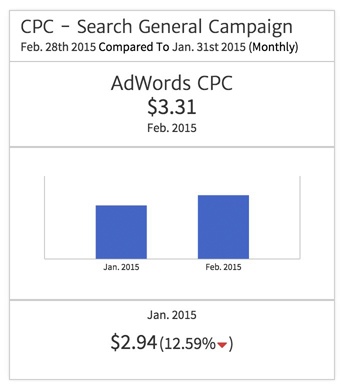
This shows that our CPC for February was $3.31 – 12.59% worse than in January, when it was $2.94 – and far higher than the target of $1.50.
In this kind of situation, when the KPI shows you are not meeting the campaign cost objectives, further research and explanation may be needed. For example, not all traffic has equal value – right? If this campaign is bringing in traffic that is much more likely to convert into paying customers, then it might be a good business decision to pay more than $1.50 per click for this campaign.
Determining whether of not the traffic from this campaign is worth a $3.31 CPC, we need to look at the other KPI that the marketing department identified – the Cost per Acquisition (CPA).
Cost per Trial Account (CPA)
The Cost per Trial Account is the total cost of the campaign, divided by the number of trial accounts created by visitors who found the website via the campaign. A Trial Account is a type of acquisition, so the appropriate metric to look at here is the Cost Per Acquisition (CPA). For example, suppose the campaign costs $1,000 and yields 25 visitors who create trial accounts. The CPA for this campaign is $1,000 / 25 = $40.00.
The marketing department may care more about the CPA than the CPC. That is because, ultimately, the purpose of marketing is to bring in business. So, a campaign that is efficient at generating trial accounts (the first step in the sales funnel) – as measured by a low CPA – may be great for the business even if it has a high CPC.
So, let’s examine the CPA for the same campaign we looked at above, Search General.
Displaying Monthly CPA for a Campaign using Megalytic
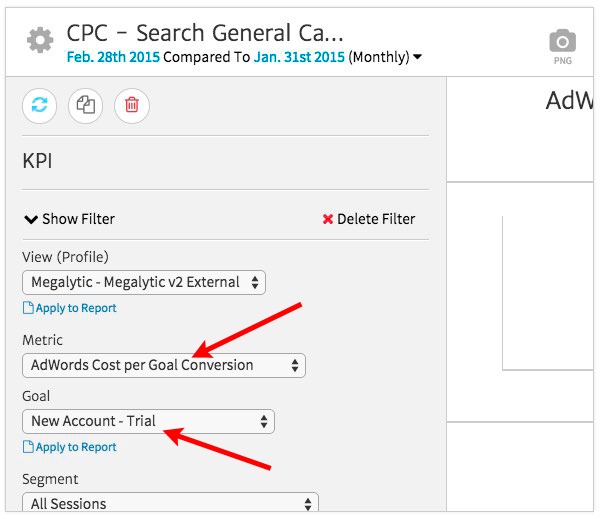
In Google Analytics, a Trial Account signup can be tracked as a type of Goal Conversion Assuming you have set up this type of Goal to track Trial Account signups, then you can use Megalytic’s KPI widget, as above. This time, however, select the metric named “AdWords Cost per Goal Conversion” to display the CPA. Be sure to select the correct Goal for Trial Accounts.
Once you have made those selections, change the title to read “CPA – Search General Campaign.” Now you have KPI displays for both CPC and CPA. In Megalytic, you can even drag them side-by-side to look like this.
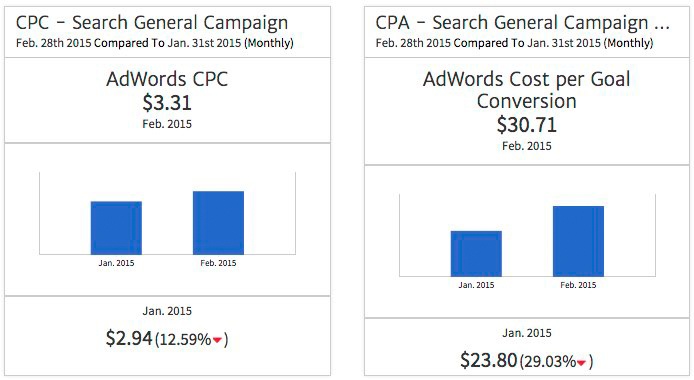
Notice the CPA is below $40.00 in February (even though it rose 29.03%). So, even though this campaign seems costly on a CPC basis, it is very efficient when looking at the CPA. The marketing department will probably conclude that it is worth the CPC cost to bring in this qualified group of users that converts at high enough rate to drive the CPA down below their $40 threshold.
Conclusion
Even if you aren’t analyzing Super Bowl ads, it’s important to pick the right KPI to track the cost objectives of your campaigns. Depending on the campaign’s objectives, the KPI will vary. For Super Bowl ads, CPM might be the right choice. But, for AdWords campaigns, it’s more likely to be CPC or CPA. Consult with your marketing department to make sure you understand the objectives for each campaign and how to best measure them.
This is the second in a two-part series. Here, we have looked at KPIs based on cost objectives. In Part I, we examine KPIs derived from on business objectives.

