Setting up the CSV Widget
There are several use cases where marketers may need to use the CSV widget to import data from a spreadsheet directly into a report. Some include:
- Showing data from advertising platforms that don’t integrate directly with Megalytic (Facebook Advertising, Twitter Ads, Bing Ads)
- Showing results from website call tracking platforms
- Showing sales results tracked within a company
- Reporting information submitted through website forms (names, emails, phone numbers)
- Reporting results from email marketing campaigns
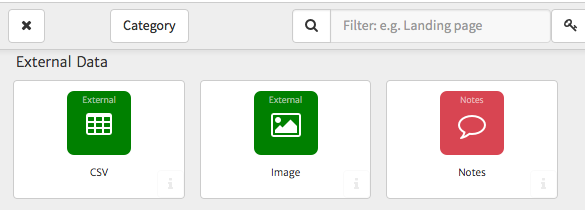
You’ll find the CSV widget listed under the “External Data” category within the list of available Megalytic widgets. Note that you can also use the search bar to pull the widget up directly.
Once you’ve located the widget, drag it to the desired position in your report to add it. You’ll immediately see a prompt to upload a file.
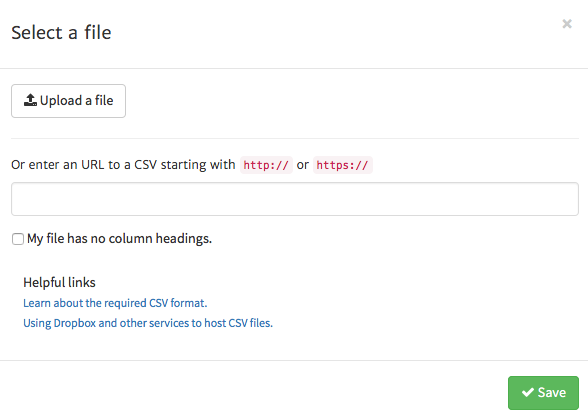
Now, locate the CSV file on your computer that you wish to add to the report. When creating your file, keep in mind that you can currently show up to six columns within this widget. If you include more than six columns in your file, you’ll want to choose which columns to show from the widget options.
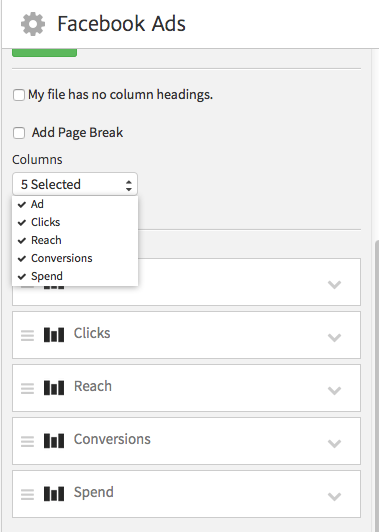
If your file contains a header row (e.g., Clicks, Reach, etc.), leave the “My file has no column headings” unchecked. That way, the widget will format the top row differently, as headings. Once you click “Save,” you’ll now see the data from your file shown in the widget.
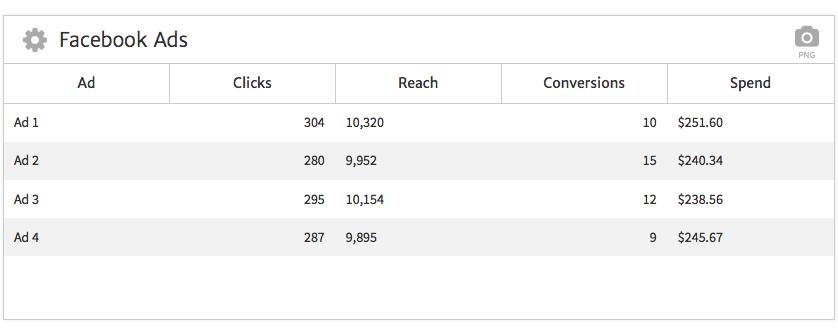
In this example, we’re showing data from a Facebook Advertising account. Most ad platforms will allow you to export data as a CSV, so you can easily pull the numbers you want and modify the spreadsheet in Excel to contain your desired columns before uploading.
Once the data is in the widget it can be customized in several ways. First, choose which columns from your spreadsheet you want to show. Using the “Columns” dropdown, click columns from the list to check or uncheck them based on which ones you’d like to appear in the report. “Apply Selection” under this dropdown will update the report with your choices.
To rename a column, click the name of that column in the options and type in your new text. For instance, you may want to rename “Conversions” to “Form Submissions” to clarify what this metric means to your client.
To rearrange the order of columns in your report, click the “hamburger” (stack of three lines) icon on your desired column and drag to the proper position. You can also further customize each column by clicking the “down” arrow on the right side from within the options. You’ll now see several options for formatting the data within that column.
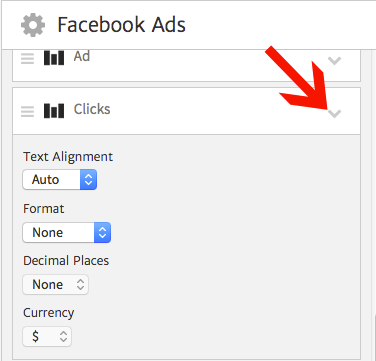
First, you can choose to align text to the left or right if you’re not satisfied with the automatic alignment. Next, you can format the text as a number, percent, or currency.
You can also choose how many decimal places you’d like to show; for instance, you may want to show dollar amounts down to the level of cents. Finally, you can choose between several currency symbols; for instance, you may want to show pounds instead of dollars.
Note that if your original Excel document was set up to include currency symbols or decimal points, these will automatically upload with the same formatting. However, the options outlined above allow you to tweak the data after it is in Megalytic.
Hosting Spreadsheets Online
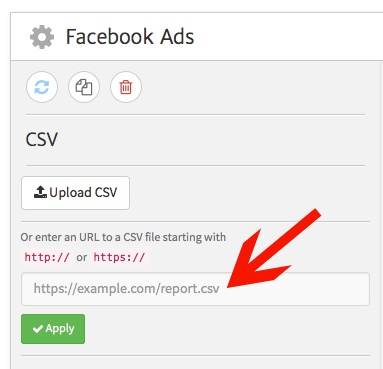
Instead of uploading a file directly to Megalytic, you can also host a CSV file online using a cloud service such as Dropbox or Google Drive. You’ll just need to make sure the file URL is set to be publicly accessible. When you’re adding data to your CSV widget, simply enter your file’s URL into the available text field and apply to your report to update the data.
This service is especially helpful when you’re consistently creating monthly reports that require regular data, eliminating your need to re-upload data into Megalytic each time. Your Megalytic report template can reference the same file, so information will auto-update as you update the file in your cloud storage service.
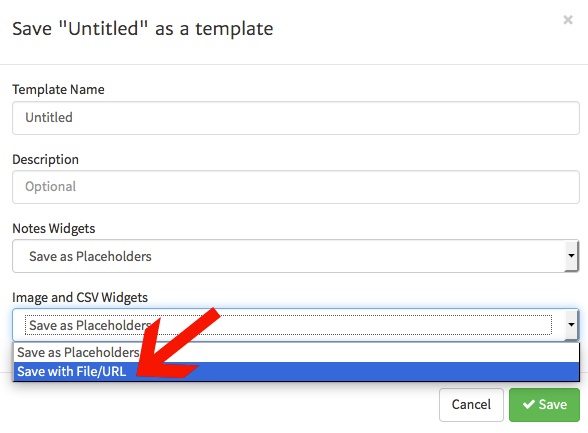
In order to preserve the file link in your templates, be sure to choose the option to “Save with File/URL” while saving the template, as shown below. Now, when you create your next report using the same template, this widget will automatically pull fresh data from the same CSV file.
Using the Image Widget in Megalytic
Besides spreadsheets, you may also want to include screenshots or other imagery in your report. You can do this using Megalytic’s Image Widget. Here are a few possible uses for this widget:
- Including screenshots of data from your social media profiles (Facebook business page analytics, examples of tweets posted during the last month)
- Including screenshots of display ad creative for which you show stats
- Including screenshots of pages on your website mentioned in the report
- Showing performance graphs from advertising platforms
- Showing examples of email marketing pieces
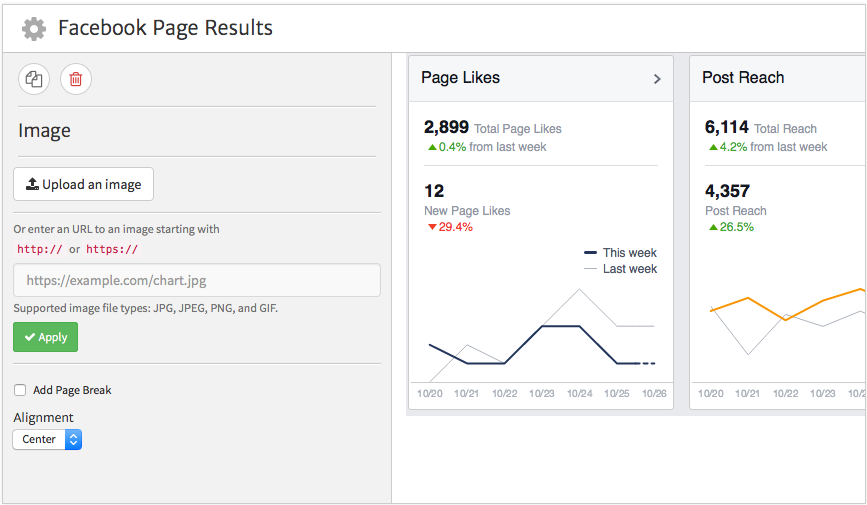
You’ll find this widget under the “External Data” category shown earlier. Upon adding the widget, you’ll see a prompt to upload an image to your report. You can include jpg, jpeg, png, or gif files.
Note that you can also point to a file hosted in the cloud, just as with the CSV widget. For a template report showing monthly results, you could update an image file with the same file name each month. The “Alignment” dropdown allows you to align the image to the left, center, or right in your report.

In this example, we’re including a screenshot of Facebook Insights to show recent performance for a business page. This allows us to quickly break down social media results for the client, including a screenshot, as opposed to manually typing in the data.
Below an Image widget, you could also add a Notes widget to further explain the graphic shown. For instance, you could explain how your posts and advertising efforts contributed to the growth in likes and reach over the previous period.
Conclusion
CSV and image widgets allow marketers to show data beyond the systems automatically integrated with Megalytic. Your reports can include a full picture of your marketing efforts, whether you’re showing Facebook page stats, ad campaign results, or sales figures. Take some time to learn how you can customize these widgets to add the right data to your reports and best communicate to your clients.

