
When to Use Templates
There are two common scenarios where templates are a big help.
- Utility Template – contains your most commonly used charts and tables.
- Monthly Report – standardizes the format of a report you create every month, potentially for many clients
Utility Template
A “utility template” contains the charts and tables you need to use most frequently. We call this a “utility template” because it is a general utility that can be used as a starting point for building the reports you need most commonly. When faced with an urgent reporting task, you can quickly create a rough draft report from your “utility template” and then modify it as needed for the task at hand.
Monthly Report
Whether you work in-house or at an agency, reporting isn’t something that happens one time. It happens every month. Monthly Report templates allow you to build your report once, and then save that report as a template so it can be quickly generated with a couple of clicks. Then, all that’s left to do each month is to finalize the report by updating the date range, and adding text and a cover page to highlight key insights for the current month.
Getting Started – Built in Templates
To see how Megalytic templates work, start off by generating a report from one of the many built-in templates offered. You can find a number of report types, with explanations, described in this support document.
If you want to follow along with the examples in this post, create a free 14-day trial account and build a report as we go. There is an also an instructional video that shows how to set up your trial account.
To use a built-in template to create a report, simply click on the “Create New Report” button on the left side of your Megalytic dashboard.
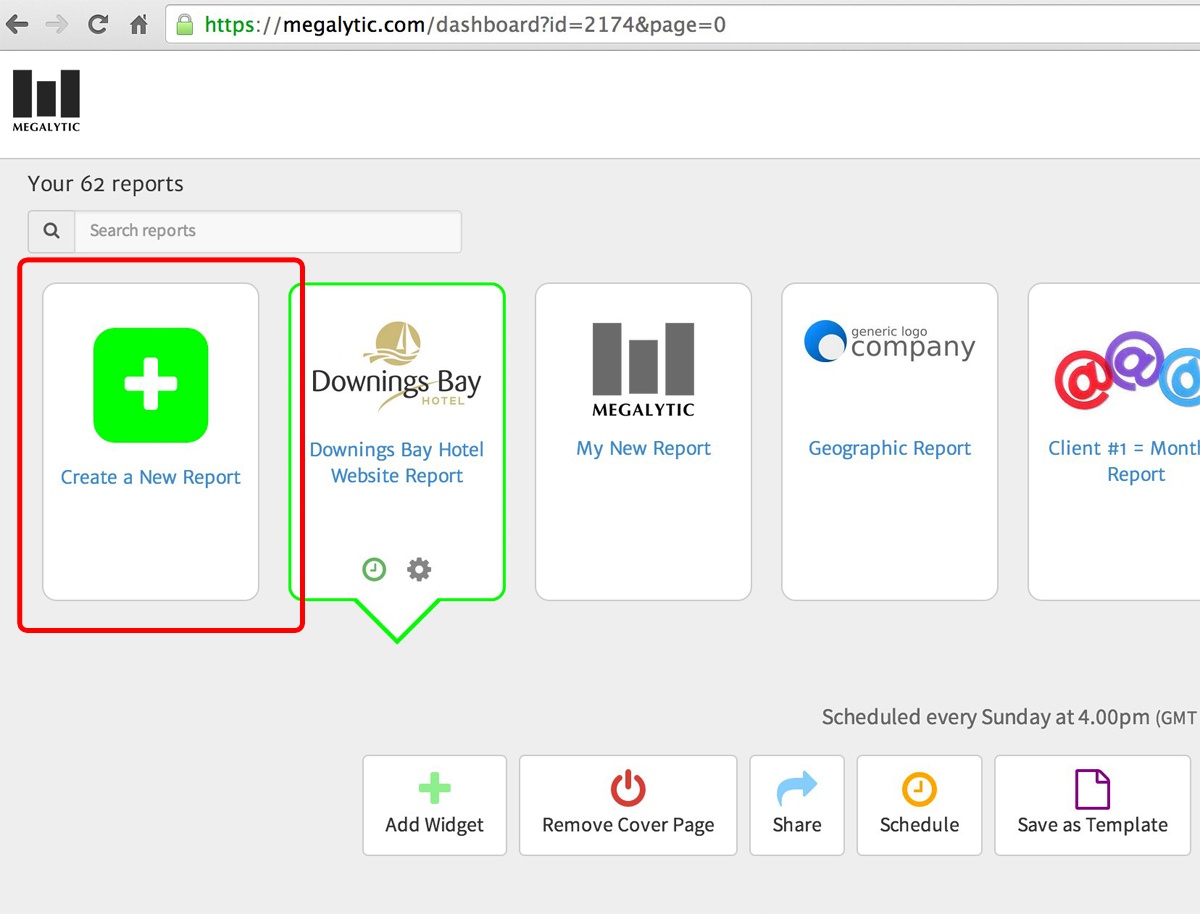
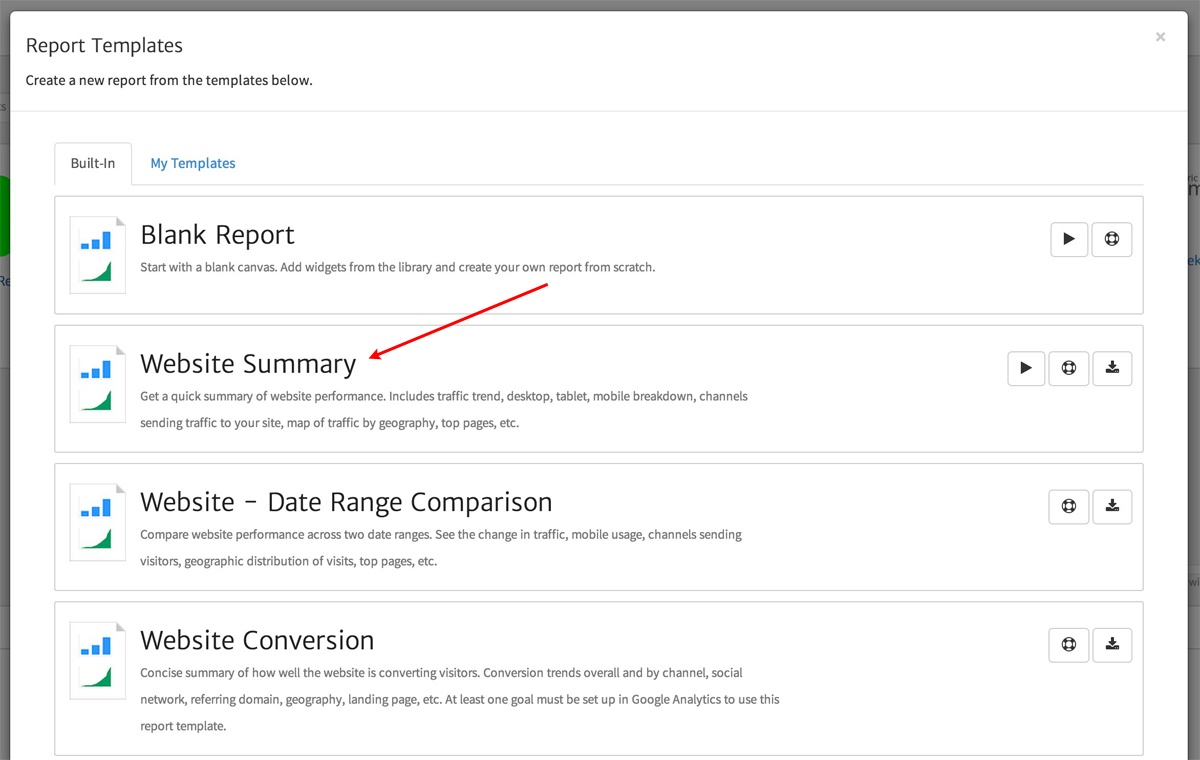
Once you do, a window will open showing a list of built-in templates, such as “Blank Report,” “Website Summary,” “Website – Date Range Comparison,” etc. Click on “Website Summary” to generate a report that provides a basic overview of website performance.
Next, you will be asked to select the Google Analytics View you’d like to use to populate data into the report. Megalytic will then generate the report. For reference, here is an example of what a report generated from the Website Summary template looks like.
In addition to the charts and tables, you may notice that there are spaces left open. This is intentional and is done to provide you with room to enter comments that annotate your report.
Creating Your Own Template
You’ve seen how to use the built-in templates available within Megalytic – but how about creating your own? Below we will modify the report we just created and then save it as a new template.
In Megalytic reports, each chart or table is rendered by a specific widget. To build our custom template, we will modify some widgets, delete others, add a new one to create the report we need.
Modifying Date Ranges and Periods
Looking at the first widget in our report, you’ll see a chart showing weekly traffic to the website for the last 13 weeks. For your template, you decide you’d like to show monthly traffic for the last 12 months.
To make this change, simply click on the date range at the top left of the first chart. This will open up the date picker. Change the Period to “Monthly,” and select “Last 12 months” for the Date Range.
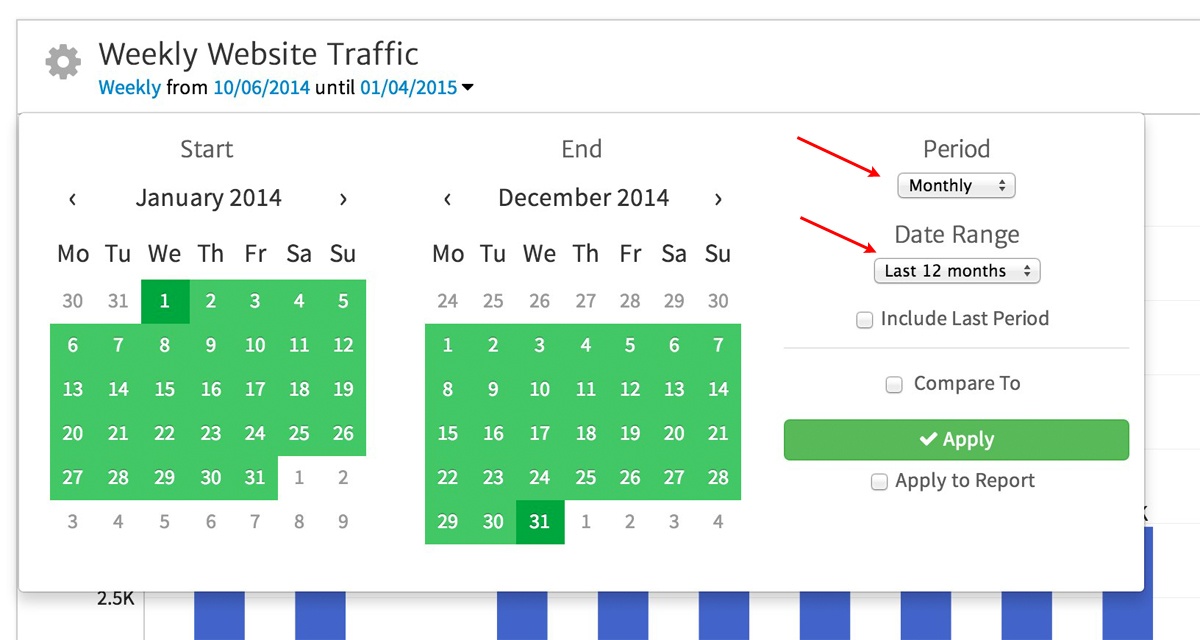
For monthly reporting templates, select Date Ranges that are labeled “Last …..” such as “Last 12 months,” “Last 30 days,” etc. These are referred to as “Rolling Date Ranges” because they automatically update the widget data depending on the calendar date.
For example, in the widget we modified above to use “Last 12 months,” when you generate this report in January, it will show data for January – December. However, next month, when you generate this report, it will automatically advance to show February – January. Using Rolling Date Ranges saves you the effort of having to update the date ranges on your reports each period. This is particularly useful when you are using Megalytic’s scheduled reports feature to automatically send a report each month.
Removing a Widget
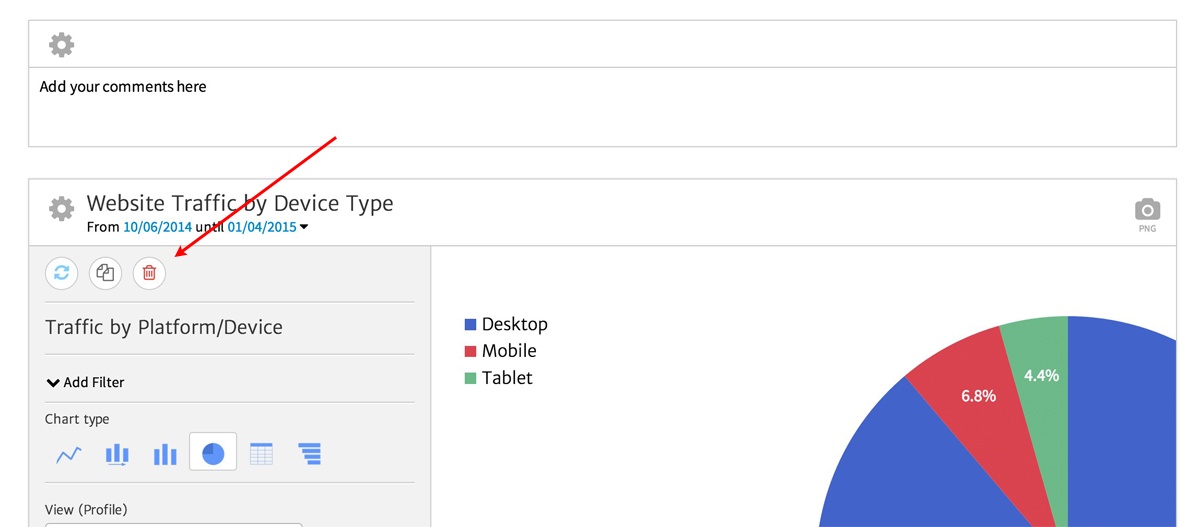
The next widget we want to address is a pie chart labeled “Website Traffic by Device Type.” We want to remove this widget from our template and then resave it so the template no longer includes this widget.
To delete a widget, click on the gear symbol in the upper left corner to open the widget editor. At the top of the editor, you will see a little red trash can symbol. Click on the trash can to remove the widget.
Widget removed.
Adding a Widget
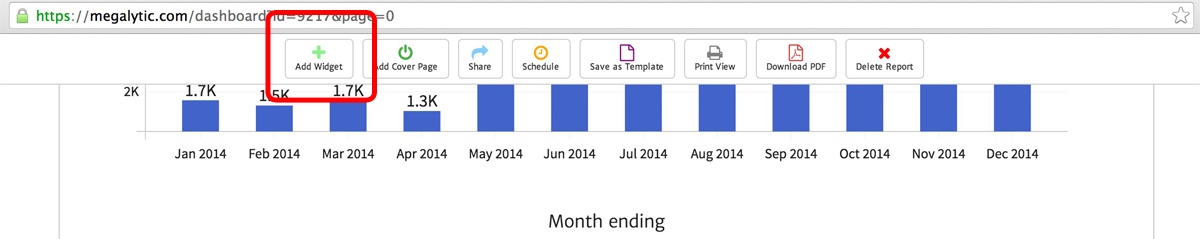
Now that we’ve freed up some space, we’d like to include something new in this report – a set of KPI indicators showing the results for key metrics this month. To do that, click on the “Add Widget” button at the top of your report to open the Widget Library.
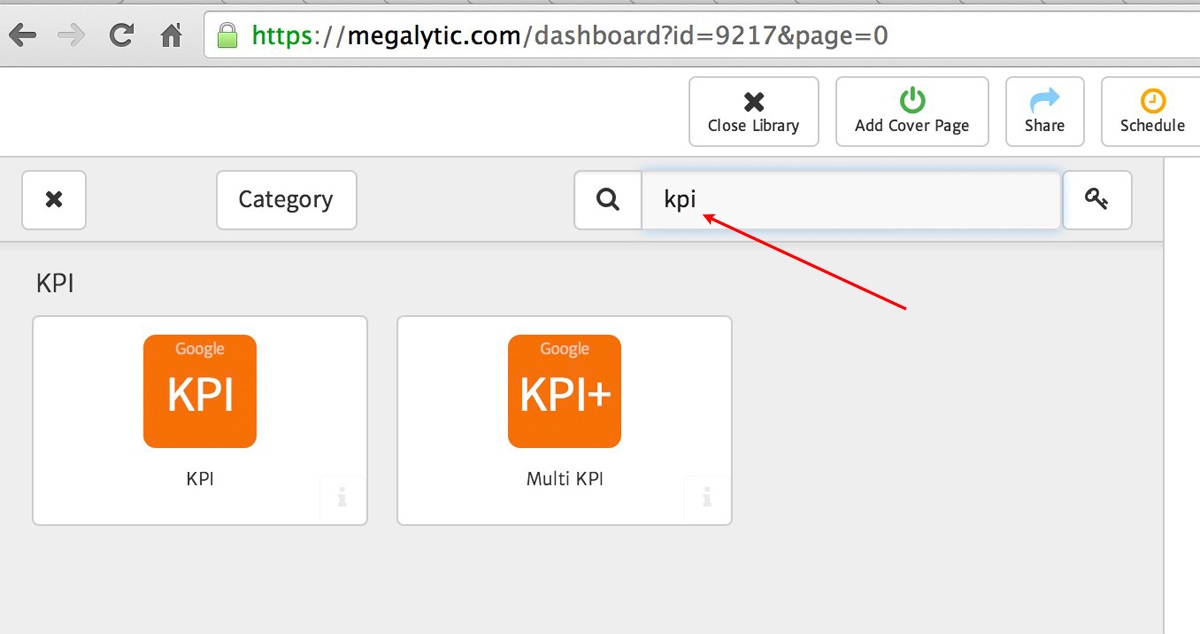
On the left side of your screen, the Widget Library will open. Type “KPI” in the Widget Library search box to filter for the widgets related to KPIs.
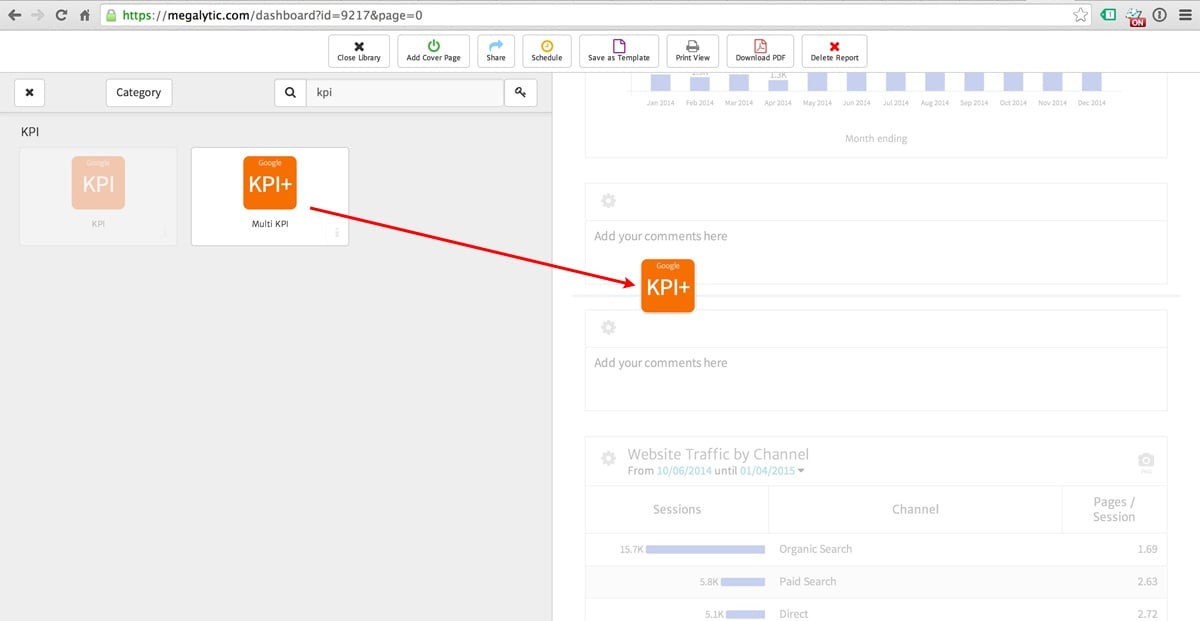
Now, click and drag the “Multi KPI” widget on to your report.
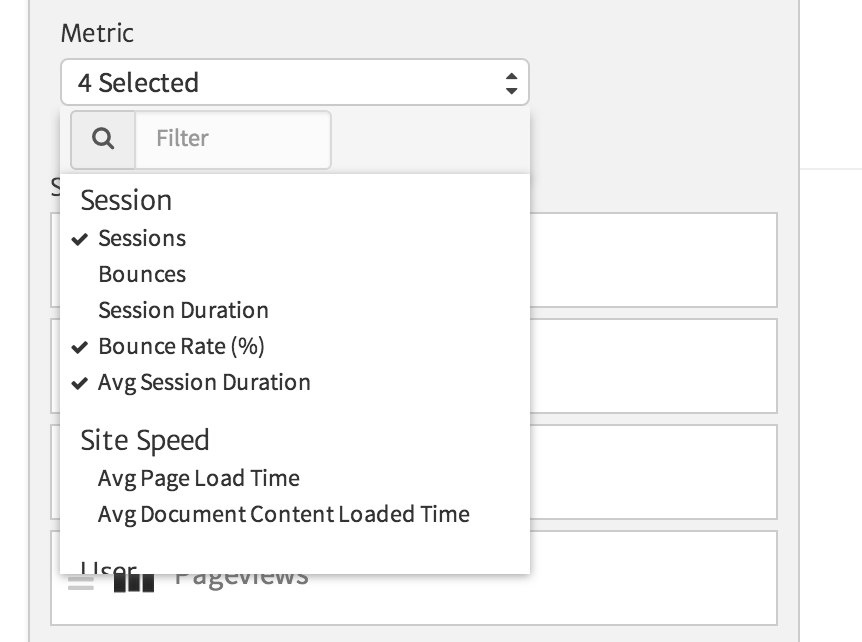
This creates a KPI widget that displays four default metrics: Users, Sessions, Avg Session Duration and Pageviews. If you want to use different metrics, select them from inside the widget editor. As before, click on the gear symbol to open the editor. Then, scroll down in the editor to the selector labeled “Metric.” Choose up to four metrics to show. In this example, we have selected Sessions, Completions, Bounce Rate and Avg Session Duration.
“Completions” refers to Google Analytics Goal Completions. We are going to use this to track the number of new Trial Accounts that have been created. We can do this because we have set up a Goal in our Google Analytics account. For some tips on creating Goals, see Translating Business Goals to Analytics Goals.
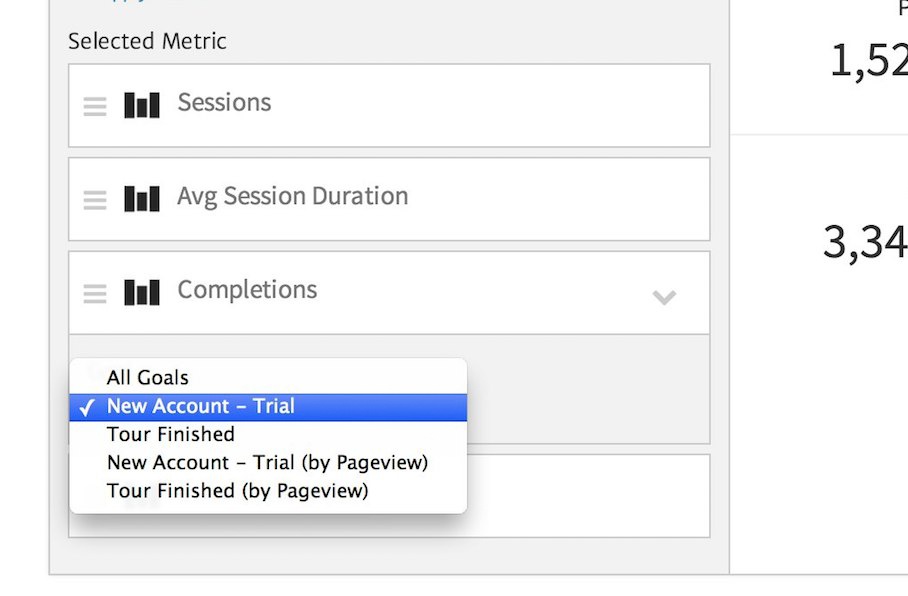
Since your Google Analytics account may be tracking many different Goals, you need to make one additional adjustment to ensure the KPI widget is tracking the “Trial Accounts.” Scroll down a little further in the widget editor to the “Completions” metric and click it to open the Goal picker. In the image below, you can see that we have selected the Goal named “New Account – Trial.”
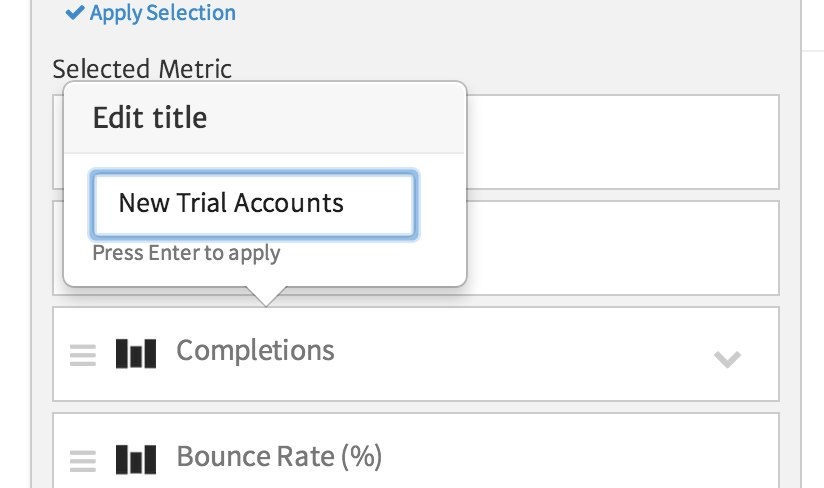
Lastly, we can change the label on the widget from “Completions” to something more descriptive like “New Trial Accounts.” Simply click on the label, as shown below, to edit it.
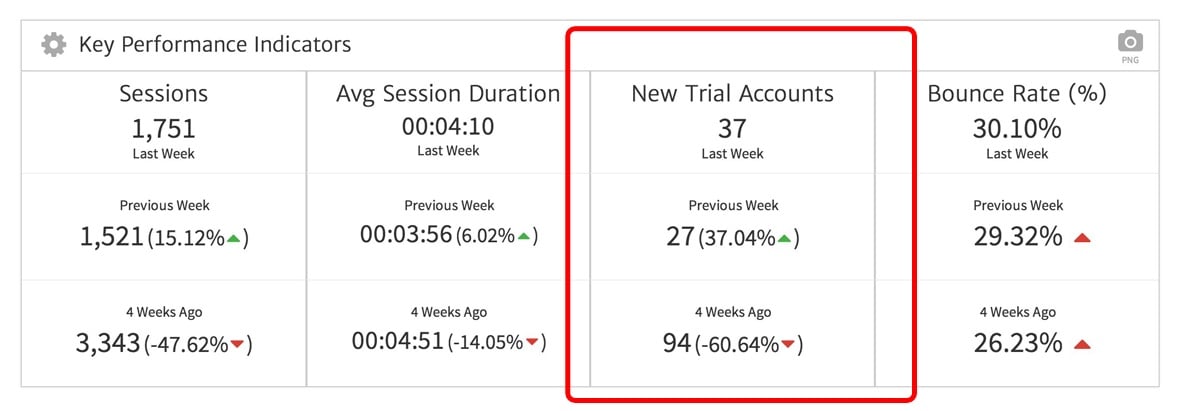
The Multi KPI widget is now completed, and shows the New Trial Accounts along with the other metrics we selected.
Save As Template
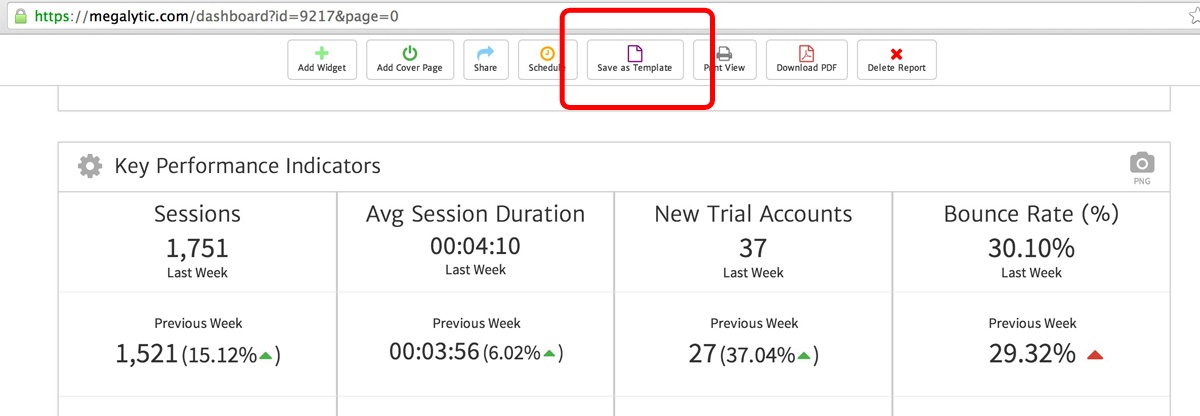
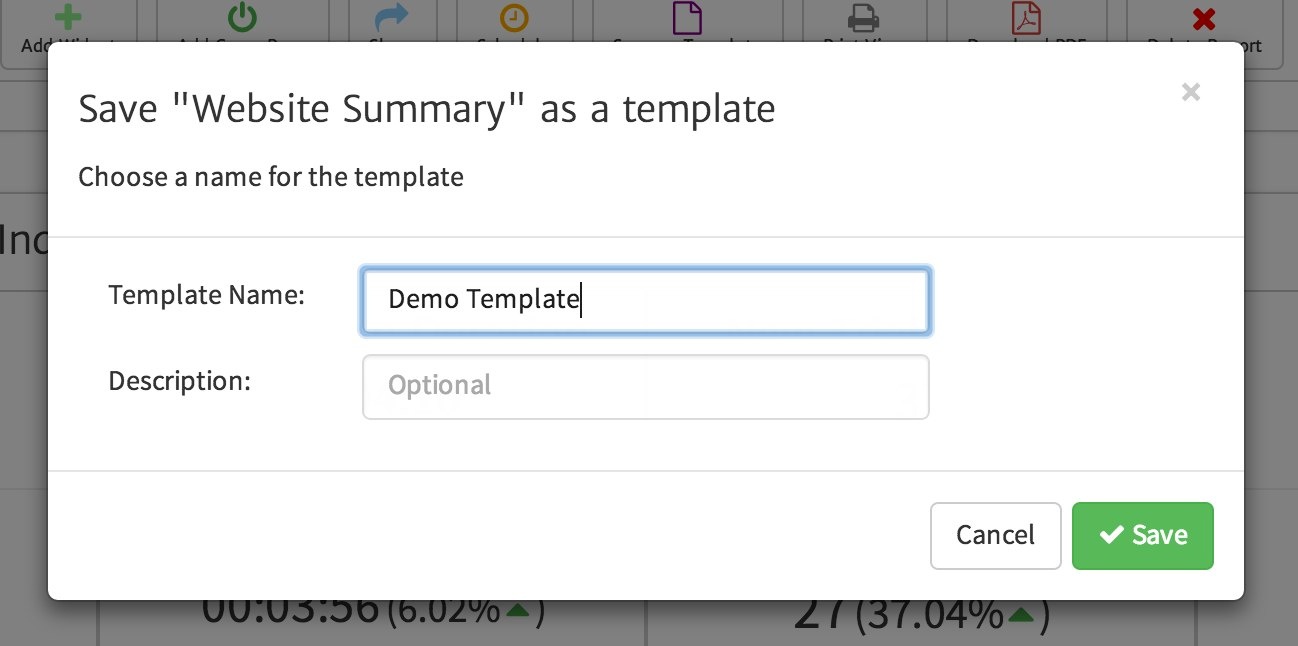
Once you have made the necessary changes to your report, you can save it as a Template. Simply click on the “Save As Template” button at the top of your report.
A window will open where you can name your template. Here, we are using the name “Demo Template.”
Now you can use this template as a starting point for all reports you need to create in the future.
Create Your Next Report Automatically from the Template
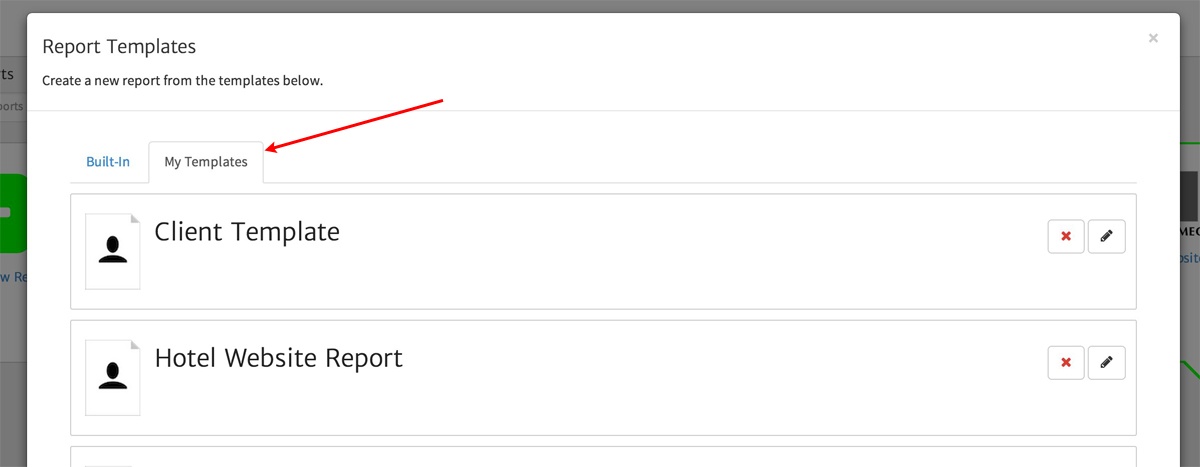
To create a report from your new template, click on “Create a New Report” as shown at the beginning of this post. This time, however, instead of choosing a built-in template, click on the tab labeled “My Templates.”
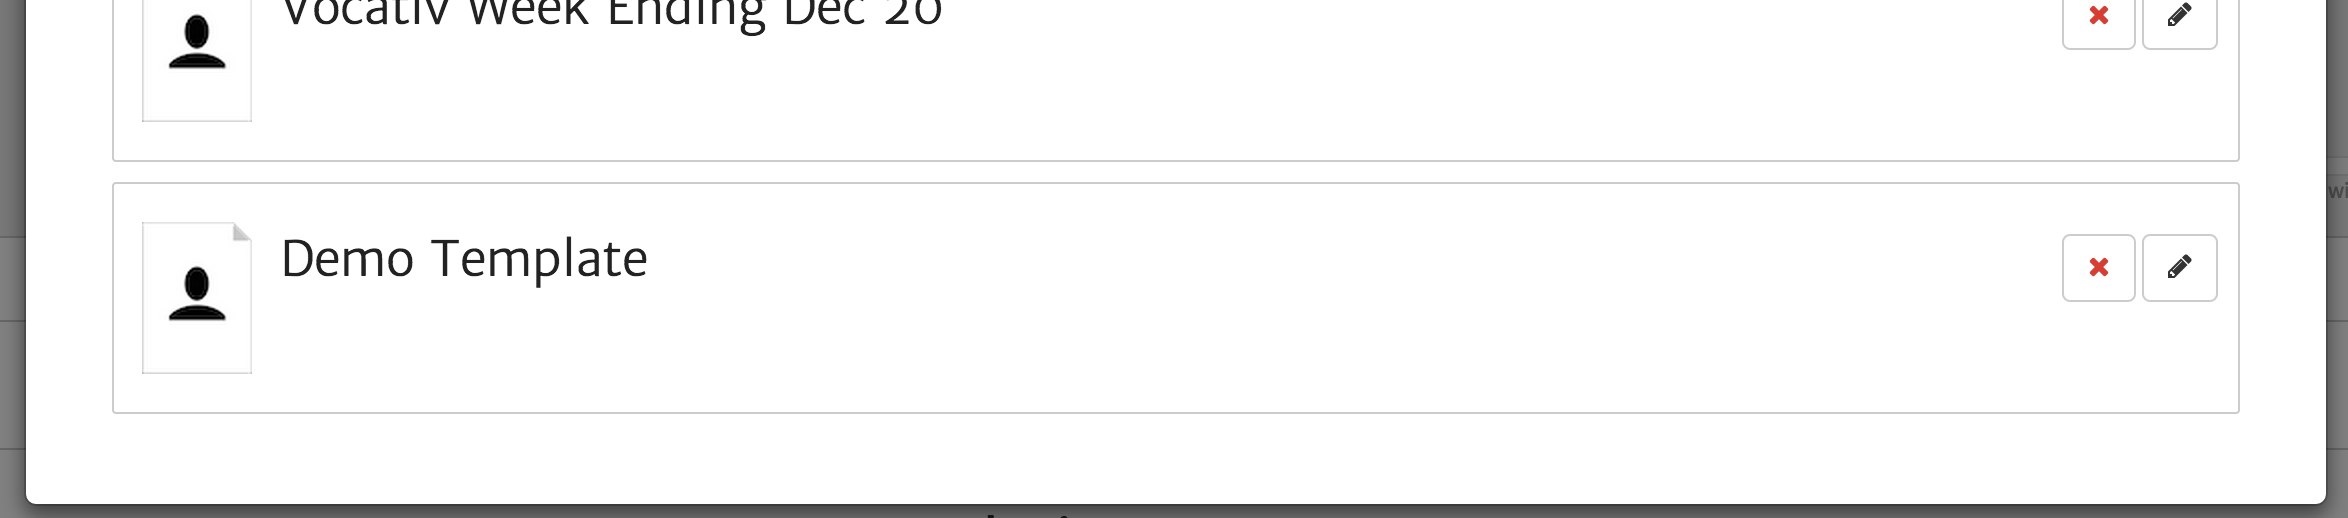
Now, scroll to find the template you just created – “Demo Template.” Click on this, choose a Google Analytics View and a report will be created from your template.
Conclusion
Megalytic helps automate reporting tasks by enabling you to configure your most commonly used reports as Templates. Each time you need to create one of these reports, you can start from a Template you have created and immediately generate all the necessary charts and tables. Finish off the report by adding comments and, possibly, a cover page.
Once you have created a library of Templates, you will find it much easier to handle those situations where your boss needs a report in a hurry, or when you have to produce 30 client reports at the end of each month.

