
Our Blog Content Strategy
This little web analytics blog is part of the marketing strategy we’ve used to build the Megalytic brand. Our blog content is designed to attract and engage those who are interested in analytics and reporting, and who may also be interested in purchasing Megalytic. Not necessarily purchasing the product right away, of course – but eventually. We know that members of this community work for themselves or companies likely to need an analytics reporting automation solution. We want them to know that Megalytic is a brand they can trust to help them simplify their reporting.
So, how do we measure the success of the blog in achieving that goal? How does our analytics insight allow us to adjust our strategy? There are a few ways, and we have been improving on our analytics over time.
Conversions by Blog Landing Page
One of the Google Analytics reports that we look at regularly is Behavior > Site Content > Landing Pages. We use this report to look at the number of Megalytic trial accounts that are created by users landing on a blog page. This give us some insight into how effective each blog post is at driving conversion.
Since we only want to look at users who landing on blog posts, we apply the following filter to this report. This works for us, since all of our blog posts have page paths beginning with ‘/blog/’. You may need a different filter, based on how your blog is hosted.

The resulting report is shown below. I have sorted the report by the column labeled “New Account – Trial (Goal 1 Completions)”. This column reports the number of Megalytic trial signups were completed by users landing on each page.
In order to do this at your company, you will need to have defined and set up the Goals that you want to track for users landing on your blog pages.

From this report, we learn what content drives conversion directly. The trial account signups (Goals) being counted in this report happened in the same visit when the user landing on the blog page.
This report is showing us that content related to analytics report automation leads directly to conversion. Of our highest-converting posts, the top five all directly talk about reporting. Most of our blog traffic comes from organic search, and the conversions shown in this report probably came from users who were already searching the Internet for a reporting solution when they landed on our blog.
Of course, the marketing and brand-building purpose of the blog goes far beyond the number of direct conversions. We also want to create a favorable brand impression with people who are not actively looking for a reporting solution.
We are hoping that visitors come to the blog, remember the Megalytic brand, and visit our site again when they are in need of an analytics reporting solution. In short, we want to know what content is most likely to influence sales.
Cohort Analysis
To get a better sense of which content is most effective at influencing long-term sales, we can use cohort analysis. We create cohorts based on landing pages and dates, then see how engaged those cohorts remain with the Megalytic brand 2-3 months down the road. If they come back to the blog or to the site months after their initial interaction, then the content has probably made a favorable impression and we can conclude that it is effectively building the brand.
Step 1: Creating Segments for Each Blog Post
This cohort analysis begins with creating a segment for each blog post. This allows us to capture users who arrived at Megalytic, and divide them up by the post that brought them here.
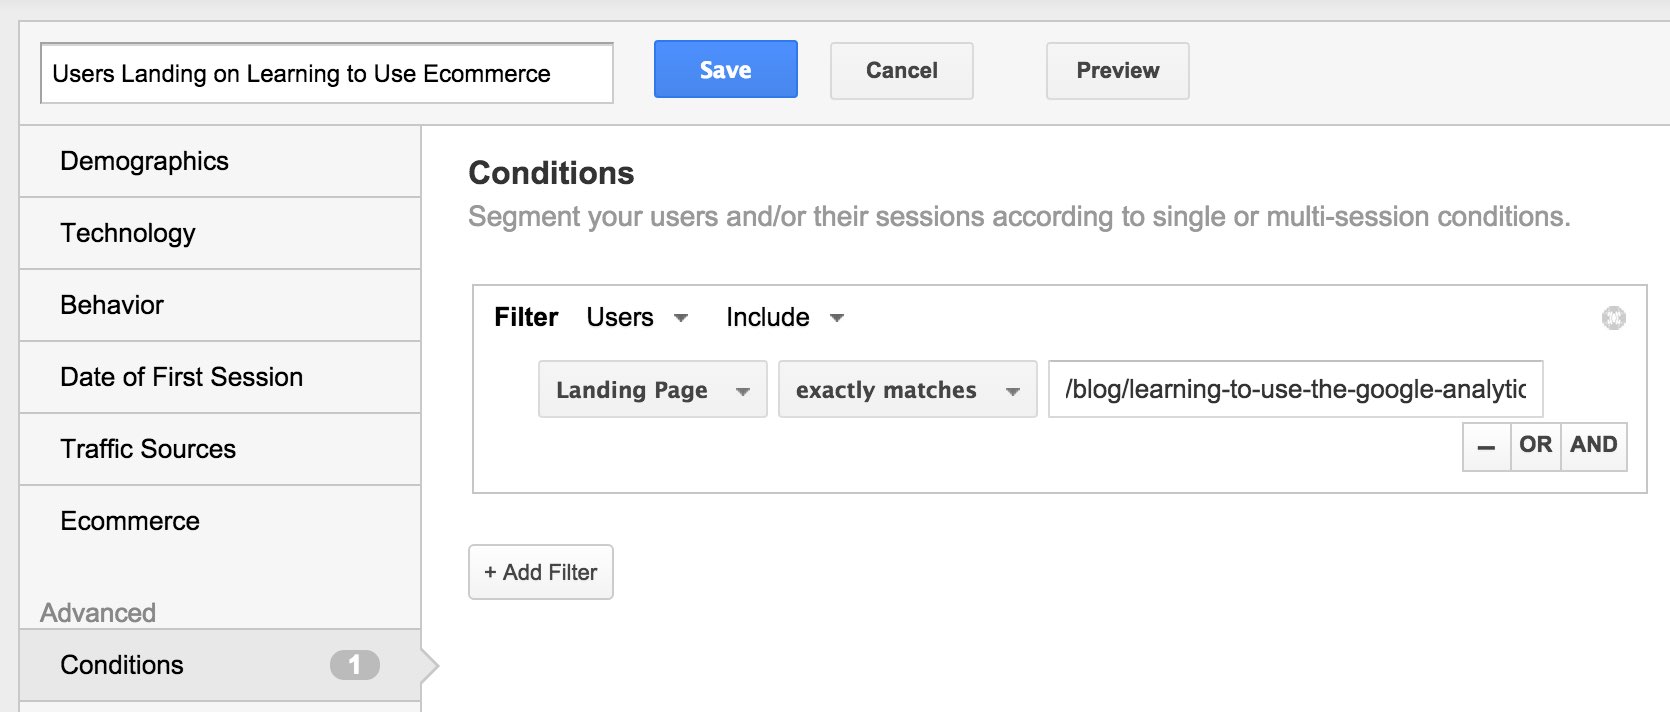
Above is the segment created for the blog post Learning to Use the Google Analytics Ecommerce Reports. Here, we are filtering Users to isolate those Megalytic website visitors who arrived by landing on that blog post, i.e., the Landing Page is “/blog/learning-to-use-the-google-analytics-ecommerce-reports”.
The segment is named with the title of the blog post: “Learning to Use the Google Analytics Ecommerce Reports.”
We create a similar segment for each blog post we publish. We can then use the Audience > Overview report to see the number of website Users who have arrived by landing on specific posts. Below, we see the stats for February – March of 2015.
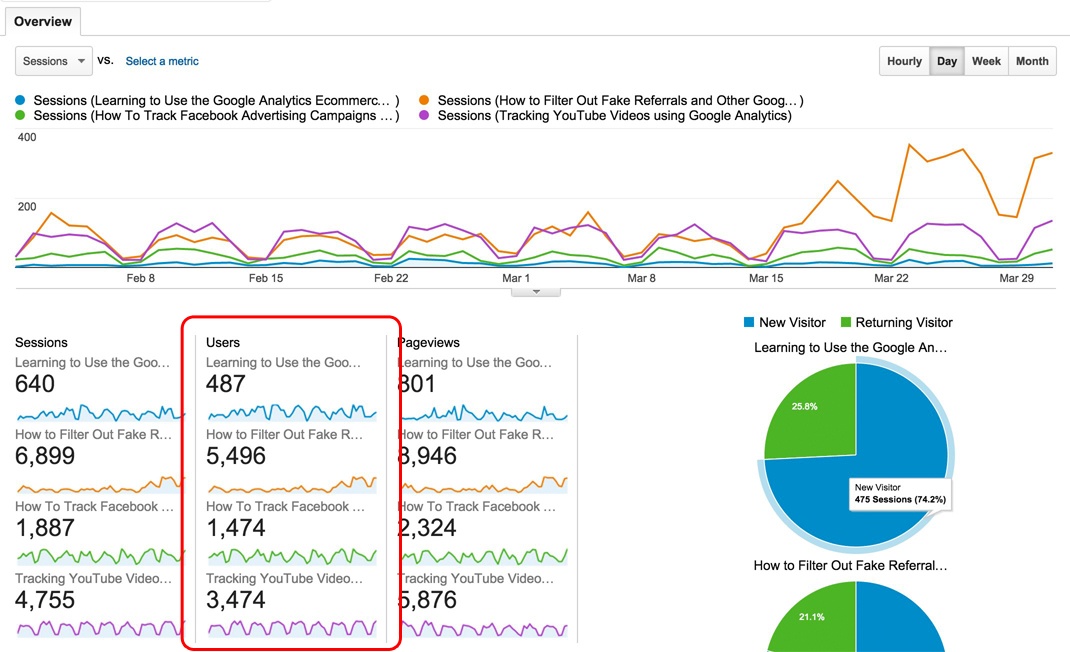
Obviously, some posts bring in many more Users than others. In this example, the post How to Filter Out Fake Referrals and Other Google Analytics Spam brought in 5,496 Users over the two month period, whereas Learning to Use the Google Analytics Ecommerce Reports
generated 487 Users.
While it is important for content to attract as many users as possible, we want to make sure they are the right users. To do that, we need to look beyond the sheer number to measure how well the users are engaging with the Megalytic brand. For example, did visitors skim the post and leave, or did they spend enough time on site to start building an affinity for the brand?
Step 2: Cohort Analysis
To answer this question, we use cohort analysis to measure how likely users are to come back to the Megalytic site after landing on a particular blog post. We want to look far enough out – say, two months – and try to determine what percentage of the users landing on each post are still coming back to visit Megalytic.
To do this, we apply our landing page segments to the Audience > Cohort Analysis report, and focus on “Month 2.”

As you can see, there is quite a variation in the percentages of return visits in Month 2. For example, How To Track Facebook Advertising Campaigns in Google Analytics produced a User retention rate of only 0.68% after two months, whereas Learning to Use the Google Analytics Ecommerce Reports achieved a 1.43% retention rate.
To build the Megalytic brand, we want to create content that has a high retention rate, assuming that the content is attracting readers from our target market—digital marketing professionals. To that end, we try to learn from these numbers, examining the content of high-performing posts and discerning topics that were popular and led to repeat visits.
The result of this analysis has helped us to select blog topics for the next editorial calendar.
At this point, you may be thinking that a high retention rate doesn’t necessarily mean much if the total volume of visits is low. For that reason, we do not stop our analysis with the User retention rate. We take it one step further to look at the total number of Users coming back to the site two months later.
Step 3: Volume of Returning Users
To get the total number of Users coming back to the site, we pull some of the numbers that we’ve been looking at into an Excel spreadsheet.
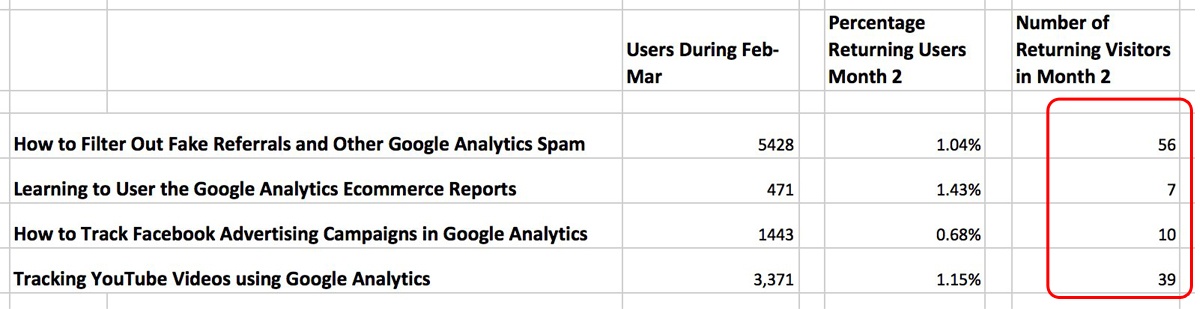
Here, we have taken the total number of Users during February and March (see Audience > Overview report above), and the two month retention rate (from the Cohort Analysis) and multiplied them to calculate the total number of returning visitors in Month 2, for each of the blog posts as landing page.
Notice that How to Filter Out Fake Referrals and Other Google Analytics Spam and Tracking YouTube Videos using Google Analytics brought in the most engaged users–by far, even though they did not have the highest retention rate.
That is because these blog posts attracted a lot of users in the two months of February and March – 5,428 and 3, 371 respectively. These posts did well in SEO and attracted a lot of organic search traffic.
By contrast, Learning to Use the Google Analytics Ecommerce Reports had a higher retention rate (1.43%), but did not attract nearly the same size organic search audience. So, the total impact on returning users is small.
Conclusion
At Megalytic, we aim to create content that builds a sticky audience. This requires a balance between writing blog posts that we think will generate a lot of organic traffic, with creating potentially less popular posts that really pique the interest of our target audience. We rely on analytics, of the type shown here, to inform our decisions about what content to produce. We have found this approach is more effective in building our brand than simply relying on gut instinct.

