Analyze the Year’s Traffic
If you’ve had analytics in place for more than 12 months, you can extend the date range in Google Analytics to show traffic from the entire year, comparing performance to the previous year. In this example, we’re looking at the Audience > Overview report to get the big picture on how sessions, users and engagement metrics fared for 2014 vs 2013.
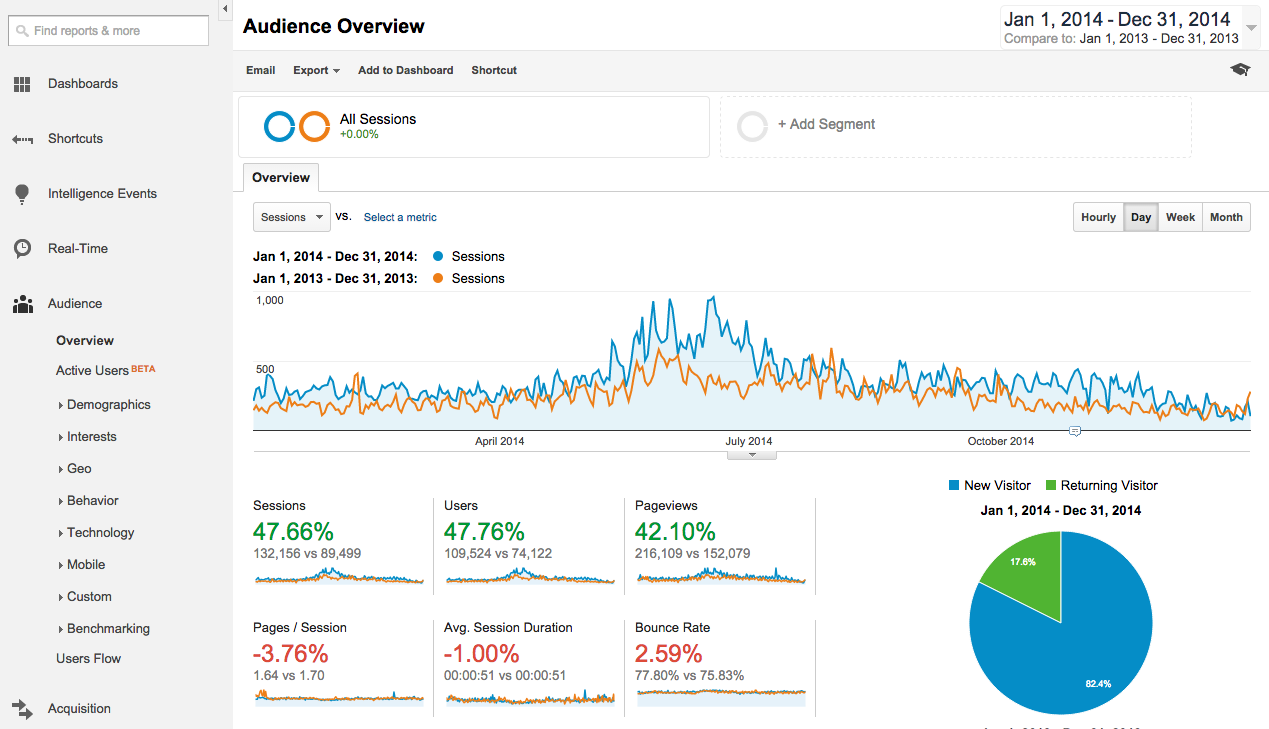
The graph and metrics in this report provide a few quick insights:
- Sessions, Users and Pageviews all increased greatly from the previous year.
- Pages / Session, Average Session Duration and Bounce Rate worsened slightly, but the amount of change is negligible.
- The graph spikes around May-July, reflecting seasonal trends in which this company’s business increases during warmer weather. This summer increase was proportionally larger in 2014 than during 2013.
While reviewing the numbers, it’s important to have a general knowledge of the business’ activity over the past year to help us interpret the data. Analytics should never be read in a bubble, as the metrics are driven by influences from offline advertising to trade shows to grand openings to great PR placements. In this case, the business launched a branch in a new region at the beginning of 2014, ran a heavy volume of paid advertising online, and undertook a variety of search engine optimization efforts.
From the results shown above, we can see these efforts have paid off. It is particularly encouraging to see the significant increase in traffic with almost no dropoff in the engagement metrics (Pages / Session, Average Session Duration, and Bounce Rate). However, we also want to know where the increased traffic came from and how successfully visits are translating into leads for this business.
Traffic Sources
Next, we’ll review traffic sources for the year, reviewing the Acquisition > All Traffic report with the Primary Dimension (right under the graph area) set to Medium to give us a bigger picture view. Once again, we’ll set the date range to cover all of 2014, comparing to 2013.
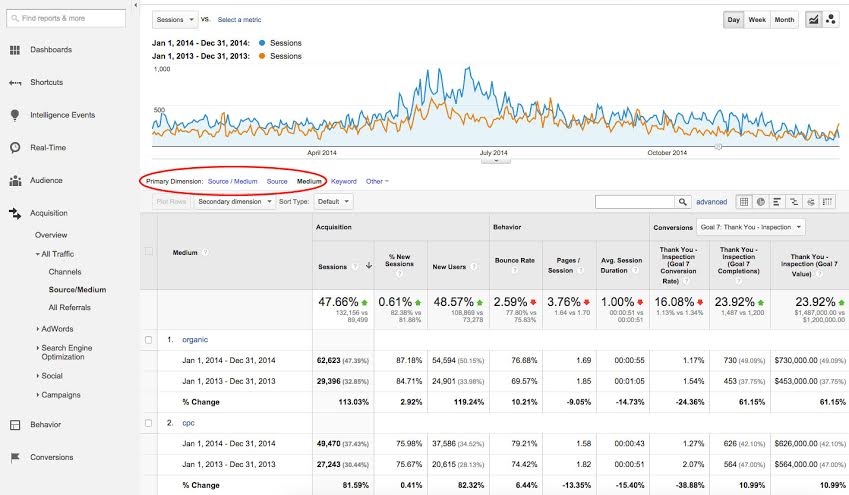
From here, we see that organic search and paid traffic (shown as cpc) top the list based on volume of sessions. We can see that organic drives the most Sessions and New Users, along with the most conversions from the “Thank You” goal in the right columns.
Organic traffic has more than doubled from the previous year (113.03% increase), but the volume of conversions has not increased at the same level (61.15% increase). Part of this can be explained by the success of the business’ search engine optimization (SEO) efforts. The business has begun to earn national rankings for its most important keywords, so many visitors coming from organic may be located outside of the company’s local service areas. Since visitor from outside the local service areas are unlikely to convert, we would expect to see a decrease in conversion rates.
In fact, that is what has happened. You can see that the conversion rate (third column from the right) has gone down for both organic and paid traffic. As a next step, it would be good to create a custom segment for visitors from the local service area and check to see if conversion rates have dropped as much from local visitors as they have overall.
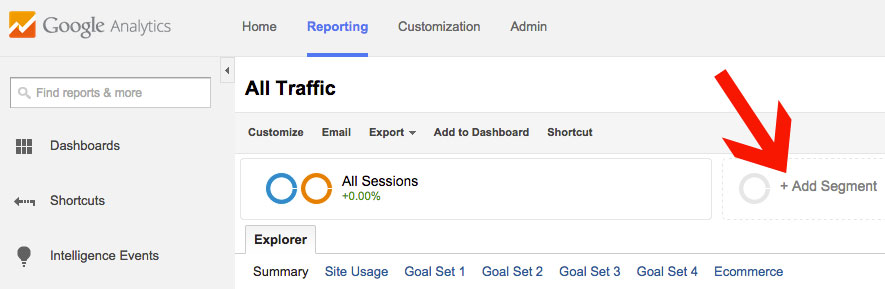
To create a custom segment, select “Add Segment” above the graph in the Analytics reporting view.
Next, a window will appear to create your segment. Go to “Conditions” in the left sidebar and set up a filter for your desired region(s). In this case, we’ll filter so Region contains any of the states where this company does business.
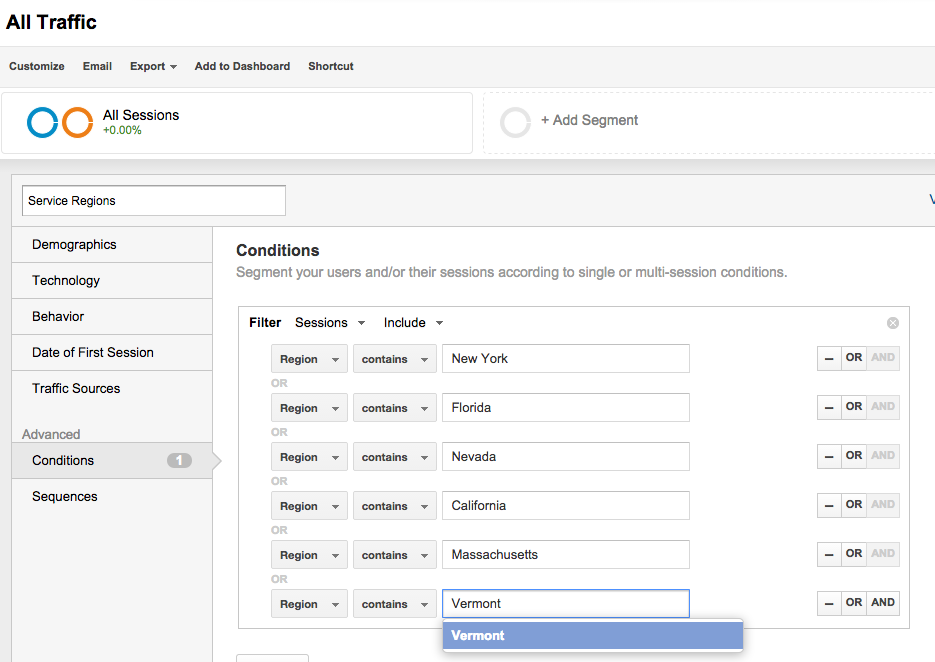
Now, select the new Service Regions filter and the All Sessions filter to compare stats from the main service area vs stats as a whole.
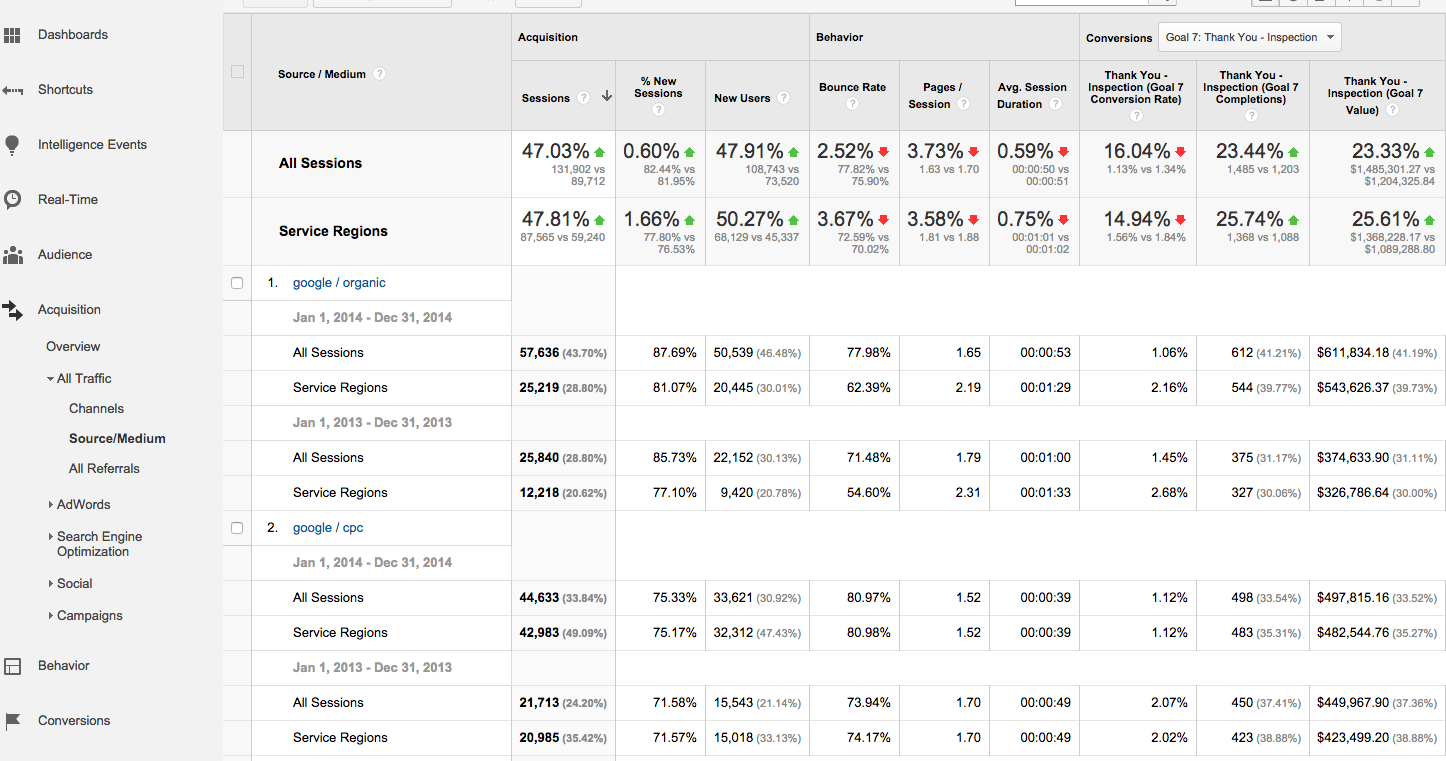
We can see that conversion rate has decreased in the service regions and across the board (although with a slightly lower decrease in service regions). In addition, we note similar decreases in engagement across the board. However, we also see traffic specifically from Google organic shows much lower Bounce Rate, more Pages/Session, and longer Avg. Session Duration in service regions than in general, as well as higher conversion rate. This data does show that the organic traffic being driven in the business’ service areas is of a higher quality, likely to include potential customers.
Social Referrals
If one of your goals for social media is to drive people to the website, you’ll want to look specifically at social traffic and conversions to determine how well Facebook, Pinterest, Twitter and other networks are driving traffic. To view social referrals in Google Analytics, navigate to the Acquisition > Social > Network Referrals report. This report breaks down Sessions by Social Network, along with Pageviews, Average Session Duration, and Pages / Session, to give an idea not only of how many people are visiting but how they are engaging with content.
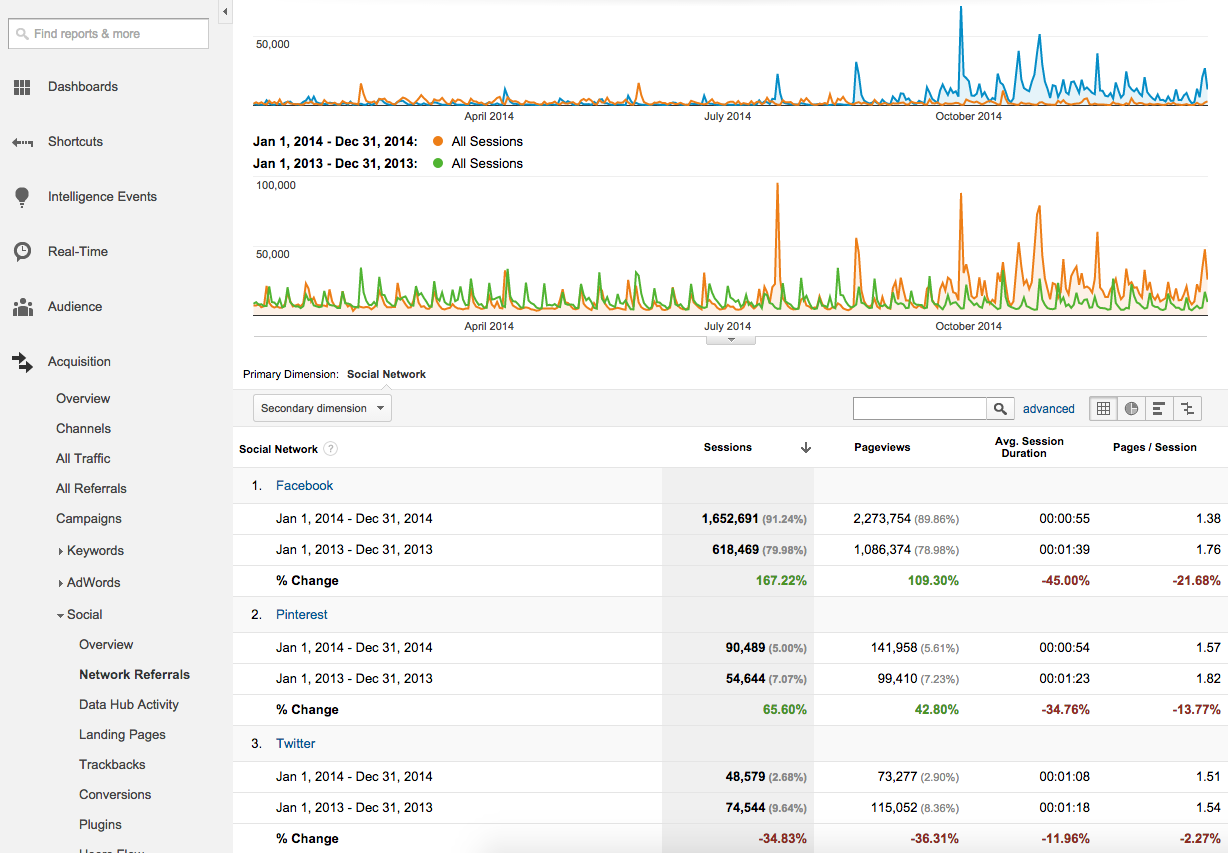
In this example, we see social referrals from a site that relies heavily on social media to drive users to read content. Over the past year, we see Facebook traffic has increased significantly, with 167.22% more sessions in 2014 than 2013. However, this increase in volume has sacrificed engagement, resulting in significantly lower Average Session Duration and Pages / Session. In fact, every major network shows lower engagement, including Twitter, which actually saw a decrease in total Sessions as well.
Based on this data, we can conclude that sheer volume of traffic is not necessarily a good thing, particularly when the new visitors are not reading much content and thereby driving down the engagement metrics. On the plus side, it is clear that a large following on Facebook exists with interest in this site’s content. Note that there are a few spikes on the graph, indicating specific posts that drove significant numbers of Sessions on the site.
The lower engagement on site across social networks raises further questions as to why people were spending less time and looking at fewer pages. For tips on looking further into the behavior of visitors from social media, see this post on Social Insights from Google Analytics.
Popular Posts
To investigate concerns about engagement with content, take some time to review top content from the year, looking at not only how many people landed on these pages but what percentages bounced off or spent more time on the site.
Since this site sees a lot of its heaviest traffic on the blog section, we’ll look at landing pages (Behavior > Site Content > Landing Pages) sorted by sessions. Next, we’ll filter to specifically show blog posts by typing “blog” into the search bar.
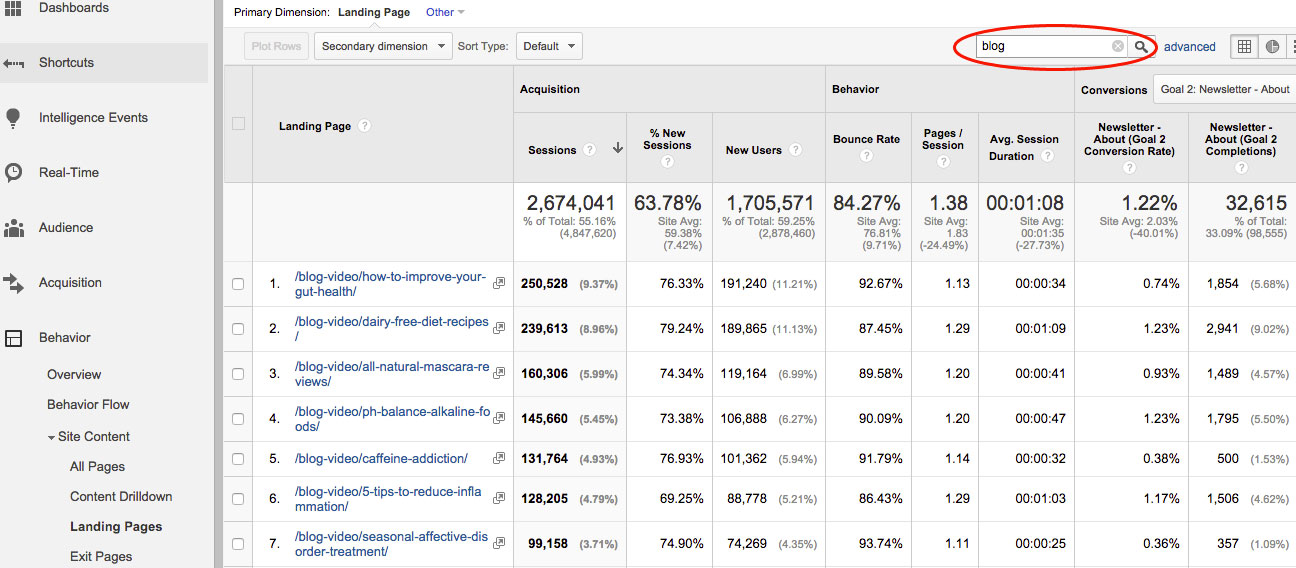
From here, we can dig further into the poor engagement seen on the site. First, we can see that all of our popular posts show incredibly high bounce rate, around 90%. This is considerably higher than the site average of 77% (which is still high but, better). In addition, several posts show very low Avg. Session Duration and Pages/Sessions. Essentially, this data indicates the vast majority of visitors looked at one post and immediately left, without browsing elsewhere on the site.
Based on this page data, we may recommend revising the blog layout on the site to better encourage users to read more content. Possible changes may involve adding related posts, as well as promoting recipes and other sections of the site more prominently.
Device Breakdowns
Mobile devices are well established in the mainstream of users, and the percentage of people browsing the web on phones or tablets vs. desktops or laptops continues to grow. Pay attention to what devices people are using to access your site, and make sure your site renders properly on the top devices used by your visitors. Looking at this data across a whole year will help to show you how the devices used to read your content are changing over time.
To get a high level overview of devices, access the Audience > Mobile > Overview report. From the icons to the right under the graph, select the pie chart symbol. This chart will allow you to show your client or boss a snapshot of how much traffic comes from desktop, mobile, and tablet.
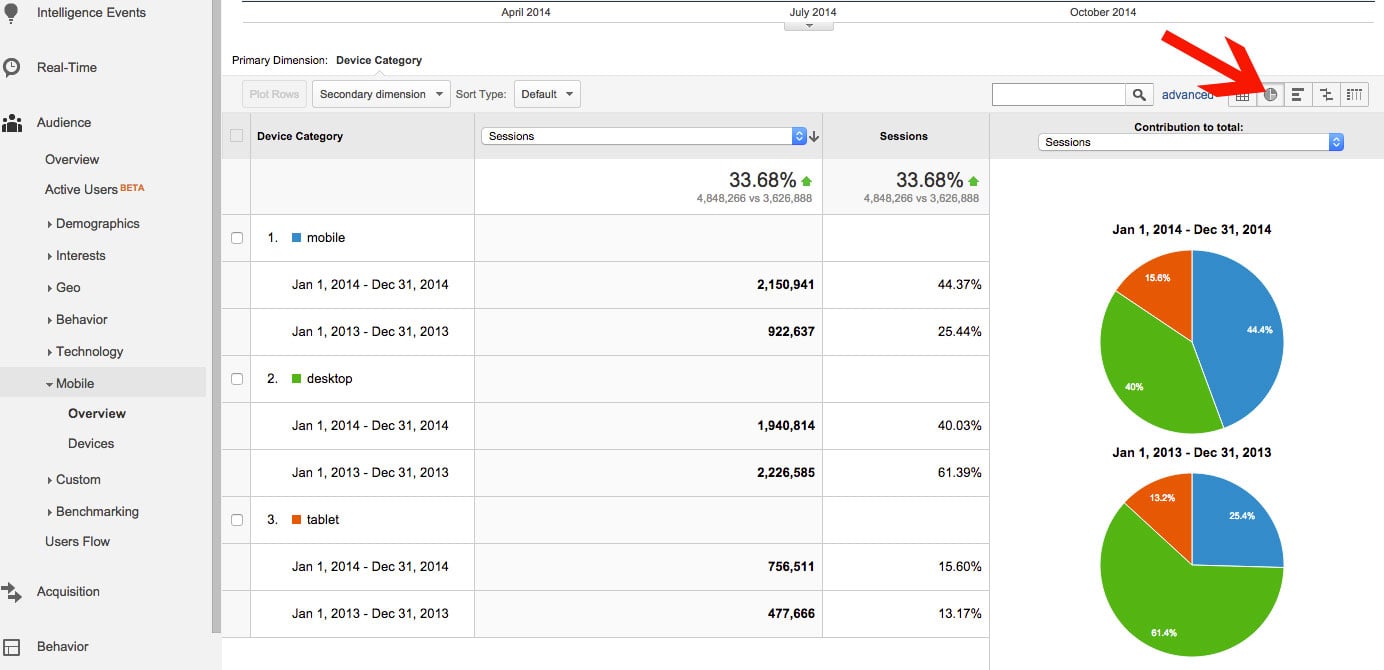
In this example, we can see how dramatically mobile traffic has risen, with 44% of sessions coming from mobile in 2014 vs. 25% in 2013. This data can be helpful in convincing cautious spenders of the need to invest in a responsive site and to make sure mobile users have no problems using the site, whether reading articles or making purchases.
Conclusion
Whether compiling a year-end report for a boss, presenting search engine optimization results to a client, or simply reviewing metrics for personal awareness, take some time to look at data from past 12 months to analyze the year as a whole. Compare to the previous year, looking for both improvements to point out, as well as problems to flag. Use the data to guide decisions about search engine marketing, content, social strategies, and website revisions for the coming year.

