Why Segment Data by Network?
Breaking out performance by network allows you to illustrate to clients how search and display can show vastly different performance, instead of lumping the numbers together. For instance, a clickthrough rate below 1% is generally considered bad in search, while a clickthrough rate of 0.15% is perfectly normal for the display network. When you average these clickthrough rates together, the overall number doesn’t reflect that statistics from multiple networks have been combined, skewing the actual results.
While you can show performance by campaign, grouping data by network allows you to show a bigger picture breakdown of how Google search, display, and search networks perform across an entire account. This data demonstrates how Google search and search partners often provide varying results. If you find that search partners aren’t converting, or are driving a significantly higher cost per conversion than Google, you may want to turn off advertising on search partners.
Configuring the AdWords Networks Widget
When you first add the AdWords Networks widget, you’ll be asked to choose the AdWords account you’d like to connect. Now, you’ll see a table showing a default set of data for your account, broken out by Google search, display network, and search partners.
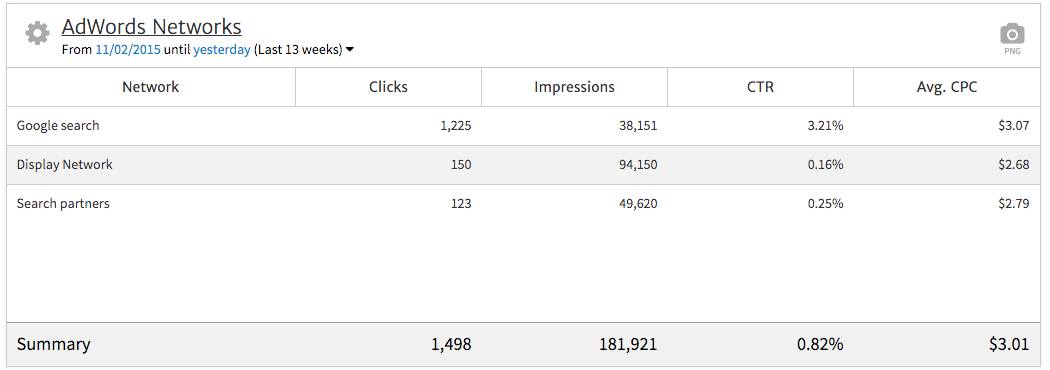
Right away, we’re able to see vastly different stats shown among the three networks. Google search, by far, shows the highest CTR, at 3.21%. Search partners received a CTR of only 0.25%, incredibly low for search. Also, the display network received a CTR of 0.16%, on par for display but also very different from Google search. Also note that CPC cost the most, by far, on Google search.
Of course, these four metrics only tell part of the story. We’d ultimately like to measure how each network contributed to lead generation for this website by looking at conversion data.
To do so, we’ll edit the widget options by selecting the gear symbol in the upper left. Next, we’ll scroll down to the Columns dropdown, remove some of the existing columns, and replace them with conversion-related metrics. In this case, we’ll show Clicks, Cost, Converted Clicks, Click Conversion Rate, and Cost/Converted Click.
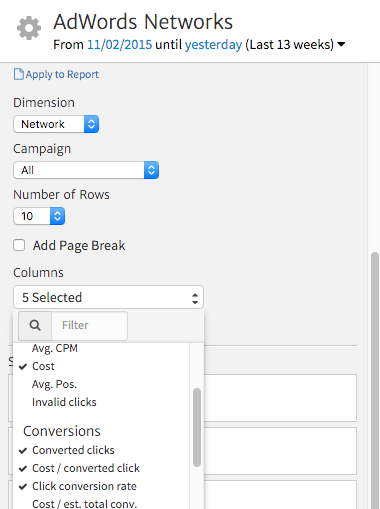
Finally, we’ll click “Apply to report” to update it with our new metrics.

Here, we can see that despite the lower CTR, search partners actually drove a higher conversion rate at a lower cost per conversion than Google search. While this often isn’t the case, we can recommend keeping marketing on search partners active for this account. Also, the display network has driven the lowest cost per conversion at the highest conversion rate, due to remarketing being a significant part of this client’s display advertising spend.
While we note that Google search shows the highest cost per conversion and the lowest conversion rate, it does drive, by far, the highest volume of conversions. From this data, we can note that search is providing value, although there is opportunity to drive down the cost per conversion on Google search specifically.
Comparing Performance by Device
The AdWords Network Widget also allows you to segment performance by device, comparing metrics among computer (desktop/laptop), mobile (phone), and tablet. To switch, choose Device from the Dimension dropdown in the widget options.
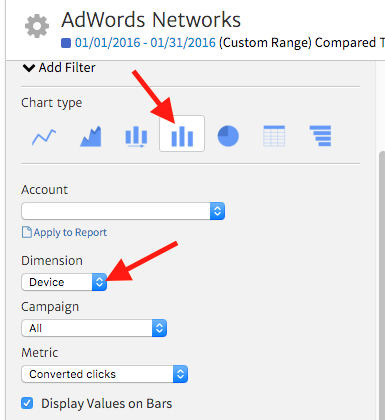
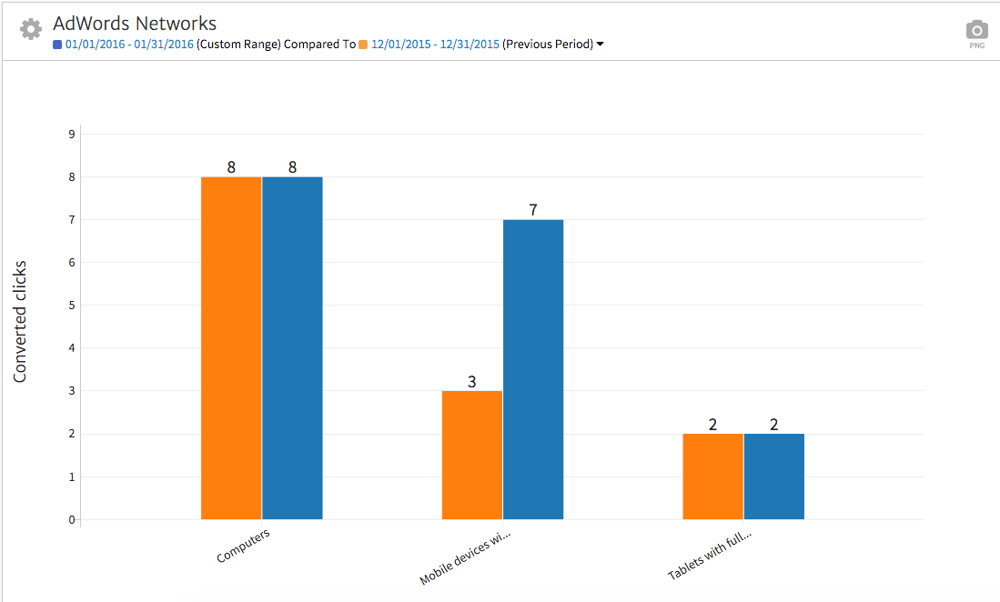
For this example, we’ll look at conversions by device, using a bar chart to easily compare volume. We’ll update the chart type at the top of the widget options and select Converted Clicks from the Metric dropdown. We’ll also use the date selector to choose a comparison date range to see how these statistics have changed from one month to the next.

From this data, we can see that computers have driven the highest volume of conversions each month, with numbers remaining steady. Mobile has shown a breakout in performance, with seven conversions compared to three in the previous month. We can credit this to the client promoting a downloadable resource, instead of a product demo – an easier-to-consume item for those on mobile screens.
Of course, any time metrics show a dramatic increase or decrease, you should call out the reason using a Notes widget. Answer your clients’ questions before they even ask!
Segmenting by Click Type
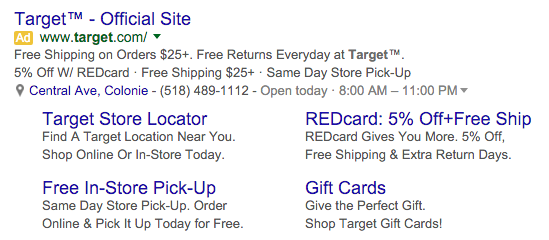
Ad extensions are a type of ad format that show extra information about your business, “extending” your ads, and providing users with alternative click options beyond the ad headline. For instance, in the Target ad below, you can click on the store address to get directions in Google Maps, or you can click any of the four sitelinks below the main ad. If you searched from a mobile device, you could even click to call the store directly instead of going to the site.
This widget also allows you to choose Click Type as a dimension, comparing click volume for ad headlines, sitelinks, phone calls, and map directions. You can also look at conversions that occurred from each of these.
To update your widget, select Click Type from the Dimension dropdown in the options. For this report, we’ll choose to analyze data from one particular campaign, using a Table Graph to easily compare the volume of multiple metrics.
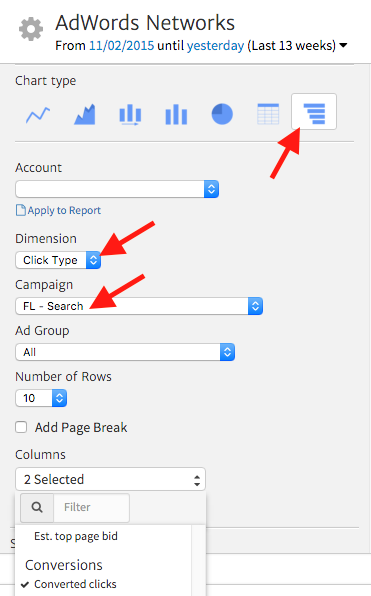
We’ll also select Converted Clicks as a metric to look at alongside clicks to see how different click types contributed to leads. Once we’ve applied our settings, we can see the final widget breaking down click type statistics.
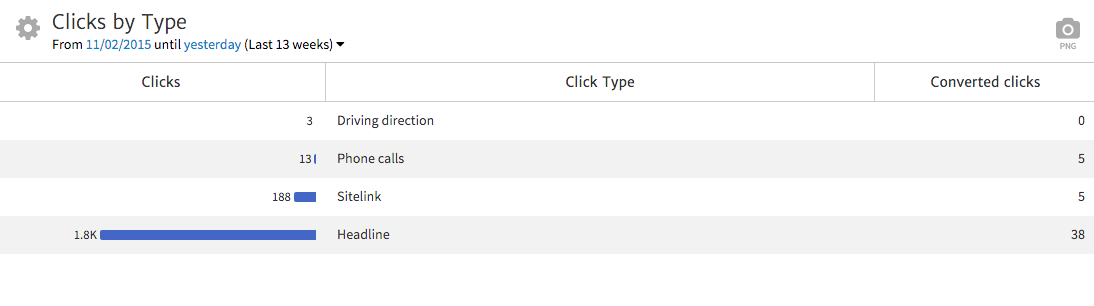
While headline clicks will naturally show the majority of volume, we see that sitelinks have attracted close to 200 clicks over the course of the campaign. In addition, we’ve driven a few clicks-to-call and requests for driving directions. This data can help to show clients how users are engaging beyond a simple website visit, if they’re choosing to call a business or seeking to drive there directly.
Conclusion
The AdWords Networks widget offers the benefit of segmenting advertising data in multiple ways. You can analyze performance by network, device, or click type, portraying information in charts from bar graphs to tables. This data can, in turn, provide deeper insight into how well your campaigns are contributing to your clients’ lead generation goals, while guiding decisions to reallocate spend by network or device.

